Bulls managed on a negative plane of nutrition for 112 days have increased abundance of mammalian Target of Rapamycin (mTOR) in testicular biopsies
(AS2040-13, September 2021)The objective of the current study was to determine the effects of divergent planes of nutrition in mature beef bulls on nutrient sensing pathways and androgen receptor abundance in testicular tissue. Abundance of a key regulator in nutrient metabolism pathways, mTOR, was decreased in bulls on a positive plane of nutrition, which could contribute to differences in sire fertility or messages carried in sperm to future offspring.
This article is part of the 2021 North Dakota Livestock Research Report.
Experimental Procedures
Fifteen Angus bulls of 4 to 5 years of age from the Central Grasslands Research Extension Center near Streeter, ND were utilized for this study. Bulls were randomly assigned to one of two treatments: 1) a positive plane of nutrition managed to gain 12% BW (POS, n = 8); or 2) a negative plane of nutrition managed to lose 12% BW (NEG, n = 7) over a 112-day period prior to the breeding season. Bulls were housed at the Beef Cattle Research Complex in Fargo, ND and individually fed using the Insentec Roughage Intake Control System (Markenese, Netherlands) with feed allocations adjusted bi-weekly to achieve targeted growth trajectory. On day 113, testicular biopsies were performed on all bulls using a procedure modified from Heath et al., (2002). Briefly, bulls were restrained in a hydraulic Silencer chute and the scrotal area was scrubbed with iodine and cleaned with alcohol. At the biopsy target site (approximately 5 cm below the head of the epididymis on the lateral aspect of the left testicle), 3mL lidocaine was administered as a local anesthetic. A 14-guage x 10 cm automatic biopsy need (AccuCore Single Action Biospy, Inrad, Kentwood, MI) was inserted into the testicle, penetrating the parietal and visceral vaginal tunics and tunica albuginea, with care to avoid the epididymis. Two biopsy cores of parenchyma were collected from the left testicle.
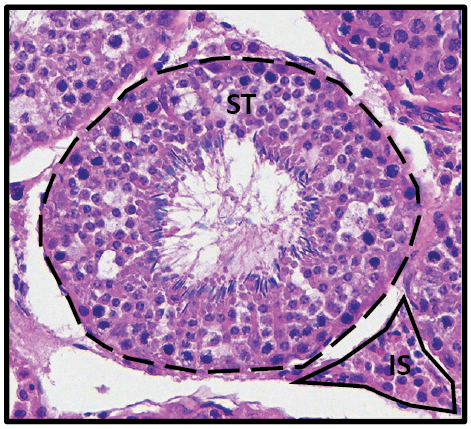
The tissue sample was placed in a 10% formalin fixative solution, embedded in paraffin, cut in 5 μm thick sections using a microtome and placed on a glass slide. Immunohistochemistry on the slides was performed, as previously described (Crouse et al., 2021). Briefly, sections were deparaffinized, rehydrated, and underwent antigen retrieval. Slides were stained with monoclonal antibodies to either mTOR (ab32028; Abcam), p-mTOR (ab109268), or AR (ab74272). This was followed by incubation with IgCF633 fluorescent antibody and counterstaining with DAPI. Images were captured at 40×s magnification with an inverted microscope with laser scanning head attachment. Testicular parenchyma consists of 2 distinct regions, the seminiferous tubule containing SC and developing sperm, and the interstitial space, or space between the tubules (Fig. 1).
For each bull, three to five seminiferous tubules were randomly selected for image capture. The image was further processed with image analysis software to measure optical density of fluorescence staining within the seminiferous tubule and interstitial space, which is defined as the relative fluorescence intensity of staining divided by the pixel area of the selected field. Sertoli cells were characterized by the presence of AR within the nucleus, with remaining nuclei in the tubule characterized as a germ cell. The number of SC and germ cells per seminiferous tubule were counted and a ratio generated by dividing the number of germ cells by number of SC.
Data were analyzed using the GLM procedure of SAS (Ver.9.4, SAS Inst. In., Cary NC) for the effect of plane of nutrition (POS or NEG) with bull as the experimental unit. Significance was set at P ≤ 0.05 and tendency at 0.05 < P ≤ 0.10. Data are presented as means ± standard error (SE).
Results and Discussion
No differences were observed between treatments for the measurement of optical density fluorescent staining for total mTOR within the seminiferous tubules (P = 0.89) or in the interstitial space (P = 0.86; Table 1; Fig. 2C – D).
| Item | NEG-Mean | NEG-SE | POS-Mean | POS-SE | POS-P-value |
|---|---|---|---|---|---|
| Seminiferous Tubule | |||||
| mTOR | 362.6 | 69.6 | 348.8 | 69.6 | 0.89 |
| p-mTOR | 1256.5 | 167.4 | 759.4 | 178.9 | 0.06 |
| Ratio (p-mTOR/mTOR) | 4.0 | 0.9 | 2.8 | 0.9 | 0.32 |
| AR | 2588.2 | 626.4 | 3028.2 | 669.7 | 0.64 |
| Interstitial Space | |||||
| mTOR | 107.5 | 14.8 | 111.2 | 14.7 | 0.86 |
| p-mTOR | 179.9 | 19.3 | 80.1 | 20.6 | 0.004 |
| Ratio (p-mTOR/mTOR) | 1.8 | 0.2 | 0.8 | 0.2 | 0.009 |
| AR | 896.5 | 144.3 | 1003.0 | 154.3 | 0.62 |
Treatments were POS = bulls managed on a positive plane of nutrition over 112 d; NEG = bulls managed on a negative plane of nutrition over 112 d. AR = androgen receptor; mTOR = mammalian Target of Rapamycin; p-mTOR = phosphorylated mTOR; SE = standard error; ST = seminiferous tubule
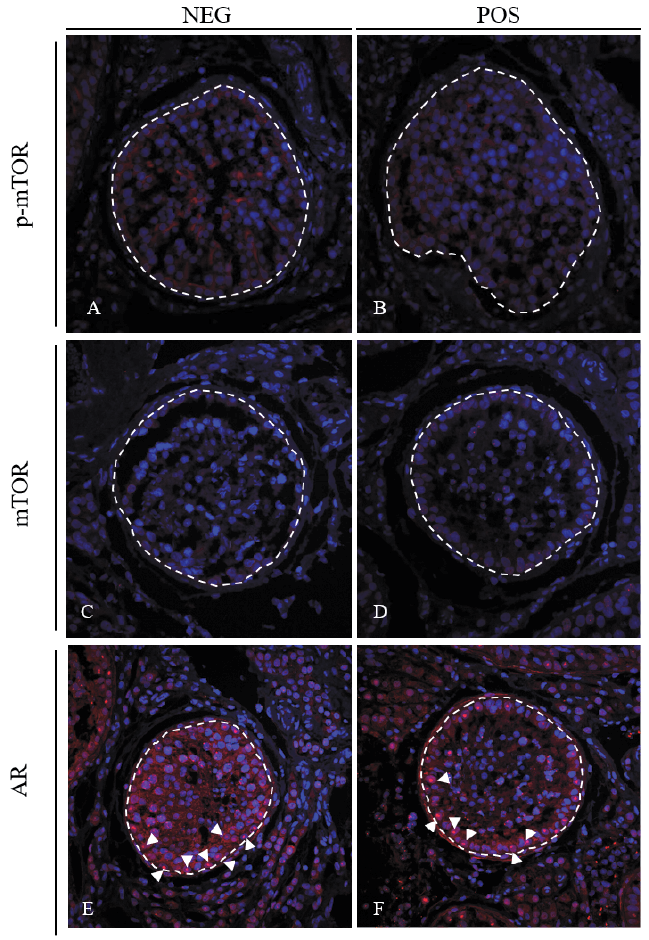
However, p-mTOR was increased in the interstitial space (P = 0.0037) and tended to be increased in the seminiferous tubules (P = 0.06) of NEG bulls compared with POS bulls (Table 1; Fig. 2A – B). No differences were observed for AR between treatments within the seminiferous tubules (P = 0.64) and interstitial space (P = 0.62; Table 1; Fig. 2E – F). The number of Sertoli cells (P = 0.78) and germ cells (P = 0.35) per seminiferous tubule, as well as the ratio of germ cells to Sertoli cells (P = 0.21) were not different between treatments (Table 2).
| Item | NEG-Mean | NEG-SE | POS-Mean | POS-SE | POS-P-value |
|---|---|---|---|---|---|
| Cell Counts | |||||
| Sertoli cells / ST | 21.1 | 1.9 | 21.9 | 2.1 | 0.78 |
| Germ cells / ST | 170.5 | 8.3 | 158.9 | 8.8 | 0.35 |
| Ratio (germ cells / Sertoli cells) | 9.3 | 0.7 | 8.1 | 0.7 | 0.21 |
Treatments were POS = bulls managed on a positive plane of nutrition over 112d; NEG = bulls managed on a negative plane of nutrition over 112 d. SE = standard error; ST = seminiferous tubule
In the presence of elevated nutrient levels, mTOR abundance and activity is increased to aid in regulation of these key metabolic pathways (Saxton & Sabatini, 2017). Interestingly, although POS bulls had increased concentrations of key mTOR signals (amino acids and IGF-1) in the blood, the abundance of p-mTOR within the seminiferous tubules and interstitial space was reduced when compared to NEG bulls (Table 1; Fig. 1A – B). While this reduction is contrary to the anticipated elevated abundance, previous research has demonstrated decreases of mTOR abundance in the Sertoli cells of rats fed a high-fat diet (Cui et al., 2017). In this experiment, POS bulls may be experiencing similar dysregulation of mTOR activity as a result of alterations in circulating metabolites in the blood and subsequent weight gain. This may be contributing to dysregulation of these nutrient sensing pathways which could alter metabolism in the testes.
A lower germ cell to Sertoli cell ratio may be indicative of decreased metabolic capacity of Sertoli cells to provide support to the germ cells. However, in this experiment, no differences were observed between POS and NEG bulls for number of germ cells and SC, as well as the ratio (Table 2). Guan et al. (2016) reported similar findings in sheep models, demonstrating no effects of over- or undernutrition on the number of Sertoli cells in mature rams. While no treatment differences were observed, nutrient availability has been demonstrated to impact sperm quality and cause DNA damage (Guan & Martin, 2017).
No differences were observed in AR abundance in the seminiferous tubules and interstitial space between treatments (Table 1). However, AR localization in the nuclei has been demonstrated to be specific to certain spermatogenic stages, indicating a role in germ cell development (Bremner et al., 1994). Further characterization of the stages of the tubules in models of divergent nutrition may provide insight on the interaction of nutrient levels and hormonal signals and subsequent effects on spermatogenesis.
In summary, abundance of the activated form of nutrient sensing regulator, phosphorylated mTOR, was increased in the testicular tissue of bulls on a negative plane of nutrition. This may be the result of the altered nutrient availability to the SC, in response to excess or reduction of circulating metabolites, such as amino acids. Future research will evaluate the expression of glucose and amino acid transporters in the seminiferous tubules to further elucidate the contributions of nutrition on SC function and sperm production. While there were no differences in the abundance of AR or germ cell to SC ratio, metabolic differences within the SC may have lasting effects on sperm quality, sire fertility, and epigenetic messages carried to offspring.