11.1 Soil Erosion
The three types of erosion common to North Dakota soils are tillage, water and wind erosion. Some fields may only be exposed to only one of these soil loss mechanisms, while others may experience all three during the same given year. A large portion of the summer rainfall comes from thunderstorms, which may result in many inches of deposition in a very short time. This can result in gullys forming in even relatively flat landscapes Wind erosion is persistent and ever present concern across North Dakota and most of the Great Plains.
11.2 Tillage Erosion
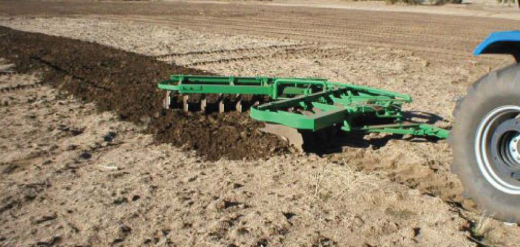
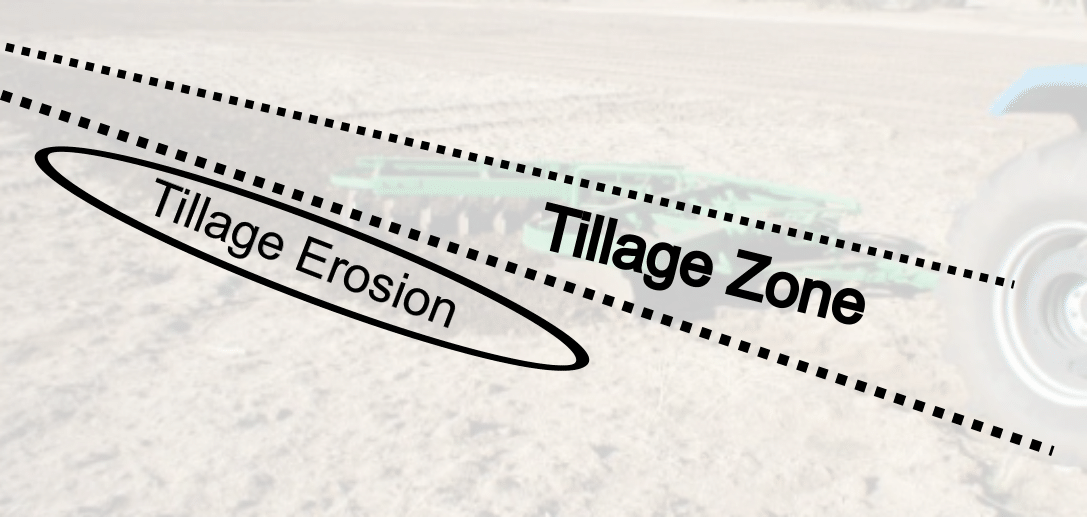
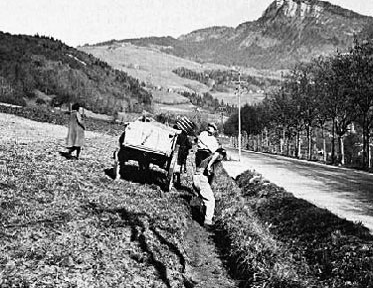
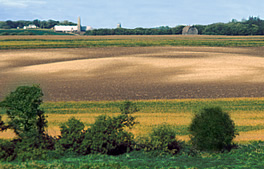
When soil is tilled, some of the tilled soil is moved outside the width of the tillage equipment (Figure 11.1). When tilling a slope, the downward side, relative to the path of tillage, receives more tilled soil than the upward side as a result (Figure 11.2). After years of tillage, the topsoil originally at the apex of the landscape has slowly over time moved off onto the slopes beneath. On a hill landscape, the footslopes are the areas where the most soil accumulation occurs, in the absence of additional water or wind erosion (Figure 11.3). Lowdermilk documented this kind of erosion in his publication Conquest of the Land Through 7000 Years (1953).
11.3 Water Erosion
In a semiarid state, one would not expect that water erosion would be as much a concern compared to states with much more precipitation. However, water erosion can be a problem when the precipitation occurs in sporadic bursts rather than drizzles over a longer period of time. In the late fall, much of North Dakota receives a snowfall that will persist and not melt until spring. In other parts of the U.S., snow falls, melts, more falls, melts and so on. Contrastingly in North Dakota most winters, the ground will freeze and as snow falls it stays frozen on top of the ground, the total water content increasing with each snowfall within the snowpack until it at last melts in the spring. The snowmelt commonly occurs in a short period of time, often over only a couple weeks; this results in a sudden movement of mass amounts of water over a frozen subsoil. The snowmelt produces saturated sediments, originating from topsoil, and the muddy water moves rapidly over the landscape and into streams, rivers, ponds and lakes (Figures 11.3, 11.4, and 11.5).
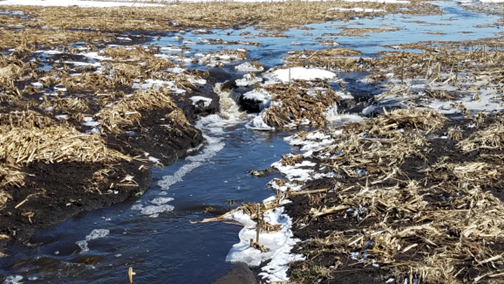
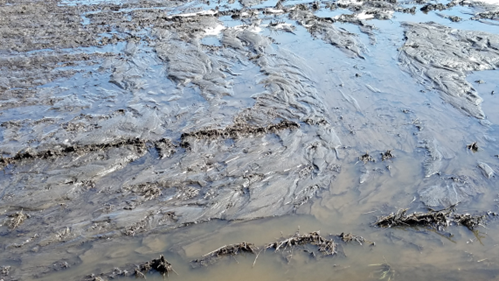
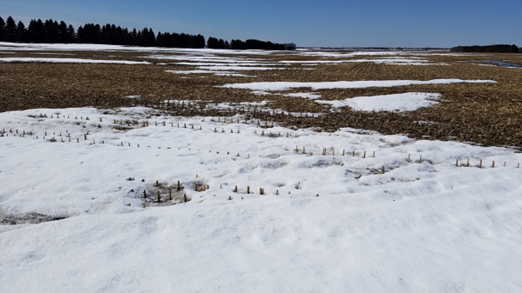
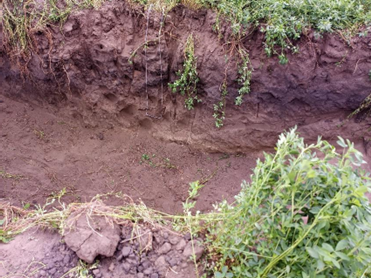
In addition to the snow melt over a short time, most rainfall in North Dakota comes from thunderstorms in the summer months. Thunderstorms are capable of producing large quantities of rainfall totals, from 1 inch to over 5 inches, within a several-hour period. The raindrops detach soil particles from each other, particularly in bare soils, and the additional rainfall moves the surface water with its sediments by the force of gravity to somewhere else, following the path of least resistance. In a severe thunderstorm, gullies can form with a depth of up to 5 feet being observed by farmers. Although the effects of this gully formation can be remediated by moving neighboring soil over in order to repair the devastation and then smoothing it out with additional tillage, the original soil that once was in the gully space is now lost, and the soils surrounding the gully are reduced now due to the tillage passes and their removal to fill the gully in.
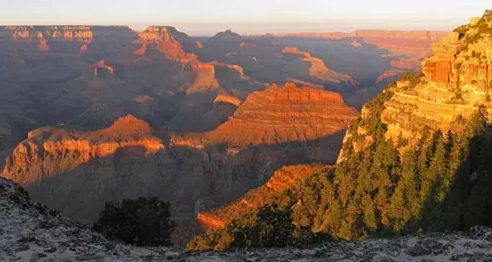
An extreme example of water erosion is the Grand Canyon in Arizona (Figure 11.8). Millions of years of water running through the region combined with uplift of rock and sediments result in the spectacular landscapes seen in the national park today. The Badlands in western North Dakota and South Dakota are also extreme consequences of this same type of water erosion.
11.4 Wind Erosion: The Great Tragedy in North Dakota
Before they were first plowed in the late 1800s, the prairie soils of North Dakota were the product of over 10,000 years of a grazed prairie ecosystem. The soil was continuously covered with grasses and forbs, grazed periodically with huge herds of bison, supplemented by antelope, elk and deer.The animals then cycled the nutrients back into the soil and churned the nutrient rich soil with their traffic. Periodic fires, both natural and human-induced, burned the surface residue but kept the roots intact. The native peoples who lived in the area did not till the soil but farmed next to the Missouri River with agriculture that was similar to that of the ancient Egyptians, except without supplemental irrigation. Even the dead were buried above the ground. Although there are no records found to date that describe the original state of the untilled soil that settlers first plowed, the initial USDA soil surveys from the early 1900s are hints to their richness (Table 11.1).
Table 11.1 USDA soil surveys of early 1900s with current comparisons
| Early Soil Survey | Current Comparisons |
|---|---|
| 1900 soil survey for Divide County. |
|
| 1903 Soil Survey of Fargo Area, Field Operations of the USDA Bureau of Soils, M. Whitney. A 1903 description of Wheatland, Miami and Fargo soil gives further insight, (with present topsoil thickness and organic matter content injected for reference). |
|
| 1906 Soil survey of Williston area, Field operations of the USDA Bureau of Soils, M. Whitney. |
|
11.5 The Link Between Soil Conservation and Soil Fertility
Most plant-available crop mineral nutrients are present in the surface soil layer, called the A horizon in prairie-derived soils. When this topsoil is lost, whatever mineral nutrients are present in the removed soil are lost also. The readily available nutrients in the remaining soil are diminished. Some of the nutrients may be replaced through weathering of some deeper soil minerals, but their replacement takes time, consequently to replenish lost nutrients greater quantities of supplemental nutrients through some kind of fertilizer application is required.
11.6 The History of Phosphate Export from North Dakota
North Dakota throughout its history has been an exporter of phosphate since the time of tillage by settlers, beginning about 1880. Settlers from the eastern U.S. and Europe, particularly Scandinavia, began arriving in North Dakota in about 1880. The complete plowing of the tillage prairie within the state was complete by the end of 1918. High grain prices during World War I encouraged plowing of any land capable of being plowed. Although there are no phosphate rock mines in North Dakota; the export or loss of soil phosphate and other crop nutrients occurred through two separate processes, the buffalo bone industry and soil erosion.
11.6.1 Buffalo Bone Industry Export of Phosphate
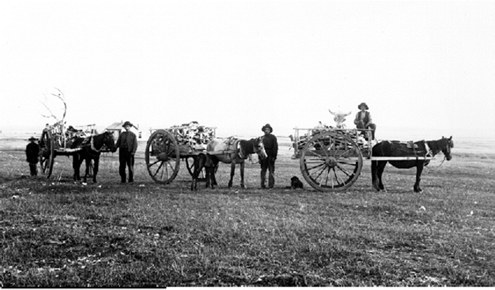
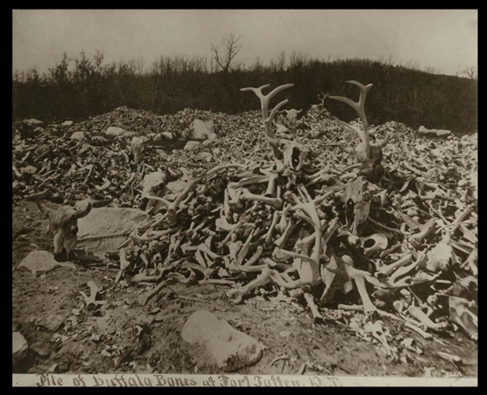
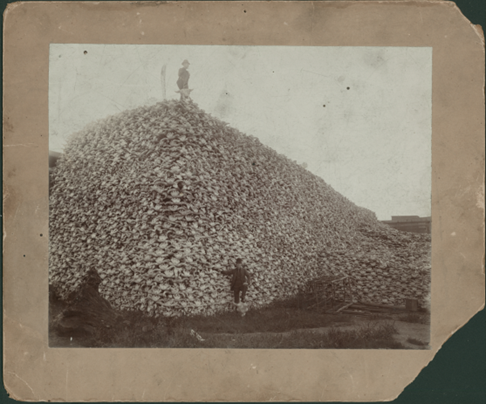
Much of the land in North Dakota at the time of external settlement contained bones from millions of bison and other grazing animals that died naturally or during the subsequent great slaughter that also forced natives into reservations due to hunger. Removing bones slowed the plowing process, but the bones were a source of continual income for the settlers for almost two decades, with local businesses paying cash for bones and then reselling them to industries in the eastern U.S. (McCreight, 1939). An estimated 3.2 million tons of bones were gathered from North Dakota. The revenue that settlers made from gathering and delivering the bones was a huge supplement to their income and enabled many to improve their homes and pay for inputs for their farming operations (Figures 11.10, 11.11, and 11.12).
11.6.2 Phosphate Export through Catastrophic Soil Loss Due to Wind Erosion
The land in North Dakota was treeless except right alongside rivers and streams. Common wildfires, both natural and set by the native peoples, prevented trees from invading the prairie. Settlers commented in letters on how windy it was nearly every day. Writings on agriculture in the area commented on black soil filling road ditches without any sense of alarm. Due to the light weight of seeders, the land had to be worked up very finely, similar to a powder or flour in texture, to enable the crude seed drills to place seed at the depth needed for germination (Figure 11.13). Spring wheat yields during the 1880s through the mid-1920s ranged from 20 bushels to almost 70 bushels per acre – in many areas, which is similar to the yields achieved today. Along the Sheyenne River near Fargo, 40 bushels per acre was cited (Drache), 30 bushels per acre near Jamestown and almost 50 bushels per acre in Walsh County. These yields were achieved without fertilizer and using crude planting instruments and no weed control. These yields would have required over 100 pounds per acre of nitrogen and significant quantities of phosphorus, potassium and other nutrients for their production. The State of North Dakota official motto became and still is Strength from the Soil (Figure 11.14). The topsoil was so deep and black, people thought it would be that way forever.
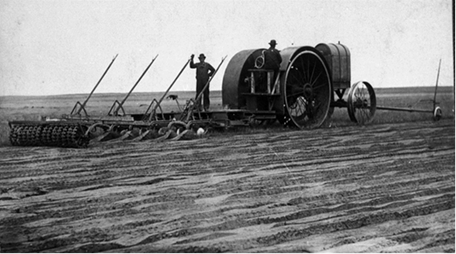

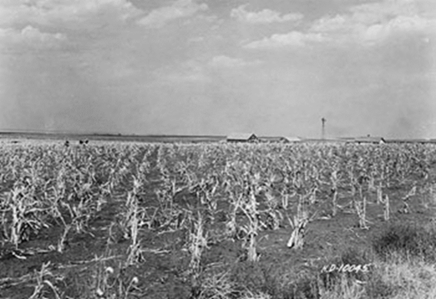
Throughout the late 1920s and into much of the 1930s, the weather was very dry. Dust storms were frequent. In some storms, according to narratives, the amount of soil lost in individual fields could be measured in feet.
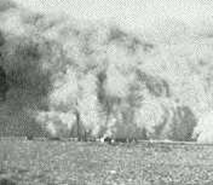
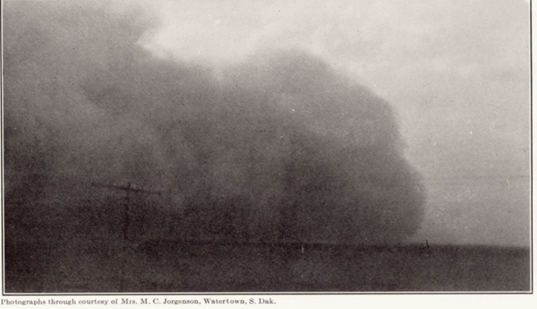
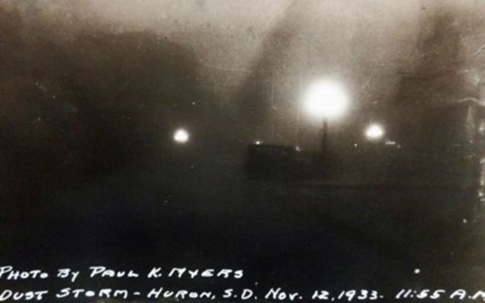
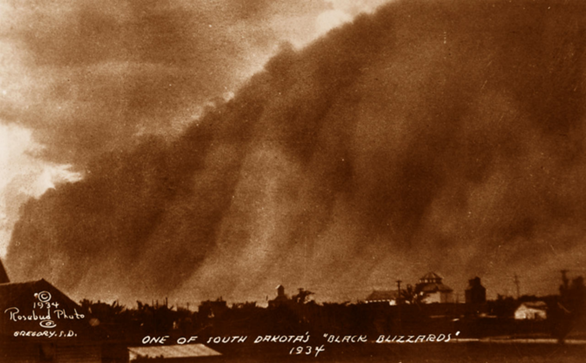
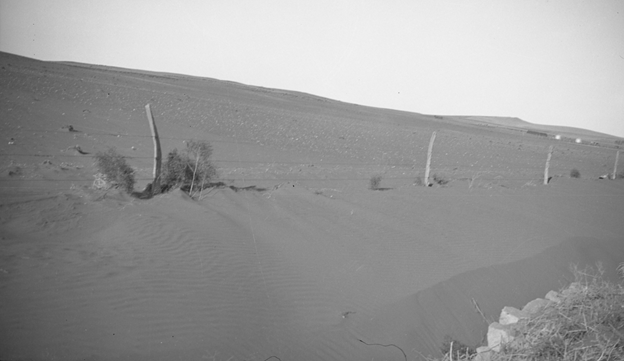
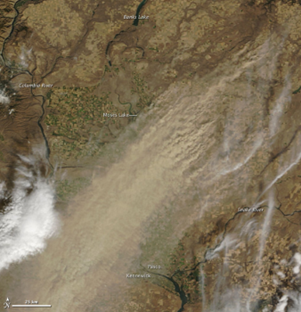
Dust storms are three dimensional, with an enormous height and a wide areal coverage. A Bismarck Tribune article chronicling a two-day storm in April 1934 stated that dust was encountered by airplane pilots as high as 14,000 feet up into the atmosphere. The dust was carried thousands of miles, with major cities like Chicago and New York needing to use city workers with plows to remove layers of dust from streets. The dust carried with it all of the valuable nutrients and organic matter that had made the soil so rich in the first place. Scientists took samples of the dust from New York and compared it to what soil remained in the Great Plains, where it originated from, and found that it contained 19 times more phosphate, 10 times more organic matter, 9 times more nitrogen, and 45 times more potassium than the sediments that were left behind.
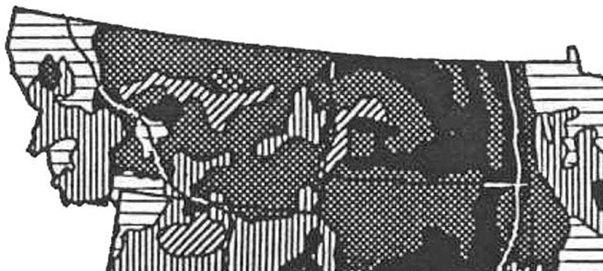

Overall, farmers do not see the impact of the soil lost to tilling due to the mixing of the subsoil layers with the remaining topsoil. From the back window of the tractor, it still all looks black to them. However, year after year the soil gradually turns a lighter and lighter color, with less organic matter, greater susceptibility to soil crusting, shorter distance to high lime and salty layers, and with a greater overall requirement of additional fertilizer inputs for continued high yielding crop growth. Soil conservation is naturally linked to soil fertility. As topsoil leaves a farm, lost by erosion, the stored plant nutrients contained therein leaves also. Retention and conservation of the topsoil should be the long-term goal of any farming operation looking to minimize fertilizer inputs into the future.
11.7 References for Soil Erosion
Burton Historical Collection. (1892). Buffalo skulls piled near the Michigan Carbon Works, Rougeville, MI [Photograph]. Detroit Public Library.
Lowdermilk, W. C. (1953). Conquest of the land through 7,000 years. U.S. Department of Agriculture, Soil Conservation Service. https://www.nrcs.usda.gov/sites/default/files/2022-09/stelprdb1043789.pdf
McCreight, M. I. (1939). Buffalo bone days: A short history of the buffalo bone trade. Lawrence J. Barkwell.
Montana Historical Society. (n.d.). Métis Indians with 2-wheel Red River carts hauling buffalo and other bones to market [Photograph]. Montana Historical Society, Item #H-1707.
National Archives. (1934). Dust storm bearing down on Gregory, SD, south of Pierre [Photograph]. Franklin D. Roosevelt Presidential Library, Photo ID 997.
NASA Earth Observatory. (2009, October 6). Dust storm in eastern Washington [Satellite image]. NASA. https://earthobservatory.nasa.gov/images/40590/dust-storm-in-eastern-washington
North Dakota State Historical Society. (n.d.). Bones to be loaded onto a railcar near Devils Lake, ND [Photograph]. D Collection, Item 0174-00001.
North Dakota State Historical Society. (n.d.). Seeding preparation near McCleod, ND, early 1900s [Photograph]. State Historical Society of North Dakota Archives.
North Dakota State Historical Society. (n.d.). Pop-up exhibit: Gardening during hard times. State Historical Society of North Dakota. https://www.history.nd.gov/exhibits/gardening/pop_0351-06.html
North Dakota Studies. (n.d.). North Dakota coat of arms. North Dakota Studies. https://www.ndstudies.gov/gr4/citizenship/part-5-symbols/section-9-north-dakota-coat-arms
United States Department of Agriculture, Agricultural Research Service. (n.d.). Dust Bowl photographs. https://infosys.ars.usda.gov/WindErosion/multimedia/dustbowl/dustbowlpics.html
United States Department of Agriculture. (1936). General distribution of erosion [Map]. U.S. Government Printing Office.
Vieira, D. A. N., & Dabney, S. M. (2011). Modeling edge effects of tillage erosion. Soil and Tillage Research, 111(2), 197–207. https://doi.org/10.1016/j.still.2010.10.007