| Table 16.20 Suggested P₂O₅ rates for potato production in North Dakota | ||||||||
|---|---|---|---|---|---|---|---|---|
| P₂O₅ to apply (pounds per acre) | ||||||||
Olsen Soil Test P (ppm)
|
||||||||
| 0–3 | 4–7 | 8–11 | 12–15 | 16–18 | 19–22 | 23–41 | 42+ | |
| Irrigated | ||||||||
| Before July 25 (<90 DAP)* | 125 | 100 | 75 | 50 | 50 | 50 | 50 | 50 |
| July 25–Aug 26 (90–120 DAP)† | 150 | 125 | 100 | 75 | 75 | 75 | 75 | 75 |
| After Aug 26 (>120 DAP)‡ | 175 | 150 | 125 | 100 | 100 | 100 | 100 | 100 |
| Dryland | ||||||||
| Reds | 150 | 125 | 100 | 75 | 75 | 75 | 75 | 75 |
| Russets and Whites | 175 | 150 | 125 | 100 | 100 | 100 | 100 | 100 |
| Early fresh market varieties include Norland, Red Norland, Dark Red Norland, and Yukon Gold. | ||||||||
| † Midseason fresh market and processing varieties include Norkotah Russet, Gold Rush, Ranger Russet, Ivory Russet, Snowden, Atlantic, Dakota Pearl, and Ivory Crisp. | ||||||||
| ‡ Late-season irrigated varieties include Russet Burbank, Umatilla, and Alturas. | ||||||||
16.1 Phosphorus in plant nutrition
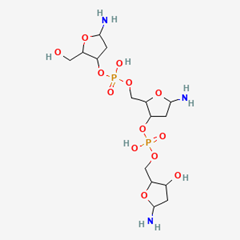
Phosphorus is an essential nutrient for all plants, including the forage, hay, oil seed, grain and root crops grown in North Dakota. Phosphorus’s importance to plants stems in part as its role as a key component of both DNA (deoxyribonucleic acid) —nuclear and mitochondrial— and all forms of RNA, including transfer RNA and messenger RNA (Figure 16.1).
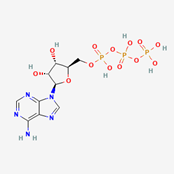
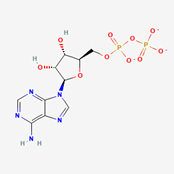
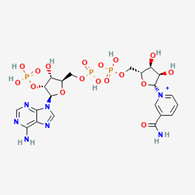
Phosphorous also plays a large role in energy production and transfer within the plant. The main energy currencies in photosynthesis’s are the phosphorus compounds ATP, ADP and NADP. The intercellular conversion of adenosine triphosphate (ATP) to adenosine diphosphate (ADP) generates a large relative quantity of chemical energy. Converting ADP back to ATP then “stores” that chemical potential energy, allowing the plant to use it as needed for future functions such as growth, defense, or reproduction. Nicotinamide-adenine-dinucleotide-phosphate (NADP) is the electron-transfer cofactor in the photosynthesis cascade that allows the light energy to be converted into chemical energy inside the plant cells (Figure 16.2).
Phosphorous is also a component of the major photosynthetic enzyme Rubisco (Ribulose-1,5-bisphoshate carboxylase/oxygenase), the most abundant enzyme on the planet. Rubisco allows plant cells to fix carbon dioxide (CO₂) as part of the first step in the conversion of light to chemical energy through the production of sugars/carbohydrates. Rubisco comprises about 30-50% of the total soluble proteins found inside C3 plants such as soybean or wheat. Rubisco is also associated with another phosphate-containing cofactor PEP (Phosphoenolpyruvate) found in C4 plants, such as corn, sorghum, and many weeds including Amaranth spp.
Phosphorus is also vital for the structure and function of cell membranes, which are essential to both the integrity and operations of the cell itself as well as the organelles found within. A membrane may seem to be a trivial item, but it is not. Its polar (charged) and non-polar (uncharged) components are what enables it to carry out both active and passive transport of water and nutrients in and out of the cell.
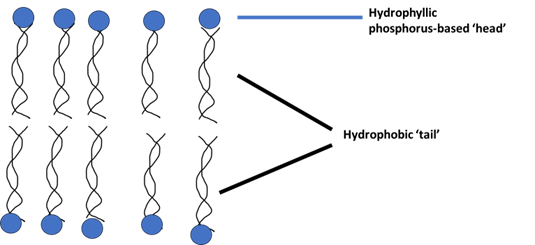
This movement of water and solutes helps maintain the shape and integrity of the cell, or cell organelles, depending on the osmotic pressure balance inside vs outside.
16.2 Phosphorus in the soil
16.2.1 Inorganic phosphate in soil
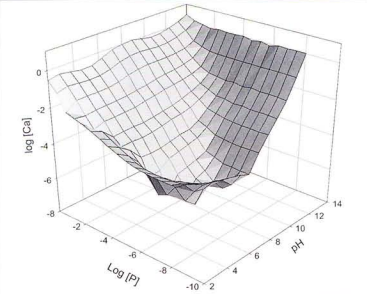
All phosphorus that is present in the soil can primarily be categorized into two main groups: inorganic and organic. The inorganic phosphorus is tied up in basic soil minerals, such as apatite. Apatite, found in igneous, metamorphic and sedimentary rocks, has a basic formula of Ca5(PO4)3OH. Apatite is found in almost all igneous rocks that are common to glacial till such as basalt and granite. Sedimentary apatite forms when phosphate ions encounter calcium ions. Shale, along with other rocks and sediments common to marine environments, typically has a very high apatite content. Much of the soil in North Dakota, as indicated in the initial chapters of this book, is composed of an underlying bedrock of shale, and layers of glacial till and other glacially deposited sediments which include igneous and metamorphic rocks originating from the Canadian Shield formations. The shale layer can vary in size from very thin to relatively thick. Phosphate in these sediments is slowly released, but the process is reversable. Under acidic soil conditions, any P dissolved in the soil solution can precipitate into inorganic P forms such as strengite (FePO4∙ 2H2O) and variscite (AlPO4∙ 2H2O). Dissolved P in the soil solution can also adsorb onto iron and aluminum oxides and transform into more insoluble minerals with time (Parfitt et al, 1975; Parfitt, 1979).
16.2.1.1 Table 16.1 Solubility of selected calcium phosphates
| Calcium Phosphate Compound | Chemical Formula | Solubility |
|---|---|---|
| Monocalcium phosphate monohydrate | Ca(H2PO4)2∙H2O | Highly soluble |
| Dicalcium phosphate | CaHPO4 | 10-6.9 moles/liter |
| α-Tricalcium phosphate | α-Ca3(PO4)2 | 10-25.5 moles/liter |
| Hydroxyapatite | Ca5(PO4)3OH | 10-58.4 moles/liter |
| Octacalcium phosphate | Ca8H2(PO4)6∙5H2O | 10-96.6 moles/liter |
Calcium phosphate is another major form of inorganic P found in the soil. As time passes, the calcium phosphate has a greater opportunity, and tendency, of transforming into a more insoluble form, such as the ones listed in Table 16.1. Even in soils with pH greater than 7, with free carbonates, there is still sufficient Fe to result in occluded P (phosphates surrounded by Fe minerals). In soil with a pH greater than 7 and free carbonates P can also adsorb to calcite (calcium carbonate) becoming completely coated or occluded by calcium carbonate.
16.2.2 Organic phosphates in soil
Plants, macroorganisms and microorganisms all contain phosphorus in their cellular components, and as these organisms die and begin to decompose, their P ultimately can be recycled and taken up by other organisms, become part of the stable organic matter fraction (humus) in the soil, or can precipitate out of the soil solution as inorganic-P. The decomposition of residue, release of P and its fate depends on residue chemical composition. During the decomposition process, between the release of the P from the plant residues and its potential uptake by other microorganisms, the “free P” may also be taken up by growing plants, including crops. This whole system is a complex biological process, and when taking into consideration all of our understanding regarding the nature and rate of release of the inorganic forms of P is the soil, which is still largely incomplete, our understanding of the rate of P released from its organic forms in the soil, and its availability, is still far less clear.
The soil tests used in North Dakota/Minnesota to determine the relative concentration of plant available P are the Olsen P extraction and the Bray P-1 extraction methods. Both of these regionally favored plant available P extraction methods do not correlate well to potential plant available P from organic P sources. Other soil tests, such as the Bray P-2 extraction method, are similarly poor when estimating the rate of organic P release.
A Minnesota study looking at soil P fractionation, uptake, and soil test methodology (Olsen/Bray), across six different soils with respect to geography, soil texture and organic matter showed that overall the total P in the top 6 inches of soil ranged anywhere from about 1,200 pounds P per acre in low organic matter sands to over 2,000 pounds P per acre in medium to high organic matter loams to clay loam soils (Sims et al., 2023). Across all sites, more than half of the total measured P was in the organic form. In high carbonate soils with low soil test Olsen P values, which are common to both North Dakota and northwest Minnesota, farmer crop yields are often much higher than one would expect even with very low available P. It is then very possible that in these fields the high organic matter may be contributing a significant amount of P to the total amount of P taken up by the crop. However, the present-day soil test P extraction methods do a poor job of predicting the contribution of organic P to crop nutrition.
16.3 Determining crop available soil phosphorus
### Development and use of the Olsen P test
Across North Dakota, the standard method used for measuring plant available P in the soil is the ‘Olsen P’ method. The Olsen P analysis method was first developed by a USDA group led by S.R. Olsen; their work and findings, along with the exact procedures of the method were first published in 1954 (Olsen et al., 1954). Prior to this, it was common among other soil extraction methods developed during the 1950’s to choose an extractant that would both mimic plant uptake, and resist precipitation of the compound (phosphate) into the extracted solution. The theoretical basis of the Olsen P test/bicarbonate extractant, is based on the notion that the solubility of calcium phosphate is a function of both the pH and Ca ion activity. Calcium phosphates have minimum solubility between pH 7 to 7.5, with their solubility increasing above and below this pH range. A sodium bicarbonate (NaHCO3) solution at a pH of 8.5 represses the calcium ion activity. During the development of this method, detailed in Olsen et al., 1954, multiple greenhouse crop response studies and 66 field studies were carried out across the US in order to evaluate the overall utility of the procedure long before it was ever released to the public. The Olsen test has been universally recommended for use in North Dakota since about 1998. The Olsen P test procedure is detailed by Frank et al., revised 2015.
The Olsen P extracting solution is 0.5M NaHCO3 adjusted to pH 8.5
The solution is made using the following steps:
- Dissolve 420 g commercial-grade sodium bicarbonate in distilled water.
- Add distilled water to a total volume of 10 L.
- Use a magnetic stirrer or electric mixer to dissolve the NaHCO3.
- Adjust the solution to pH 8.5 using 50% sodium hydroxide (NaOH).
The procedure detailed by Frank et al. includes not only the method steps themselves, but the equipment required to properly carry out the method, as well as the procedures for making both the indicator solution for the colorimetric determination and the standard solutions used to produce the standard curve. Other available P soil tests used in the North Central Region that are not recommended for North Dakota, include the Bray P1, Bray P2, and the Mehlich-3 soil tests.
16.3.1 Development and use of the Bray P-1 soil test
The Bray P1 soil test was developed at the University of Illinois by soil scientists T. Kurtz and Bray in the 1950’s. Nearly all soils in Illinois are naturally acidic; therefore, the initial development of the Bray P1test was done using very few, if any, soils with a pH greater than 7. Although the Olsen P test extracts less P on acidic soils compared to the Bray test, the response curves for both extractants are still very similar. The Bray test is extremely poor in extracting P from soils with pH greater than 7, and that have free carbonates present. Since the great majority of fields in North Dakota have a combination of acidic, and high pH soils (pH greater than 7) with free carbonates, the Bray test is therefore not recommended for use in North Dakota.
16.3.2 Development and use of the Bray P2 soil test
In the acidic soils of Illinois during the 1950’s, tons of finely ground rock phosphate were being applied to supply P to the corn, and other crops, growing throughout the state. The Bray P1 test initially did a poor job of predicting both the presence and release of this P in the soil. The Bray P2 extractant, in comparison, used a stronger acid than the P1 extracting solution and was therefore better able to account for the total P originating from the applied rock phosphate being taken up by the crops. In North Dakota, rock phosphate was never used on a comparable scale because of its low solubility in alkaline pH soils — common across most of North Dakota — prevented it from dissolving.
16.3.3 The limitations of the Mehlich-3 soil test in North Dakota
:warning: Warning: Melich-3 is not recommended for use in North Dakota
The Mehlich-3 solution extractant is the preferred extractant for many of the states to the east and south of North Dakota due to its good correlation in acidic soils to crop available P. The Mehlich-3 solution can also be used to extract multiple other nutrients simultaneously including K, Ca, Mg and even some micronutrients. However, it performs very poorly in alkaline soils, and as such, is not recommended for use in North Dakota; nor is there any calibration data available in-state relating Mehlich-3 values to crop relative yield.
16.4 Fertilizer phosphate application strategy and philosophy
There are two major philosophies regarding P application to crops: the buildup & maintenance approach, and the sufficiency approach.
16.4.1 Buildup and maintenance approach for phosphate and potash
The goal of the buildup and maintenance approach in determining the rate of P application —or for any other nutrient application rate, particularly K — is building up the soil test values to at least critical values. After that soil test level is reached, fertilizer is applied at crop removal rates, ensuring the end of season soil test value will never be lower than the critical value threshold. In essence first build it up to the desired level and then maintain it there. The critical soil test value is the soil test value above which adding any more of a particular nutrient is unlikely to produce an economic benefit, whether through increased crop yield or improved crop quality. The buildup and maintenance approach is used primarily in regions where both crop yields are high, and crop failures are rare. The approach is therefore considered to be a more aggressive fertilization approach in regions where spending more than potentially necessary on inputs in a given year is still economically more profitable than not achieving high yields; the states of Illinois, Iowa and Indiana, all fall into this regional category. When I (Franzen) was an agronomist for a fertilizer chain from the mid-1970’s to early 1990’s I had the opportunity to work with many farmers who had been farming ever since the mid-1930’s. During my first crop failure, which was the major drought of 1988, one farmer told me that it had been his first crop failure since WWII. However, now that I work in North Dakota, it is a fact that yearly somewhere in the state there are at least some crop failures. North Dakota is not a place where, economically speaking, an aggressive approach to fertilization would serve farmers well, due to the high risk of crop failure.
16.4.2 The sufficiency approach to phosphate application
In contrast, the sufficiency approach to fertilization is based upon the idea of only applying the rate of fertilizer that is needed for the upcoming crop, while still ensuring an economic return for that year. It is a conservative approach that limits the cost of inputs each year, since there is not a good way to predict whether or not the weather for the upcoming growing season could support a high yielding crop or not. The rate of P and K indicated by the fertilizer recommendations is directly related to the soil test value; the lower the value, the greater the recommended rate. Although the highest rate in a given recommendation table may be greater than crop removal rates, its ability to build the soil test value may be nominal.
16.5 The role of mycorrhiza in crop phosphate nutrition
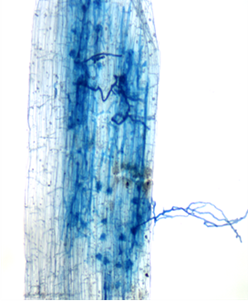
Mycorrhizae are soil fungi that live in a symbiotic relationship with the majority of plants; with the exception being plants found in the mustard (Cruciferae) and pigweed (Amaranthaceae) families. Mycorrhizae hyphae are small rootlike structures that colonize in and around the roots, and root cells of the plant, exploring the soil within a couple of feet of the host plant. They are very good at mobilizing both P and Zn from the soil and transferring it into the host plant. Hence, the relationship is as follows: mycorrhizae receive carbohydrates from the plants whose roots have colonized, and in return, the plant receives mineral nutrients from the mycorrhizae, particularly phosphate and zinc (Zn). (Figure 16.5).
16.6 16.6 Environmental consequences of phosphorus entering surface waters
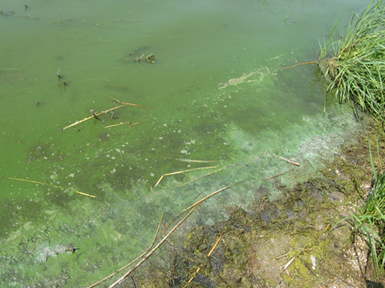
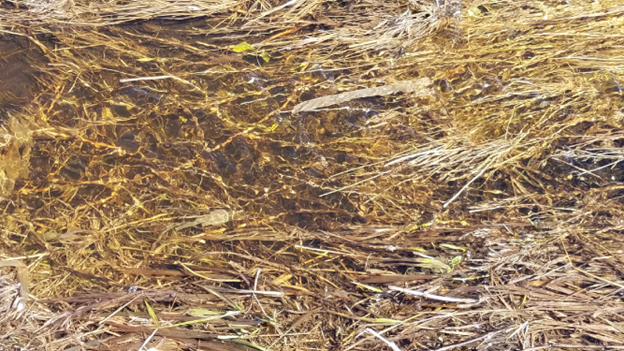
Phosphorus and N are not just growth-limiting nutrients to terrestrial plants (including crops), but also to aquatic plants. In surface water, the green color that many bodies acquire during the spring through fall is caused by algae (Figure 16.6). The algae’s growth rate can be greatly increased by even a small amount of N and P present in the water. In addition to algae, the growth of other aquatic plants anchored to the bottom of the water body can also be enhanced by N and P, regardless of whether these nutrients are added to the water, or that originate from the sediments lining the bottom. The increased growth of the algae and aquatic plants is not in itself an environmental issue, although the quality of the affected water for swimming, drinking, and boating is certainly impeded. It is the type of algae in the water that can be a serious environmental issue, especially algae that produce cyanide or other toxic chemicals. Another major environmental issue starts after both the algae and the aquatic flora die. During their decomposition, oxygen is depleted from the system resulting in a condition called ‘hypoxia’, or no oxygen. Hypoxia can result in the death of all the fish in the lake, none as a fish kill or a ‘dead’ lake. An example of this on a much larger scale is the Mississippi River/ Gulf of Mexico junction producing a ‘dead zone’ or ‘hypoxia region’ that currently extends many miles out to sea, and has decimated the fishing habitats in the Gulf of Mexico; caused by the accumulated amounts of N and P. Another example lies to the north in Lake Winnipeg, where summer algae blooms are also an issue that have resulted in hypoxia in various areas of the lake. Various entry points for phosphate into the water ways exist and include: dust that is blown in, poor surface phosphate fertilizer and manure management (especially P and/or manure applications close to water bodies), stream-bed erosion, and any and all other types and sources of water erosion. Another major entry point of P into waterways and surface waters in the region is the spring decomposition of all the plant tissue as the snow melts (Figure 16.7). During snowmelt, organic P is released from plant cells when cell membranes burst during the winter freeze. This P moves with the water, largely from riparian areas (vegetated regions along waterways), into the other various major water bodies of the region.
16.7 Phosphorus fertilizer placement
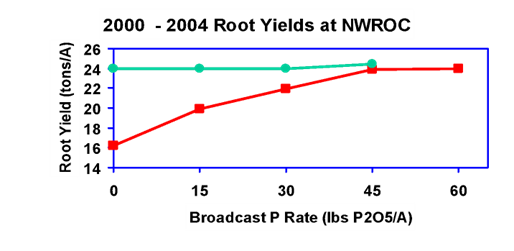
Any P applied with or near the seed almost always results in a positive yield response in small grains (wheat, barley and oats), corn, sugarbeet, potato and canola. Sugarbeet and canola are non-mycorrhizal; therefore, concentrating P with/near the seed drastically improves P uptake. Small grains, corn and canola are also all seeded early, and thus concentrating P with, or near the seed, can greatly improve the total P taken up by the plant, especially in cold soil environments that limit overall root growth.
16.7.1 Phosphorus fertilizer placement in corn and potato
Starter P fertilizer in corn almost always results in a grain yield increase as demonstrated by research conducted at the Carrington Research & Extension Center. In 2007 the starter P fertilizer application resulted in the greatest corn grain yield, a 49 bushel per acre increase using an application rate of 6 gallon per acre 10-34-0. Although potato can tolerate much higher rates of seed-placed fertilizer, the P is typically still banded away from the seed pieces to avoid any potential ammonia/salt damage. The most common fertilizer band location is 2 to 3 inches below and 2 to 3 inches to the side of the seed piece.
16.7.1.1 Table 16.2 Corn grain yield with seed-placed 10-34-0. Data from Hendrickson, 2007, Carrington Research and Extension Center, Carrington, ND (unpublished).
| 10-34-0 rate, gallons per acre | Corn yield, bushels per acre |
|---|---|
| 0 | 101 |
| 2 | 121 |
| 4 | 125 |
| 6 | 150 |
| 8 | 156 |
| 10 | 153 |
16.7.2 Phosphorus fertilizer placement for small grains
In oats, barley, and all types of wheat (spring, durum, and winter wheat) some amount of banded P should always be placed with the seed or within a couple of inches; however, there are rate limits that should be observed in order to avoid stand damage. A summary of the extensive research at NDSU on fertilizer rates, methods of application, and seed safety, is summarized in Tables 16.3 and 16.4, and takes into consideration factors such as: row spacing, soil texture, moisture at planting time, and products. The rate of fertilizer that can be applied safely with the wheat seed is more dependent on the N content than the P content of the fertilizer. Maximum N fertilizer rates that can be used with the seed are provided below in Tables 16.3 and 16.4.
16.7.2.1 Table 16.3 Maximum N fertilizer rates with wheat seed at planting based on row spacing, planter opener type and seedbed utilization (Deibert & Franzen, 2023). SU = seedbed utilization.
| Opener Type | Seed Spread | 6 in SU (%) | 6 in N (lb/ac) | 7.5 in SU (%) | 7.5 in N (lb/ac) | 10 in SU (%) | 10 in N (lb/ac) | 12 in SU (%) | 12 in N (lb/ac) |
|---|---|---|---|---|---|---|---|---|---|
| Double-disc | 1 | 17 | 20–30 | 13 | 19–28 | 10 | 17–23 | 8 | 15–20 |
| Hoe | 2 | 33 | 32–44 | 27 | 27–38 | 20 | 23–31 | 17 | 20–27 |
| 3 | 50 | 44–58 | 40 | 37–48 | 30 | 30–40 | 25 | 26–34 | |
| Air-Seeder | 4 | 66 | 56–72 | 53 | 46–58 | 40 | 37–48 | 33 | 32–42 |
| 5 | 83 | 68–86 | 68 | 56–68 | 50 | 44–57 | 44 | 38–49 | |
| 6 | 100 | 80–100 | 80 | 66–79 | 60 | 51–55 | 50 | 44–56 | |
| 7 | 94 | 76–90 | 70 | 58–74 | 58 | 50–64 | |||
| 8 | 80 | 66–83 | 67 | 56–71 | |||||
| 9 | 90 | 73–92 | 75 | 62–78 |
16.7.2.2 Table 16.4 Maximum N + K₂O fertilizer rates with wheat at planting based on soil texture and seedbed utilization (Deibert & Franzen, 2023).
| Soil Texture | Sand % | Silt % | Clay % | 10–20% SU (Double-disc, 1 in) lb N + K₂O/ac | 30–50% SU (Hoe, 2–3 in) lb N + K₂O/ac | 60–100% SU (Air seeder, 4–12 in) lb N + K₂O/ac |
|---|---|---|---|---|---|---|
| Loamy sand | 80 | 10 | 10 | 5 | 10–20 | 25–40 |
| Sandy loam | 60 | 35 | 15 | 10 | 15–25 | 30–45 |
| Sandy clay loam | 55 | 15 | 30 | 15 | 20–30 | 35–50 |
| Loam | 40 | 40 | 20 | 20 | 25–35 | 40–55 |
| Silt loam | 20 | 65 | 15 | 25 | 30–40 | 45–60 |
| Silty clay loam | 10 | 55 | 35 | 30 | 35–45 | 50–70 |
| Clay loam | 30 | 30 | 40 | 35 | 40–50 | 55–80 |
| Clay | 20 | 20 | 60 | 40 | 45–55 | 60–100 |
When a range is provided in Table 16.4 and Table 16.5, instead of an individual rate, the lower rate should be considered if the seedbed is dry, while the higher rate may be considered under moist seedbed conditions.
16.7.3 Phosphorus fertilizer placement for canola
Canola recommendations for the Canadian Prairie Provinces take into account the research done by Canadian soil scientists that has shown that a banded P application is more efficiently used by canola than either a broadcast P, or a deeply banded P (P banded deeper than 2 inches in depth). There is always the potential for stand reduction from seed-placed fertilizer in any crop; however, canola is particularly sensitive to seed-placed rates. Often though because of the extensive branching habit of canola, as long as the seed-placed rates applied are modest yield is often not affected.
16.7.3.1 Table 16.5 Effect of seed-placed fertilizer on canola stand and yield (from Grenkow et al., 2013).
| P₂O₅ rate (lb/ac) applied | Stand reduction from initial 150 seed per square m | Bushels per acre yield increase over check |
|---|---|---|
| 18 | -3 plants per square m | 7.4 |
| 36 | -7 plants per square m | 7.7 |
Nitrogen and K rates are limited with seed-placed fertilizer on canola due to the potential for germination hazard and subsequent stand loss caused by ammonium and salt. The anion component of the fertilizer is not factored in when determining seed safe rate limits, only the cation component. Ammonium sulfate and ammonium thiosulfate should never be placed with the seed. The high S demand of canola (along with its constant need for P) can never be fully supplied with seed-placed fertilizer since the demand is greater than the limits that can be safely applied with the seed. When analyzing various S products, preference should be given to any products that can be side-banded or broadcast. Also keep in mind, any elemental S fertilizers are largely ineffective as a S source.
16.7.3.2 Table 16.6 Maximum rates of seed-placed N + K₂O for canola and mustard
| Soil texture | Disc/Knife 6 in | Disc/Knife 9 in | Disc/Knife 12 in | Spoon/Hoe 6 in | Spoon/Hoe 9 in | Spoon/Hoe 12 in | Sweep 6 in | Sweep 9 in | Sweep 12 in |
|---|---|---|---|---|---|---|---|---|---|
| Light | 5 | 0 | 0 | 20 | 15 | 10 | 30 | 20 | 15 |
| Medium | 10 | 5 | 5 | 25 | 20 | 15 | 35 | 25 | 20 |
| Heavy | 15 | 10 | 5 | 35 | 25 | 20 | 45 | 30 | 25 |
16.8 Supplement phosphorus for major North Dakota crops
16.8.1 Phosphorus for Alfalfa and Clovers
In North Dakota alfalfa is considered a multi-year crop, with the establishment year yielding about half the total amount of biomass as all the subsequent years combined will produce. Any P fertilizer supplementation is generally done during establishment, and any additional P fertilizer applications being applied annually following the 1st cutting.
16.8.1.1 Table 6.7 North Dakota phosphorus recommendation for alfalfa establishment broadcast application rates of P₂O₅ (Olsen P, ppm)
| Olsen P category | VL | L | M | H | VH |
|---|---|---|---|---|---|
| Olsen P (ppm) | 0–3 | 4–7 | 8–11 | 12–15 | ≥16 |
| P₂O₅ rate (lb/ac) | 120 | 100 | 80 | 60 | 40 |
Following establishment and after the 1st cutting, an annual application of broadcast P will help to keep the stand healthy. Alfalfa dry matter contains about 0.3% P, or about 6 pounds P per ton (~14 pounds P₂O₅ per ton). An annual application of about 80 pounds per acre of 11-52-0 is typically sufficient to maintain soil test P values in North Dakota, regardless of the yield of the hay removed. For clovers, if the soil test P at the time of establishment is less than 10 ppm Olsen, 60 pounds per acre of P2O5 at seeding, about 115 pounds per acre of 11-52-0, should be applied. Thereafter, 10 pounds of P2O5 should be applied per ton of hay removed.
16.8.2 Phosphorus for Barley
For barley, a seed-placed, or a near-seed-placed concentrated band of starter P fertilizer is recommended. Barley is often seeded in cold soils to take advantage of the cooler temperatures in the early part of the growing season that are necessary for maximizing yield. As a result, root growth is usually impaired by the colder soil temperatures from the seeding stage through early growth. A concentrated P fertilizer application, regardless of soil test P, in most years will result in higher rates of both early growth and yield.
16.8.2.1 Table 16.8 Total P recommended for barley in North Dakota
| Olsen P category | VL | L | M | H | VH |
|---|---|---|---|---|---|
| Olsen P (ppm) | 0–3 | 4–7 | 8–11 | 12–15 | ≥16 |
| P₂O₅ rate (lb/ac) | 78 | 60 | 52 | 26 | 0 |
Note: Banded P has approximately twice the efficiency of broadcast
16.8.3 Buckwheat phosphorus considerations
Buckwheat is a very efficient extractor of soil P, particularly from the calcium phosphate minerals that are present in all but the most acid soils across the state. Research from North Dakota State University showed that (Teboh and Franzen, 2011) both a reduction in the level of calcium phosphate P, and an increase in the overall level of free phosphates (ortho-phosphates) in the soil after buckwheat production. Buckwheat yield can be increased by an application of P if the soil P is lower than 12 ppm. Up to 20 pounds per acre of P2O5 as 11-52-0 or equivalent fertilizer can be applied with the seed. Any rates greater than 20 pounds per acre P2O5 should be broadcast at or before seeding.
16.8.3.1 Table 16.9 Buckwheat phosphorus recommendations (Olsen soil test P, ppm)
| Olsen P category | VL | L | M | H | VH |
|---|---|---|---|---|---|
| Olsen P (ppm) | 0–3 | 4–7 | 8–11 | 12–15 | ≥16 |
| P₂O₅ rate (lb/ac) | 40 | 30 | 20 | 10 | 0 |
16.8.4 Phosphorus for Canola
Because canola does not support mycorrhizae fungi and is seeded most years canola into colder soils, applying a starter P application either with, or near the seed, becomes especially important.
16.8.4.1 Table 16.10 Canola phosphorus recommended at different Olsen P soil test values
| Olsen P category | VL | L | M | H | VH |
|---|---|---|---|---|---|
| Olsen P (ppm) | 0–3 | 4–7 | 8–11 | 12–15 | ≥16 |
| P₂O₅ rate (lb/ac) | 60 | 44 | 28 | 12 | 0 |
Note: Banded P is twice as efficient as broadcast P. If P is banded, any additional P desired may be reduced in rate and yield will be maintained.
16.8.5 Phosphorus for Corn
Corn has become a very high yielding crop in North Dakota, mostly due to both the advances in genetics and the improvements in grower planting techniques. P is very important to producing high yields of corn grain. A portion of the recommended P should either be applied directly to the seed or near the seed; ideally 2 inches to the side and 2 inches below the seed, a position often referred to as a ‘2 by 2’ application. With or near-seed placed P is almost twice as efficient as broadcast P. As a result, if any additional P is applied in excess of the recommended banded rate, the total P provided to the corn crop may be reduced. The rate of fertilizer P varies depending on whether the crop is under irrigation or not, destined for silage or grain, and what region of the state it is being grown in.
16.8.5.1 Table 16.11 Phosphorus recommended for silage corn and sweet corn in North Dakota
| Olsen P category | VL | L | M | H | VH |
|---|---|---|---|---|---|
| Olsen P (ppm) | 0–3 | 4–7 | 8–11 | 12–15 | ≥16 |
| P₂O₅ rate (lb/ac) | 90 | 70 | 40 | 20 | 0 |
16.8.5.2 Table 16.12 Phosphorus recommended for non-irrigated grain corn west of the Missouri River
| Olsen P category | VL | L | M | H | VH |
|---|---|---|---|---|---|
| Olsen P (ppm) | 0–3 | 4–7 | 8–11 | 12–15 | ≥16 |
| P₂O₅ rate (lb/ac) | 78 | 52 | 39 | 26 | 10 |
16.8.5.3 Table 16.13 Phosphorus recommended for grain corn east of the Missouri River and irrigated grain corn west of the Missouri River
| Olsen P category | VL | L | M | H | VH |
|---|---|---|---|---|---|
| Olsen P (ppm) | 0–3 | 4–7 | 8–11 | 12–15 | ≥16 |
| P₂O₅ rate (lb/ac) | 104 | 78 | 52 | 39 | 10 |
16.8.6 Phosphorus for Dry Bean
Many different cultivar-types of dry edible bean are grown in North Dakota including pinto, navy, blacks, pinks, cranberry, kidney, and various others. Research within North Dakota has been conducted almost exclusively on pinto and navy beans, with the assumption that any yield response to supplemental P is similar across the other cultivar types; an assumption that may or may not be true. Many dry bean growers apply 2 to 3 gallons of 10-34-0, or similar liquid starter, with the seed. According to research conducted at the NDSU Carrington Research & Education center, up to 2 gallons of 10-34-0 may be applied to the seed when the seedbed is moist. However, if the seedbed is dry this rate may result in serious stand and subsequent yield reductions.
16.8.6.1 Table 16.14 Phosphorus recommendations for dry bean
| Olsen P category | VL | L | M | H | VH |
|---|---|---|---|---|---|
| Olsen P (ppm) | 0–3 | 4–7 | 8–11 | 12–15 | ≥15 |
| P₂O₅ rate (lb/ac) | 45 | 30 | 20 | 10 | 0 |
16.8.7 Phosphorus for Flax
Flax is highly dependent on mycorrhizae for P nutrition, and no supplemental P is needed or recommended at any soil test P value. Any P applied will result in a reduction to mycorrhizal colonization, with no added benefit to yield.
16.8.8 Forage and Hay Grasses, Established Tame Grass, and Irrigated Grass-Dominant Hay
For grass and forages, when the soil test P value is less than 12 ppm, any supplemental P will increase yield only if there is sufficient soil moisture to support the additional yield. Any P applied to the surface can be utilized by the grasses if there is rainfall following the application.
16.8.8.1 Table 16.15 Phosphorus recommendations for forage and hay grasses, established tame grass, and irrigated grass-dominated hay
| Olsen P category | VL | L | M | H | VH |
|---|---|---|---|---|---|
| Olsen P (ppm) | 0–3 | 4–7 | 8–11 | 12–15 | ≥15 |
| P₂O₅ rate (lb/ac) | 40 | 26 | 12 | 0 | 0 |
16.8.9 Phosphorus for Millet
Fertilizer rate research for millet in North Dakota has been sparse, and as such the recommendations for supplemental plant nutrients are largely based on results from experiments conducted in neighboring states. Research in Nebraska on Proso millet has shown much greater response to seed-placed P than broadcast P. Up to 70 pounds per acre of 11-52-0 may be applied with the seed, and the value of seed-placed P is twice that of broadcast P.
16.8.9.1 Table 16.16 Broadcast rate of P₂O₅ for millet based on Olsen soil test
| Olsen P category | L | M | H | VH |
|---|---|---|---|---|
| Olsen P (ppm) | 0–7 | 8–10 | 11–13 | ≥13 |
| P₂O₅ rate (lb/ac) | 60 | 40 | 20 | 0 |
Note: Near-seed banded rate of P2O5 is half of these values. (Hergert, & Santra, n.d.).
16.8.10 Phosphorus for Mustard
Mustard P recommendations are the same as the recommendation for canola. Mustard is non-mycorrhizal; therefore, a modest rate of P can be applied with the seed depending on the row-width limits using the same canola recommendation table as a guide. Seed-placed P is twice as efficient as broadcast P; consequently, broadcast rates provided in Table 16.7 may be reduced by half when the P is banded.
16.8.10.1 Table 16.17 Broadcast P rates for mustard based on soil test.
| Olsen Soil Test P, ppm | VL | L | M | H |
|---|---|---|---|---|
| Olsen P (ppm) | 0–3 | 4–7 | 8–11 | 12–15 |
| P₂O₅ rate (lb/ac) | 60 | 44 | 28 | 12 |
Note: Seed-placed rates are half of the broadcast rates
16.8.11 Phosphorus for Oat
Oats respond to P similar to other small grains. Some fertilizer P should always be applied with or near the seed in a banded application due to the cold soil temperatures at seeding across this region. Seed-placed fertilizer P is twice as efficient as broadcast P rates provided in the table, so the seed-placed fertilizer rate is half that of the listed broadcast rate in Table 16.8.
16.8.11.1 Table 16.18 Broadcast fertilizer P₂O₅ rates for oats based on soil test
| Olsen P category | VL | L | M | H | VH |
|---|---|---|---|---|---|
| Olsen P (ppm) | 0–3 | 4–7 | 8–11 | 12–15 | ≥16 |
| P₂O₅ rate (lb/ac) | 60 | 45 | 30 | 20 | 0 |
Note: Seed-placed fertilizer P₂O₅ rates may be reduced by half
16.8.12 Phosphorus for Field Pea, Lentil, and Chickpea
Annual grain legumes, including field pea, lentil and chickpea, all have a high demand for P. When applied with an air-seeder and placed in the seed row, up to about 30 pounds per acre 11-52-0 can be applied. However, since many growers have moved away from air-seeding to a drill seeder, P from any fertilizer source applied with the seed using a drill, may result in stand damage and subsequent reduction in yield. Also, in northwest and southwest North Dakota, where most annual grain legumes are grown, dry seedbeds at planting or shortly after seeding increase risk of harmful effects from seed-placed fertilizer. Therefore, the recommended rates of P should be broadcast for greatest safety. Surface broadcast P can still be effective especially with rainfall occurring soon after seeding, since roots and mycorrhizae supporting these crops are present near the soil surface.
16.8.12.1 Table 16.19 Phosphorus recommendations for field pea, lentil, and chickpea in North Dakota
| Olsen P category | VL | L | M | H | VH |
|---|---|---|---|---|---|
| Olsen P (ppm) | 0–3 | 4–7 | 8–11 | 12–15 | ≥16 |
| P₂O₅ rate (lb/ac) | 40 | 30 | 20 | 15 | 0 |
16.8.13 Phosphorus for Potato
Adequate P for potato is very important for profitable production. Most P should be applied 2 to three inches to the side and 2 to three inches below the seed piece. A variety of band application methods have been utilized, but application to the side of the seed piece is generally accepted by the industry as the most effective band placement.
16.8.13.1 Table 16.20 Suggested P₂O₅ rates for potato production in North Dakota (lb/ac)
16.8.14 Phosphorus for Winter Rye, for grain or seed
For rye production, if soil test P is less than 15 ppm, apply 25 pounds P2O5 with the seed.
16.8.15 Phosphorus for Safflower
Safflower requires P early in the season for adequate growth and yield. As an oil-seed crop, P is particularly necessary for proper oil development in the seed. Placement of P with or near the seed is most effective; research into broadcast vs seed band placement has shown that a broadcast application is hardly ever as effective as a seed-band, even when the rates are increased. Rates in Table 16.21 are for seed or near-seed placement.
16.8.15.1 Table 16.21 Phosphorus for safflower applied with or near the seed.
| Olsen P category | L | M | H |
|---|---|---|---|
| 0-7 | 8-11 | 12-15 | 15+ |
| Olsen P (ppm) | |||
| P₂O₅ rate (lb/ac) | 36 | 27 | 18 |
16.8.16 Phosphorus for Sorghum for Forage and Sudangrass
Adequate P is important for forage sorghum and sudangrass production. The usual manner of P application is broadcast along with the N fertilizer before or at seeding. Any application of P with the seed is not recommended.
16.8.16.1 Table 16.22 Phosphorus recommendations for forage sorghum and sudangrass.
| Olsen P category | VL | L | M | H |
|---|---|---|---|---|
| Olsen P (ppm) | 0–3 | 4–7 | 8–11 | 12–15 |
| P₂O₅ rate (lb/ac) | 40 | 30 | 20 | 20 |
16.8.17 Phosphorus for Grain Sorghum
Grain sorghum requires supplemental P fertilizer only if the soil test is less than 15 ppm, similar to the requirements of corn. Some P may be seed-placed, following the same rate limits as corn. Good success to seed-placed P may be achieved up to 6-gallon per acre 10-34-0 or equivalent if the seedbed is moist. A safer rate to apply if the soil textures in a field are variable and contain sands, or if the seedbed is dry is 3 gallon per acre 10-34-0 or equivalent per acre with water if necessary to enhance its flowability through the delivery system. The remaining P should be broadcast or banded 2 inches or more from the seed.
16.8.17.1 Table 16.23 Phosphorus recommendations for grain sorghum in North Dakota.
| Olsen P category | VL | L | M | H | VH |
|---|---|---|---|---|---|
| Olsen P (ppm) | 0–3 | 4–7 | 8–11 | 12–15 | ≥16 |
| P₂O₅ rate (lb/ac) | 40 | 30 | 20 | 20 | 0 |
16.8.18 Phosphorus for Soybean
Despite the large amount of P that the soybean plant takes up, the critical soil test value (above which, no yield increase should be expected as a result of a P fertilizer application) is only 7 ppm Olsen P. As such, for soybean, the application of P fertilizers of any kind or rate are usually not recommended. Applying P fertilizer to soybean, nearly always results in a stand decrease, and rarely ever results in an increase in yield (although a yield decrease is not uncommon). If applying P to soybeans the recommended application method is broadcast.
16.8.18.1 Table 16.24 Phosphorus recommendations for soybean in North Dakota
| Olsen P category | VL | L | M | H | VH |
|---|---|---|---|---|---|
| Olsen P (ppm) | 0–3 | 4–7 | 8–11 | 12–15 | ≥16 |
| P₂O₅ rate (lb/ac) | 52 | 26 | 0 | 0 | 0 |
16.8.19 Phosphorus for Sugarbeet
Sugarbeet does not support mycorrhizae growth, nor does it utilize any mycorrhizae in its P nutrition strategy. The rates listed in Table 16.25 are for a broadcast P application. However, research at University of Minnesota has shown that a seed-placed application of 3 gallon per acre 10-34-0 or equivalent can result in the same high yield as the full broadcast P rate; because of this most sugarbeet growers utilize this cost-saving seed-placed P in sugar beet production.
16.8.19.1 Table 16.25 Broadcast P recommended for sugarbeet.
| Olsen P category | VL | L | M | H | VH |
|---|---|---|---|---|---|
| Olsen P (ppm) | 0–3 | 4–7 | 8–11 | 12–15 | ≥16 |
| P₂O₅ rate (lb/ac) | 80 | 55 | 35 | 10 | 0 |
Note: A 3 gallon per acre 10-34-0 application with the seed will provide similar yield to sugarbeet amended with the broadcast P rate.
16.8.20 Sunflower supplemental phosphate requirement
Sunflower, like flax, is highly dependent on mycorrhizae. Although, unlike flax (and corn), sunflower seems to be immune to fallow syndrome. No P fertilizer rate experiments that have been conducted in North Dakota on very low Olsen P testing soils, have shown any yield increases or quality improvements in sunflower. Therefore, regardless of the soil test value, no P is recommended for sunflower production.
16.8.21 Spring Wheat and Durum Wheat phosphorus requirement
High yield spring and durum wheat are dependent on adequate P, including a portion of the total P applied with or near the seed at planting. Also, even though the broadcast fertilizer rate for soil test of 16+ recommends 0 P2O5, a small amount of seed-placed P has still been shown to be effective at increasing spring/durum wheat yield in multiple North Dakota experiments.
16.8.21.1 Table 16.26 Broadcast phosphorus recommendations for spring wheat and durum wheat in North Dakota.
| Olsen P category | VL | L | M | H | VH |
|---|---|---|---|---|---|
| Olsen P (ppm) | 0–3 | 4–7 | 8–11 | 12–15 | ≥16 |
| P₂O₅ rate (lb/ac) | 90 | 60 | 35 | 20 | 0 |
16.8.22 Winter Wheat phosphorus requirement
High yield winter wheat is dependent on adequate soil P as well. It is also particularly dependent on seed-placed or near seed-placed P in the fall seeding. The P rate with the seed is limited by the rate of N + K2O provided in Table 16.3 and Table 16.4, which considers row spacing, soil texture and soil moisture. Even on very high Olsen P testing soils, winter wheat will often still show a positive response to yield as a result of any seed-placed or near seed-placed P.
16.8.22.1 Table 16.27 North Dakota phosphorus recommendation for alfalfa establishment Broadcast application rates of P₂O₅
| Olsen P category | VL | L | M | H | VH |
|---|---|---|---|---|---|
| Olsen P (ppm) | 0–3 | 4–7 | 8–11 | 12–15 | ≥16 |
| P₂O₅ rate (lb/ac) | 120 | 100 | 80 | 60 | 40 |
16.9 References for Phosphorus
Chow, L. C. (2001). Solubility of calcium phosphates. In L. C. Chow & E. D. Eanes (Eds.), Octacalcium phosphate (Vol. 18, pp. 94–111). Monographs in Oral Science. Basel, Switzerland: Karger. https://doi.org/10.1159/000059141
Deibert, E. J., & Franzen, D. W. (2023). Fertilizer application with small-grain seed at planting (NDSU Extension Circular SF1751, Revised August 2023). North Dakota State University Extension Service. https://www.ndsu.edu/agriculture/extension/publications/fertilizer-application-small-grain-seed-planting
Frank, K., Beegle, D., & Denning, J. (2015). Recommended chemical soil test procedures for the North Central Region (North Central Regional Research Publication No. 221, Revised). Missouri Agricultural Experiment Station. https://extension.missouri.edu/media/wysiwyg/Extensiondata/Pub/pdf/specialb/sb1001.pdf
Grenkow, L., Flaten, D., Grant, C., & Heard, J. (2013). Seed-placed phosphorus and sulphur fertilizers: Effect on canola plant stand and yield. Canadian Journal of Plant Science, 93(3), 1–10. Hendrickson, J. R. (2007). Corn grain yield with seed-placed 10-34-0 [Unpublished data]. Carrington Research and Extension Center, North Dakota State University, Carrington, ND.
Hergert, G. W., & Santra, D. K. (n.d.). Fertilizing proso millet (Extension Publication G1945). University of Nebraska–Lincoln Extension. https://extensionpublications.unl.edu/assets/html/g1945/build/g1945.htm
National Center for Biotechnology Information. (n.d.). Adenosine triphosphate [2D chemical structure]. PubChem Compound Summary for CID 5957. U.S. National Library of Medicine. Retrieved June 25,2025, from https://pubchem.ncbi.nlm.nih.gov/compound/5957
National Center for Biotechnology Information. (n.d.). Adenosine diphosphate [2D chemical structure]. PubChem Compound Summary for CID 6022. U.S. National Library of Medicine. Retrieved June 25, 2025, from https://pubchem.ncbi.nlm.nih.gov/compound/Adenosine-diphosphate#section=2D-Structure
National Center for Biotechnology Information. (n.d.). Deoxyribonucleic acid [2D chemical structure]. PubChem Compound Summary for CID 44135672. U.S. National Library of Medicine. Retrieved June 25, 2025, from https://pubchem.ncbi.nlm.nih.gov/compound/Deoxyribonucleic-acid
National Center for Biotechnology Information. (n.d.). Nicotinamide adenine dinucleotide phosphate (NADP) [2D chemical structure]. PubChem Compound Summary for CID 5886. U.S. National Library of Medicine. Retrieved June 25, 2025, from https://pubchem.ncbi.nlm.nih.gov/compound/Nadp
Olsen, S. R., Cole, C. V., Watanabe, F. S., & Dean, L. A. (1954). Estimation of available phosphorus in soils by extraction with sodium bicarbonate (USDA Circular No. 939). U.S. Department of Agriculture.
Parfitt, R. L., Atkinson, R. J., & Smart, R. S. C. (1975). The mechanism of phosphate fixation by iron oxides. Soil Science Society of America Journal, 39(5), 837–841. https://doi.org/10.2136/sssaj1975.03615995003900050015x
Parfitt, R. L. (1979). The availability of P from phosphate–goethite bridging complexes: Desorption and uptake by ryegrass. Plant and Soil, 53(1-2), 55–65. https://doi.org/10.1007/BF02181829
Sims, A. L. (2000–2004). [Unpublished research data on sugarbeet phosphorus fertilization]. University of Minnesota Northwest Research & Outreach Center, Crookston, MN.
Sims, A. L., Fabrizzi, K. P., Kaiser, D. E., Rosen, C. J., Vetsch, J. A., & Strock, J. S. (2023). Soil phosphorus balance in Minnesota soils and its effects on soil test phosphorus and soil phosphorus fractions. Soil Science Society of America Journal, 87(5), 918–931. https://doi.org/10.1002/saj2.20549
Teboh, J. M., & Franzen, D. W. (2011). Buckwheat (Fagopyrum esculentum Moench) potential to contribute solubilized soil phosphorus to subsequent crops. Communications in Soil Science and Plant Analysis, 42(13), 1544–1550. https://doi.org/10.1080/00103624.2011.581724