| Table 17.6. Potassium recommendations for corn | ||||||||||
|---|---|---|---|---|---|---|---|---|---|---|
| Smectite-to-illite ratio > 3.5; soil test K ≤ 150 ppm | ||||||||||
| Corn price ($/bu) |
Price per pound K₂O ($)
|
|||||||||
| 0.125 | 0.20 | 0.30 | 0.40 | 0.50 | 0.60 | 0.70 | 0.80 | 0.90 | 1.00 | |
| 2 | 90 | 90 | 90 | 90 | 60 | 60 | 0 | 0 | 0 | 0 |
| 3 | 90 | 90 | 90 | 90 | 60 | 60 | 60 | 60 | 60 | 0 |
| 4 | 90 | 90 | 90 | 90 | 90 | 90 | 90 | 90 | 90 | 60 |
| 5 | 90 | 90 | 90 | 90 | 90 | 90 | 90 | 90 | 90 | 90 |
| 6 | 120 | 120 | 120 | 120 | 90 | 90 | 90 | 90 | 90 | 90 |
| 7 | 120 | 120 | 120 | 120 | 120 | 120 | 120 | 120 | 120 | 90 |
| 8 | 120 | 120 | 120 | 120 | 120 | 120 | 120 | 120 | 120 | 120 |
| 9 | 120 | 120 | 120 | 120 | 120 | 120 | 120 | 120 | 120 | 120 |
| 10 | 120 | 120 | 120 | 120 | 120 | 120 | 120 | 120 | 120 | 120 |
17.1 Phosphorus in plant nutrition
17.2 Sources of potassium and its fate in North Dakota soils
The naturally occurring potassium (K) in North Dakota soils is derived mainly from mica and potassium-feldspars minerals. In soil, K is partitioned among three primary pools —mineral, exchangeable, and soil solution— and its distribution among these pools, unlike the largely biologically driven cycling of soil N) is governed largely by various complex chemical and physical reaction mechanisms, with biological influences only playing a minor secondary role. Recently, K fertility experts around the world produced an updated, and refined flow chart illustrating the various K sources, and the range of possible pathways K can take within the soil (Figure 17.1).
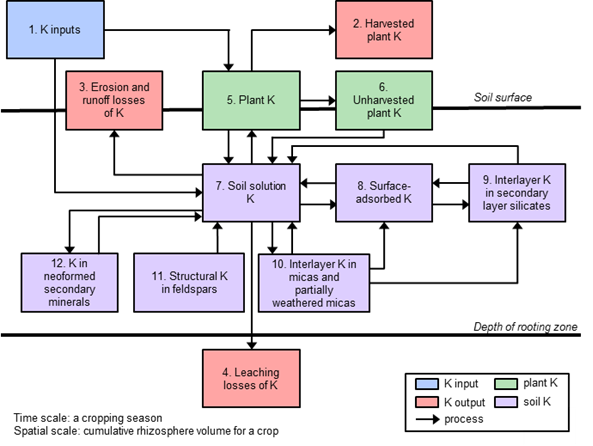
According to this flow chart, the possible K sources leading to plant available K originate from:
- Structural K in feldspars (11)
- Interlayer K in micas (10)
- Partially weathered micas such as illites/hydrous micas (10)
- Interlayer K in secondary layer silicates, such as smectites (9)
- K in neoformed secondary minerals such as illitic clays formed from additions of K to smectitic clays (12)
- K adsorbed to clay minerals and organic matter through cation exchange (8)
- K in equilibrium within the soil solution (7).
The K status of the soil may be enhanced through K additions of either manures or fertilizer K (1). K is removed from the system through various pathways. Plants take up the K they need to meet their nutritional requirements (5) and this K is removed as part of the harvested portion of the crop (2). However, some of the K taken up by plants can also remain in the field as part of the unharvested portion of the plant, commonly referred to as crop residue (6). Potassium can also be lost from the soil through wind or water erosion l (3), or by leaching below the rooting zone (4). Leaching losses may be quite large in low cation exchange capacity soils. In sandier soils in North Dakota with real CEC less than 6, it is not possible to ‘build’ soil K regardless of the rates used because the K in excess of CEC capabilities results in K leaching beyond crop rooting zone.
17.3 Soil testing for critical potassium soil test value in North Dakota with consideration of clay chemistry
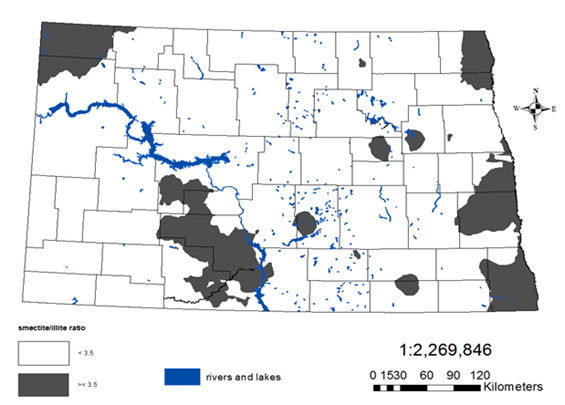
In North Dakota, the critical value for K soil test —using the 1 N ammonium acetate extraction method detailed in section 17.5— is largely dependent on the clay mineralogy ratio of smectite to illite within the soil. While illite clays are saturated with interlayer K, smectite clays have a wider interlayer space, allowing greater movement in and out of water, K and other cations when the soil moisture level is high. As the soil dries, the clay interlayers collapse, essentially trapping the K ions inside the interlayers and preventing it from exiting back into the remaining soil solution ; much like a ravioli, calzone, or pierogi. During a wet spring condition for example, plants may have adequate K nutrition in soils dominated by smectite clay; however, when these soils dry the K is trapped potentially resulting in plant K deficiencies. Therefore, in high smectite soils, the overall K soil test value must be greater than predominantly illitic soils in order to compensate for this temporary K ‘fixation’ within the smectite interlayers.
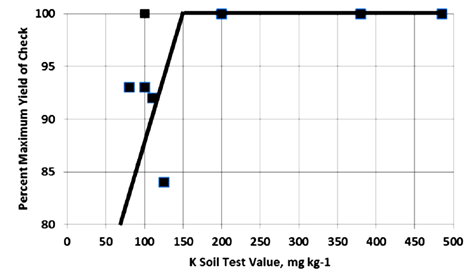
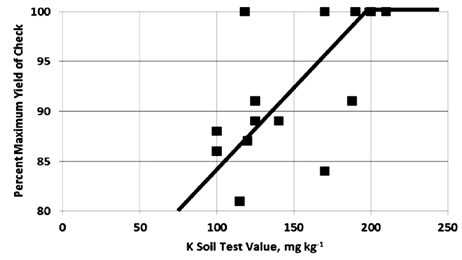
Another factor contributing to the inherent variability of soil test K values is their seasonality. The strongest evidence denoting the seasonal fluctuation of soil test K values — driven by the shrinking and swelling of smectitic clays present in all North Dakota soils and resulting temporary ‘fixation’ and release of the soil K from these smectitic interlayers— was a rigorous experiment conducted in Illinois with a stringent bi-weekly sampling procedure (Franzen, 2011). Soil test K values peaked every year mid-winter, and were the lowest during the driest months of the year, typically August and/or September. The seasonality of the soil test K values were closely related to the soil moisture, measured on the same data as K extraction.
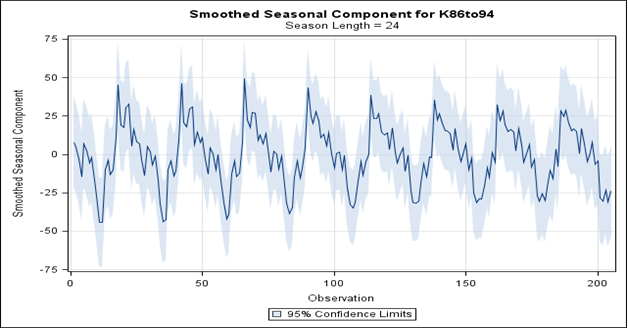 (Pics_and_Figs/Chp_17_figs/5_2.png)
17.4 Cation exchange capacity and its measurement
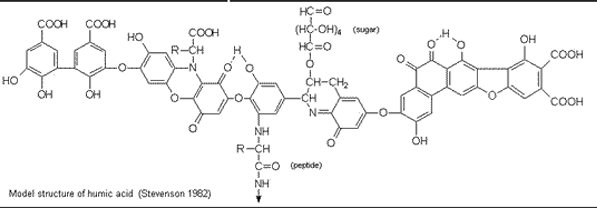
Cations —including potassium, calcium, magnesium, and many others— are positively charged ions, while anions are negatively charged (for further discussion on cations refer to Chapter 5: Basic Chemistry). A cation carries a positive charge because it has lost an electron in its outer orbital (valance shell) At the cusp of the chemical/quantum boundary, electrons remain in their respective orbitals until an outside energy source excites them to a higher-energy state/orbital. When the energy is removed the electron moves back to its original orbital, releasing energy in the form of light in a specific wavelength characteristic for that atom. This absorbance of light of a certain wavelength when the electron is excited and emittance of light in a certain wavelength when as it returns to its unexcited state/orbital forms the entire basis for atomic absorption spectroscopy and related analytical techniques. A potassium atom has one electron in its outer orbital, thus its ionic state after the loss of the electron is +1 charge. A calcium atom has 2 electrons in its outer orbital, giving its ionic state after their loss of +2 charge. A chlorine atom’s outer orbital is one electron short of having a full ‘shell’. When the outer shell vacancy is filled (gaining one electron has lower energy requirement than losing 7 electrons) it gives the atom a -1 charge. Oxygen’s outer orbital needs 2 electrons to be full; hence when these vacancies are filled, it gives oxygen ions a -2 charge. There are two main sources of negative charge in soil, the first being a variable charge which is contributed by organic matter and sensitive to changes in pH. The magnitude of this charge per unit weight of soil organic matter is determined by the number of negatively charged functional groups on the branches of the organic molecules, which can change based on the pH of the surrounding soil water (Figure 17.6). Examples of portions of organic matter structures responsible for its negative charge:
Amino group
When pH < pKₐ:
\[ -NH3+ \quad (pH < pKₐ) \]
When pH > pKₐ:
\[ -NH2 \quad (pH > pKₐ) \]
Carboxyl group
When pH < pKₐ:
\[ {-COOH \quad (pH < pK_a)} \]
When pH > pKₐ:
\[ {-COO^- \quad (pH > pK_a)} \]
When an NH group loses a H ion, the site becomes negatively charged. When a COOH group loses a H ion, it becomes negatively charged. The H ions may come off the structures due to the presence of OH- in solution depending on the solution pH.
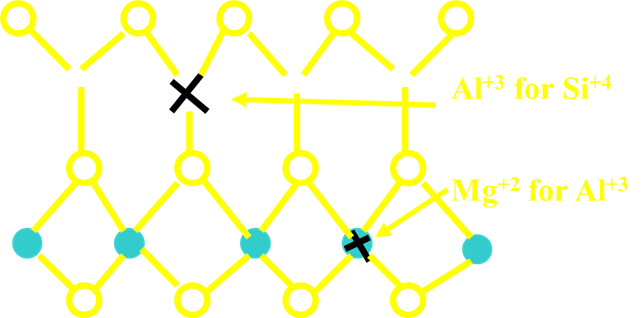
The second source of negative charge is a permanent charge resulting from isomorphic substitution in the soil clay minerals. Isomorphic substitution is where one cation is replaced by another cation of similar size but a differing charge, creating an overall net negative charge (Figure 17.7).
17.5 Cation exchange soil testing methods
When comparing the CEC values of different soils, understanding the method used for determining the initial value is imperative for its correct interpretation. Cations are arranged around the negatively charged clay/organic matter sites with some very close to the surface (the Stern layer) and some in a more diffuse zone surrounding it (the Guoy layer). The length of the extraction time directly influences the quantity of cations that will be extracted, and thus the method’s accuracy in determining the true CEC. Too short of an extraction time will result in the extraction of only the cations from the Guoy layer, while longer extractions allow for the inclusion of more of the cations originating from the Stern layer. In addition, specifically for illitic and smectitic dominated clay soils, if the extraction time is too long, it can result in the extraction of non-exchangeable potassium from the clay interlayers, the inclusion of K origination from K-feldspars minerals which are not associated with the cation exchange capacity of the soil, or possibly even dissolving any calcium or magnesium carbonate molecules that may be present (Figure 17.8).

When determining the CEC of a soil, if there are no free carbonates or soluble salts, a summation method to estimate cation exchange may be a sufficiently adequate and reasonable method to use. The summation method is provided in the NCERA-13 methods publication, and is as follows: - Using a 1 M NH₄OAc solution at pH 7, add 20 ml of solution to 2-g of dried, ground soil in an extraction flask. - The 2-g of soil may be either weighed or closely estimated using a 2g calibrated soil scoop (Peck, 1998). - The solution and soil mixture is then shaken for 5 minutes on a reciprocal shaker at 200 cpm (cycles per minute). - The resulting soil and water suspension is then filtered through Whatman No. 2 or equivalent pore-size filter paper. - An atomic adsorption emission spectrometer is then used to determine the cations in the filtrate, using emission mode. - Some laboratories use an inductively closed plasma (ICP) instrument to measure cation concentration, but the principles of both instruments are similar. - After instrument warmup, calibration is performed using standard cation solutions to construct a standard curve for each cation, then the calibration is tested using standard soil extracts of K, Ca, Mg and Na.
The Cation Exchange Capacity by addition components is then determined as follows: All CEC components are in milliequivalents per 100 g soil. - K = (extract ppm K10)/390= K meq per 100 g (cmol kg^(-1)) - Ca = (extract ppm Ca10)/200= Ca meq per 100 g (cmol kg^(-1)) - Mg = (extract ppm Mg10)/120= Mg meq per 100 g (cmol kg^(-1)) - Na = (extract ppm Na10)/230= K meq per 100 g (cmol kg^(-1))
Exchangeable acidity may be derived from 12 X (7.0 – Sikora buffer pH reading)
In North Dakota, due to the nearly omnipresence of soluble salts and the often-times presence of free carbonates the cations which are present in the final extracting solution when using the summation method results in an inaccurate and inflated CEC value that does not represent the true cation exchange capacity of the soil, A much more accurate CEC is obtained using a method with additional steps. In one ‘real’ CEC method:
- 1M sodium acetate solution is added to the soil.
- The filtrate is discarded, and the sodium saturated soil is then washed with 90% ethanol solution.
- Then the sodium ions are replaced using 1 M ammonium acetate.
- The sodium recovered from the filtrate can then be analyzed, which represents the actual soil CEC at that pH (Chapman, 1965).
Note: An alternative method would be to wash the initial soil sample with 90% ethanol to rid the soil of soluble salts, then use the summation method.
17.6 Methods for determining available potassium for crops
One of the more persistently cited, but terribly flawed methods for determining plant available K and calculated the subsequent rate of supplemental K required to maximize yield is the use of the ‘cation balance’ method developed by W.A. Albrecht at the University of Missouri and F.E. Bear at the University of New Jersey; developed during the period from 1930-1950. An ‘ideal’ soil was proposed that consisted of 2-5% of the base exchange capacity of K. Despite many advances in scientific knowledge since then related to soil pH, the importance of N in crop nutrition, the ability of crops to select and take up nutrients independent of cation ratio to other nutrients in the soil, and the overwhelming rejection of the cation ratio method as a representation of the availability of plant nutrients, the method popularity persists. One possible reason is a recommendation based on cation balance is usually favorable for companies and individuals with various business interests in calcitic lime and gypsum sales, or the sale and promotion of potassium fertilizer. An excellent review of all of the literature surrounding the cation balance approach to crop nutrition is that of Kopittke and Menzies (2007). The overall conclusion of this review states ‘The data do not support the claims of the BCSR (Basic Cation Saturation Ratio), and continued promotion of the BCSR will result in inefficient use of resources in agriculture and horticulture’. As previously explained, the 1 M ammonium acetate extraction method on dried and ground soil was found to be the most closely related to corn K fertilizer yield increases in North Dakota, within a smectite: illite ratio category. The 1 M ammonium acetate extraction method on moist soil was simultaneously investigated for use in North Dakota as part of the same K rate experiments, and was found to be not nearly as related to crop response as the dry soil method was.
17.7 Crop potassium recommendations in North Dakota
17.7.1 Potassium for Alfalfa and Clovers
Potassium is more concentrated in the vegetative tissues of the plant than in the seed. Primarily vegetative crops —such as alfalfa and clovers— have a high K demand. After the alfalfa/clover is harvested and the hay is removed, large amounts of K is removed along with it. Soils with less than optimum k soil test values, should have K applied each year to maintain stand and crop yield. Yearly soil sampling should be conducted at the same general time to ensure consistent results. Crop removal rates of K are around 48 pounds of K2O per ton of hay removed; although the soil (depending on its buffering capacity) may replace some of that from deeper soil depths. Fertilizer K should be applied after the 1st cutting to avoid any injury to the crowns, and to ensure the best utilization of that K by the crop in the 2nd and 3rd cuttings.
17.7.1.1 Table 17.1 Potassium recommended at alfalfa establishment in soils with a
smectite-to-illite clay ratio >3.5 for broadcast application rates of K2O.
| K soil test (ppm) | 0–50 | 51–100* | 101–150 | 150–200 | 200+ |
|---|---|---|---|---|---|
| K₂O (lb/ac) | 180 | 150 | 120 | 90 | 60 |
Soils with estimated CEC ≤ 10: apply 90 lb/ac 0-0-60 at establishment regardless of soil test.
17.7.1.2 Table 17.2 Potassium recommended at alfalfa establishment in soils with a
smectite-to-illite clay ratio <3.5 for broadcast application rates of K2O.
| K soil test (ppm) | 0–50 | 51–100* | 101–150 | 150–200 |
|---|---|---|---|---|
| K₂O (lb/ac) | 150 | 120 | 90 | 60 |
For clovers, if the soil test K soil is less than 150 ppm before establishment, a broadcast application of 60 pounds per acre K2O is recommended before seeding . Even when growing a multi-year crop, the soil should still be tested for K to identify any future needs.
17.7.2 Potassium for Barley
Recommended rates of K for barley production should be broadcast only if the soil test values are less than the critical value. If the Kis being applied as potash to fulfill a crop chloride (Cl) requirement a common management practice since potash or potassium chloride is 50% by weight Cl ion) then a small amount can be added to the starter fertilizer band following to the seed safe limits of N + K2O provided in Table 16.3 and 16.4.
17.7.2.1 Table 17.3 Barley K recommendations for feed or malting grade.
| K soil test category | VL | L | M | H | VH |
|---|---|---|---|---|---|
| K soil test (ppm) | 0-40 | 41-80 | 81-120 | 121-150 | 151+ |
| K₂O rate (lb/ac) | 78 | 60 | 52 | 26 | 0 |
17.7.3 Potassium for Buckwheat
All K rate recommendations for buckwheat would best be applied as a broadcast treatment (Table 17.4).
17.7.3.1 Table 17.4 Buckwheat K recommendations.
| K soil test category | VL | L | M | H | VH |
|---|---|---|---|---|---|
| K soil test (ppm) | 0-40 | 41-80 | 81-120 | 121-150 | 151+ |
| K₂O rate (lb/ac) | 60 | 40 | 30 | 0 | 0 |
17.7.4 Potassium for Canola
Using rates found in Table 17.5, potassium for canola should be broadcast applied.
17.7.4.1 Table 17.5 Canola K recommendations.
| K soil test category | VL | L | M | H | VH |
|---|---|---|---|---|---|
| K soil test (ppm) | 0-40 | 41-80 | 81-120 | 121-150 | 151+ |
| K₂O rate (lb/ac) | 90 | 60 | 40 | 20 | 0 |
17.7.5 Potassium for Corn
There is a K calculator for use in corn provided by NDSU extension (https://www.ndsu.edu/pubweb/soils/corn_k/) The rates generated by the K draws from a database using data collected from southeastern North Dakota. As of 2024, western North Dakota soils predominantly have high K values (> 350 ppm), however with crop rotations having shifted to include more corn and soybean, combined with the soils characterized by generally low CEC’s and significant kaolinite clay content, one would expect the K soil test values would steadily and rapidly decrease, requiring more K rate studies west of the Missouri River to better direct future K application.
17.7.5.1 Table 17.6 Potassium recommendations for corn in soils with clay chemistry having a smectite-to-illite ratio greater than 3.5 and soil
17.7.5.2 Table 17.7 Potassium recommendations for corn in soils with a smectite-to-illite clay ratio > 3.5 and soil test K values from 150 ppm to 199 ppm.
| Table 17.7. Potassium recommendations for corn | ||||||||||
|---|---|---|---|---|---|---|---|---|---|---|
| Smectite-to-illite ratio > 3.5; soil test K = 150–199 ppm | ||||||||||
| Corn price ($/bu) |
Price per pound K₂O ($)
|
|||||||||
| 0.125 | 0.20 | 0.30 | 0.40 | 0.50 | 0.60 | 0.70 | 0.80 | 0.90 | 1.00 | |
| 2 | 90 | 90 | 60 | 60 | 60 | 0 | 0 | 0 | 0 | 0 |
| 3 | 90 | 90 | 90 | 90 | 60 | 60 | 60 | 0 | 0 | 0 |
| 4 | 90 | 90 | 90 | 90 | 90 | 90 | 90 | 60 | 60 | 0 |
| 5 | 90 | 90 | 90 | 90 | 90 | 90 | 90 | 90 | 90 | 60 |
| 6 | 120 | 120 | 120 | 120 | 90 | 90 | 90 | 90 | 90 | 90 |
| 7 | 120 | 120 | 120 | 120 | 120 | 120 | 120 | 120 | 120 | 90 |
| 8 | 120 | 120 | 120 | 120 | 120 | 120 | 120 | 120 | 120 | 120 |
| 9 | 120 | 120 | 120 | 120 | 120 | 120 | 120 | 120 | 120 | 120 |
| 10 | 120 | 120 | 120 | 120 | 120 | 120 | 120 | 120 | 120 | 120 |
17.7.5.3 Table 17.8 Potassium recommendations for corn in soils with a smectite-to-illite ratio less than 3.5 and soil test K levels 100 ppm or less.
| Table 17.8. Potassium recommendations for corn | ||||||||||
|---|---|---|---|---|---|---|---|---|---|---|
| Smectite-to-illite ratio < 3.5; soil test K ≤ 100 ppm | ||||||||||
| Corn price ($/bu) |
Price per pound K₂O ($)
|
|||||||||
| 0.125 | 0.20 | 0.30 | 0.40 | 0.50 | 0.60 | 0.70 | 0.80 | 0.90 | 1.00 | |
| 2 | 90 | 90 | 90 | 90 | 60 | 60 | 0 | 0 | 0 | 0 |
| 3 | 90 | 90 | 90 | 90 | 60 | 60 | 60 | 60 | 60 | 0 |
| 4 | 90 | 90 | 90 | 90 | 90 | 90 | 90 | 90 | 90 | 60 |
| 5 | 90 | 90 | 90 | 90 | 90 | 90 | 90 | 90 | 90 | 90 |
| 6 | 120 | 120 | 120 | 120 | 90 | 90 | 90 | 90 | 90 | 90 |
| 7 | 120 | 120 | 120 | 120 | 120 | 120 | 120 | 120 | 120 | 90 |
| 8 | 120 | 120 | 120 | 120 | 120 | 120 | 120 | 120 | 120 | 120 |
| 9 | 120 | 120 | 120 | 120 | 120 | 120 | 120 | 120 | 120 | 120 |
| 10 | 120 | 120 | 120 | 120 | 120 | 120 | 120 | 120 | 120 | 120 |
17.7.5.4 Table 17.9 Potassium recommendations for corn in soils with a smectite-to-illite ratio less than 3.5 and soil test K values from 101 to 149 ppm.
| Table 17.9. Potassium recommendations for corn | ||||||||||
|---|---|---|---|---|---|---|---|---|---|---|
| Smectite-to-illite ratio < 3.5; soil test K = 101–149 ppm | ||||||||||
| Corn price ($/bu) |
Price per pound K₂O ($)
|
|||||||||
| 0.125 | 0.20 | 0.30 | 0.40 | 0.50 | 0.60 | 0.70 | 0.80 | 0.90 | 1.00 | |
| 2 | 90 | 90 | 60 | 60 | 60 | 0 | 0 | 0 | 0 | 0 |
| 3 | 90 | 90 | 90 | 90 | 60 | 60 | 60 | 0 | 0 | 0 |
| 4 | 90 | 90 | 90 | 90 | 90 | 90 | 90 | 60 | 60 | 0 |
| 5 | 90 | 90 | 90 | 90 | 90 | 90 | 90 | 90 | 90 | 60 |
| 6 | 120 | 120 | 120 | 120 | 90 | 90 | 90 | 90 | 90 | 90 |
| 7 | 120 | 120 | 120 | 120 | 120 | 120 | 120 | 120 | 120 | 90 |
| 8 | 120 | 120 | 120 | 120 | 120 | 120 | 120 | 120 | 120 | 120 |
| 9 | 120 | 120 | 120 | 120 | 120 | 120 | 120 | 120 | 120 | 120 |
| 10 | 120 | 120 | 120 | 120 | 120 | 120 | 120 | 120 | 120 | 120 |
17.7.6 Potassium for Corn, sweet corn
The recommended rates of K for sweet corn should be applied before planting, and are similar to the rates of K for field corn.
17.7.6.1 Table 17.10 Sweet corn K recommendations.
| K soil test category | VL | L | M | H | VH |
|---|---|---|---|---|---|
| K soil test (ppm) | 0-40 | 41-80 | 81-120 | 121-150 | 151+ |
| K₂O rate (lb/ac) | 120 | 120 | 90 | 60 | 0 |
17.7.7 Potassium for Dry Bean
Dry bean is not very responsive to K fertilization. The rates in Table 17.11 should be sufficient to support high yield.
17.7.7.1 Table 17.11 Dry bean K recommendations.
| K soil test category | VL | L | M | H | VH |
|---|---|---|---|---|---|
| K soil test (ppm) | 0-40 | 41-80 | 81-120 | 121-150 | 151+ |
| K₂O rate (lb/ac) | 50 | 20 | 0 | 0 | 0 |
17.7.8 Potassium for Flax
Flax is not very responsive to K fertilization. Table 17.12 provides guidance on rates based on soil test K values.
17.7.8.1 Table 17.12 Flax K recommendations.
| K soil test category | VL | L | M | H | VH |
|---|---|---|---|---|---|
| K soil test (ppm) | 0-40 | 41-80 | 81-120 | 121-150 | 151+ |
| K₂O rate (lb/ac) | 77 | 54 | 32 | 10 | 0 |
17.7.9 Potassium for Forage Grass, Established Tame Grasses and Irrigated Grass Hay
As stated previously, there is far more K in the vegetative tissue of plants compared to the seed. When growing forages, grasses, and hay, adhering to K rates recommended in Table 17.13 will help maintain soil K values.
17.7.9.1 Table 17.13 Forage grass K recommendations including irrigated grass-dominated hay and new seedings.
| K soil test category | VL | L | M | H | VH |
|---|---|---|---|---|---|
| K soil test (ppm) | 0-40 | 41-80 | 81-120 | 121-150 | 151+ |
| K₂O rate (lb/ac) | 60 | 60 | 30 | 0 | 0 |
17.7.10 Potassium for Millet
Recommended rates of K for millet would best be applied before seeing. Table 17.14 provides rates recommended based on the soil test K values.
17.7.10.1 Table 17.14 Millet K recommendations.
| K soil test category | VL | L | M | H | VH |
|---|---|---|---|---|---|
| K soil test (ppm) | 0-40 | 41-80 | 81-120 | 121-150 | 151+ |
| K₂O rate (lb/ac) | 60 | 60 | 30 | 0 | 0 |
17.7.11 Potassium for Mustard
Recommended mustard K rates are similar to those of canola (Table 17.15).
17.7.11.1 Table 17.15 Mustard K recommendations.
| K soil test category | VL | L | M | H | VH |
|---|---|---|---|---|---|
| K soil test (ppm) | 0-40 | 41-80 | 81-120 | 121-150 | 151+ |
| K₂O rate (lb/ac) | 60 | 45 | 30 | 15 | 0 |
17.7.12 Potassium for Oat
Small grains require K when soil test K is low in order to support high yields, by supporting essential plant physiological functions in the plant, and by reducing the impact of certain leaf and root diseases. Potassium recommendations for oat are based on the soil test K values (Table 17.16).
17.7.12.1 Table 17.16 Oat K recommendations.
| K soil test category | VL | L | M | H | VH |
|---|---|---|---|---|---|
| K soil test (ppm) | 0-40 | 41-80 | 81-120 | 121-150 | 151+ |
| K₂O rate (lb/ac) | 90 | 60 | 45 | 15 | 0 |
17.7.13 Potassium for Field Pea, Lentil and Chickpea
Field pea, lentil and chickpea all have similar potassium rates recommendations (Table 17.17).
17.7.13.1 Table 17.17 Field Pea, lentil and chickpea K recommendations.
| K soil test category | VL | L | M | H | VH |
|---|---|---|---|---|---|
| K soil test (ppm) | 0-40 | 41-80 | 81-120 | 121-150 | 151+ |
| K₂O rate (lb/ac) | 60 | 45 | 30 | 15 | 0 |
17.7.14 Potassium for Potato
Potato requires adequate K not only for optimal growth but also good tuber storage quality, by improving and maintaining cell turgor pressure which aids in the tuber’s ability to resist infection by disease causing organisms. The K recommendations vary based on clay chemistry, with higher rates recommended in highly smectitic clay soils, and under dryland conditions. Under irrigation, ideally the soil remains continuously moist, resulting in low K fixation. Therefore, clay chemistry is not considered for potatoes grown under irrigation (Table 17.18).
17.7.14.1 Table 17.18 Potato K recommendations based on soil test and potato cultivar, irrigated and dryland.
| Table 17.18. Potato K recommendations based on soil test and potato cultivar | ||||||
|---|---|---|---|---|---|---|
| K₂O to apply (lb/acre) | ||||||
Soil Test K (ppm)
|
||||||
| 0–40 | 41–80 | 81–120 | 121–150 | 151–200 | 200+ | |
| Irrigated | ||||||
| Before July 25 (<90 DAP)* | 200 | 100 | 75 | 50 | 25 | 20 |
| July 25–Aug 26 (90–120 DAP)† | 300 | 200 | 100 | 75 | 50 | 25 |
| After Aug 26 (>120 DAP)‡ | 400 | 300 | 200 | 100 | 75 | 50 |
| Dryland – Reds | ||||||
| S/I Ratio > 3.5 | 400 | 300 | 200 | 100 | 75 | 50 |
| S/I Ratio < 3.5 | 300 | 200 | 100 | 75 | 50 | 25 |
| Dryland – Russets & Whites | ||||||
| S/I Ratio > 3.5 | 400 | 300 | 200 | 100 | 75 | 50 |
| S/I Ratio < 3.5 | 300 | 200 | 100 | 75 | 50 | 25 |
| Early fresh market varieties include Norland, Red Norland, Dark Red Norland, and Yukon Gold. | ||||||
| † Midseason fresh market and processing varieties include Norkotah Russet, Gold Rush, Ranger Russet, Ivory Russet, Snowden, Atlantic, Dakota Pearl, and Ivory Crisp. | ||||||
| ‡ Late-season irrigated varieties include Russet Burbank, Umatilla, and Alturas. | ||||||
17.7.15 Potassium for Winter Rye, grain or seed
The potassium fertilizer recommendations for winter rye are very simple. If soil test K is less than 100 ppm, apply 30 pounds K2O per acre before seeding.
17.7.16 Potassium for safflower
Low soil test K would be unusual in western North Dakota where most safflower is grown. However, if western growers add soybean and corn to their rotations, the low cation exchange capacity of the soils in western North Dakota, combined with their high kaolinitic/chloritic clay content, will rapidly lead to lower soil test K values and will potentially necessitate the application of K (Table 17.19). Soil sampling by zones will help identify potential low-K soils before they become a problem.
17.7.16.1 Table 17.19 Safflower K recommendations
| K soil test category | VL | L | M | H | VH |
|---|---|---|---|---|---|
| K soil test (ppm) | 0-40 | 41-80 | 81-120 | 121-150 | 151+ |
| K₂O rate (lb/ac) | 60 | 60 | 30 | 30 | 0 |
17.7.17 Potassium for Forage Sorghum and Sudangrass
The harvest and removal of any forage crop that is removed will contain high amounts of K, can result in a rapid reduction of soil test K values. This depletion can be mitigated by application of the recommended rates of K fertilizer (Table 17.20).
17.7.17.1 Table 17.20 Sorghum for forage and sudangrass K fertilizer recommendations.
| K soil test category | VL | L | M | H | VH |
|---|---|---|---|---|---|
| K soil test (ppm) | 0-40 | 41-80 | 81-120 | 121-150 | 151+ |
| K₂O rate (lb/ac) | 60 | 60 | 30 | 30 | 0 |
17.7.18 Potassium for Grain Sorghum
Like corn, grain sorghum yield is optimized with adequate K; which can be maintained by applying the recommended rates of K determined by the soil test value (Table 17.21).
17.7.18.1 Table 17.21 Grain Sorghum K fertilizer recommendations.
| K soil test category | VL | L | M | H | VH |
|---|---|---|---|---|---|
| K soil test (ppm) | 0-40 | 41-80 | 81-120 | 121-150 | 151+ |
| K₂O rate (lb/ac) | 60 | 60 | 30 | 30 | 0 |
17.7.19 Potassium for Soybean
Soybean takes up large amounts of K, and removal of K with seed harvest is large. Despite this the yield benefits of K fertilization for soybean are not as great as those achieved with K fertilization of corn. Regardless of the absence of any clear yield benefit, K should not be ignored when producing soybeans due to its large removal rate in seed harvest, in order to prevent depletion of the soil K (See ?tbl-17-22).
17.7.19.1 Table 17.22 Soybean K recommendations
| K soil test category | VL/VL | L/L | M/M | H/H | VH/H | VH/VH |
|---|---|---|---|---|---|---|
| K soil test (ppm) | 0-40 | 41-80 | 81-120 | 121-150 | 150-200 | 201+ |
| K₂O rate (lb/ac) | 90/90† | 60/90 | 60/60 | 30/60 | 0/60 | 0/0 |
† Split K recommendation, left is for soils with smectite-illite ratio less than 3.5, right is for soils with smectite-illite rate greater than 3.5.
17.7.20 Potassium for Spring Wheat and Durum Wheat
Potassium for spring and durum wheat is usually applied as a broadcast treatment. The fertilizer 0-0-60 (KCl, muriate of potash) also includes about 50% by weight chloride (Cl-) ion. If this K fertilizer is applied to satisfy deficient soil test K conditions, then the crop Cl needs, if any, will likewise be satisfied.
Spring wheat and durum wheat K recommendations in soils with smectite-to-illite ratio greater than 3.5
The K rate for soils with a smectite-to-illite ratio greater than 3.5
\[\text{If } S/I > 3.5:\quad K_{\text{rate}} = \begin{cases} 0 & \text{if } K_{\text{soil}} > 150\ \text{ppm} \\ 30\ \text{lb/acre K}_2\text{O} & \text{if } K_{\text{soil}} \le 150\ \text{ppm} \end{cases}\]
The K rates for soils with a smectite-to-illite ratio < 3.5 is:
\[\text{If } S/I \le 3.5:\quad K_{\text{rate}} = \begin{cases} 0 & \text{if } K_{\text{soil}} > 100\ \text{ppm} \\ 30\ \text{lb/acre K}_2\text{O} & \text{if } K_{\text{soil}} \le 100\ \text{ppm} \end{cases}\]
Note For a map of the interpolated smecitite-to-illite ratios of the soils of North Dakota See @fig Figure 17.4
17.7.21 Potassium for sunflower
Apply 100 pounds per acre 0-0-60 potassium fertilizer or equivalent if soil test K is less than 150 ppm.
17.7.22 Potassium for Sugarbeet
Potassium is very important for optimal sugarbeet: growth, root development and storage characteristics. The K recommendations for sugarbeet vary based on clay chemistry (Table 17.23).
17.7.22.1 Table 17.23 Sugarbeet K recommendations based on soil test and smectite-illite clay ratio.
| K soil test category | VL/VL | L/L | M/M | H/M | VH/VH |
|---|---|---|---|---|---|
| K soil test (ppm) | 0-40 | 41-80 | 81-120* | 121-160 | 161+** |
| K₂O rate (lb/ac) | 120 | 90/120† | 50/90 | 0/60 | 0/0 |
- 120 ppm is critical K value for soils with smectite-to-illite ratio 3.5 or less (Figure 3). ** 160 ppm is critical K value for soils with smectite-to-illite ratio greater than 3.5. †In divided K rate, small number is for soils with smectite-to-illite ratio 3.5 or less; larger number is rate for soils with smectite-to-illite ratio greater than 3.5.
17.7.23 Potassium for Winter Wheat
Potassium recommendations for winter wheat are similar to those for spring and durum wheat. The K fertilizer may be applied in the fall of seeding.
The K rate for soils with a smectite-to-illite ratio greater than 3.5
\[\text{If } S/I > 3.5:\quad K_{\text{rate}} = \begin{cases} 0 & \text{if } K_{\text{soil}} > 150\ \text{ppm} \\ 30\ \text{lb/acre K}_2\text{O} & \text{if } K_{\text{soil}} \le 150\ \text{ppm} \end{cases}\]
The K rates for soils with a smectite-to-illite ratio < 3.5 is:
\[\text{If } S/I \le 3.5:\quad K_{\text{rate}} = \begin{cases} 0 & \text{if } K_{\text{soil}} > 100\ \text{ppm} \\ 30\ \text{lb/acre K}_2\text{O} & \text{if } K_{\text{soil}} \le 100\ \text{ppm} \end{cases}\]
Note For a map of the interpolated smecitite-to-illite ratios of the soils of North Dakota See Figure 17.4
17.8 References for Potassium
Bell, M. J., Moody, P. W., Thompson, M. L., Guppy, C. N., Mallarino, A. P., & Goulding, K. W. T. (2017). Improving potassium rate recommendations by recognizing soil potassium pools with dissimilar bioavailability. In T. S. Murrell & R. L. Mikkelsen (Eds.), Frontiers of potassium science conference proceedings (pp. 239–248). International Plant Nutrition Institute.
Chapman, H. D. (1965). Cation-exchange capacity. In C. A. Black (Ed.), Methods of soil analysis. Part 2: Chemical and microbiological properties (pp. 891–900). American Society of Agronomy.
Franzen, D. W. (2011). Variability of soil test potassium in space and time. In Proceedings of the North Central Extension-Industry Soil Fertility Conference (pp. 74–82). November, Des Moines, IA.
Kopittke, P. M., & Menzies, N. W. (2007). A review of the use of the basic cation saturation ratio and the “ideal” soil. Soil Science Society of America Journal, 71(2), 259–265. https://doi.org/10.2136/sssaj2006.0186
Peck, T. R. (1998). The standard soil scoop. In Recommended chemical soil test procedures for the North Central States (Chap. 2.1). North Central Regional Research Publication No. 221. https://extension.missouri.edu/media/wysiwyg/Extensiondata/Pub/pdf/specialb/sb1001.pdf
Stevenson, F. J. (1982). Humus chemistry: Genesis, composition, reactions. New York, NY: John Wiley & Sons.