29.1 The Value of Fertility Research
The research that is carried out both on the campus of NDSU, and across the state at the various NDSU Agricultural Experimentation Centers is invaluable to growers when it comes to helping them answer their questions related to basic crop production systems, cropping inputs, and soil fertility. The work of these researchers has led to many important advancements in production and nutrient management of almost all of the major and minor crops grown across the state. Along with the experiments conducted at the Experiment Stations, hundreds of farmer-cooperator field trials have been, and are still carried out in grower fields across the state. Despite these numbers, it can be confidently said that most of the fields in North Dakota have yet to have an experiment conducted within their boundaries. Even with all of the foundational fertility work that has been, and is still being conducted on traditional cropping inputs, the ever-expanding market of non-traditional products available to growers in North Dakota that have little non-company data to support their profitable use highlights the ongoing necessity of research conducted by NDSU on-farm and at these experiment stations.
What is the best resource for growers looking for unbiased data on cropping inputs and agricultural products? Currently, and historically, North Dakota State University plays, and has played, a key role as part of an Agricultural Experiment Station committee on ‘Non-conventional Amendments and Additives’, called NCERA-103. The committee’s website: https://ncera103.org/ includes a searchable database that houses all the research and data collected from experiment done using various products, as long as there was at least 2 site-years of replicated data from an unbiased source. Sometimes, the product’s name might be searchable in the database; however, many products are sold for only a few years before either being taken off the market, or undergoing a rebrand. Some products are also frequently sold to other companies, leading to the product’s name to be changed. Therefore, searching first by a product’s name might yield reports, but if not, then searching for a category of products, such as ‘biological’, soil amendment’ or ‘inhibitor’ might give better results. The reports and data displayed after a search might include the product of interest or be related to it based on its active-ingredient. These reports can aid growers by providing insight into the potential value of the products of interest, prior to making an economic investment; that could potentially, yield no profit.
29.2 On Farm Research
Farmers now have the ability due to many of the recent advances in technology to conduct replicated research trials on their own farms. Location determining GPS on their application equipment combined with GPS-connected harvest grain and yield monitors allow farmers to test different products and management options for their own operations. Areas to which the different treatments are applied can be spatially tagged, allowing for the collection and analysis of the corresponding yield monitor data after harvest.
It is important to remember that if any change in management decision, or a different treatment applied to the soil or crop is not replicated within a field, then any observations or data collected is meaningless. To paraphrase an economic advisor phrase on stock performance, ‘a result from an unreplicated treatment result is no indication of future performance’. Agricultural statistical methods were invented principally after WWI in Rothamsted, England. Initially they were developed in order to bring meaning to frustratingly inconsistent research trials on crop varieties, crop management techniques and crop inputs. Their invention was spearheaded by the efforts of a crop breeder and mathematician R.A. Fisher. His designs and methods are still the foundation for the fundamentals of all agricultural experimental designs currently used today. If constructed correctly, with well thought-out treatments that take into consideration the variation in different in-field/soil characteristics, the results of a replicated experiment can serve as an excellent predictor of the success of the same treatment in future field situations, with similar conditions to the fields in which they were tested (Street, 1990).
The most common mistakes made by growers when conducting field trials are applying the treatment to one only field and then comparing those results to another, entirely separate field. This is strictly an observation, not a true experiment. Likewise, splitting a field in half, and applying a treatment to on only one side, is also only an observation, and the results could just as likely be entirely different if they were applied to another split field.
A true experiment has to have at least two replications. For example, an untreated strip immediately next to a treated strip, both of similar size, and then at least one additional pair of untreated and treated strips. The more of these replications that are constructed, the more confidence the farmer will have in determining whether or not any observed differences, even small ones, are a result of the treatment and are ‘significant’. Significance means that there is a very low probability of any of the observed differences occurring simply due to random chance.
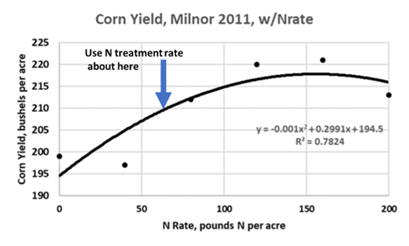
In constructing a strip trial, the width of the treatments needs to be at least the width of the combine header that will be used to harvest the strips. Some consideration on what the treatment rates will be is also very important. In a trial where a product claiming to provide a nitrogen benefit is to be tested, the nitrogen rates of the treatment strips should be low enough that any additional nitrogen benefit will be seen (Figure 29.2).
Although it is anticipated that NDSU will have a similar web presence supporting on-farm research in the future, currently the University of Nebraska Extension has an effective on-farm website at present https://on-farm-research.unl.edu/. The website has excellent guidance on setting up experiments and a very simple and effective statistical tool for data analysis https://cropwatch.unl.edu/farmstat-welcome .

29.3 References for on-farm research
Street, D.J. 1990. Fisher’s contributions to agricultural statistics. Biometrics 46:937-945. Thompson, L.J. 2022. Integrated and impactful research and extension through digital on-farm research. Proceedings of the North Central Extension-Industry Soil Fertility Conference. Des Moines, IA, November, 2022. https://northcentralfertility.com/proceedings/?action=abstract&id=9471&title=Integrated+and+Impactful+Research+and+Extension+Through+Digital+On-farm+Research&search=authors