4.1 Density of Soil Solids
The density of the mineral portion of a soil is 2.6 to 2.7 gm/cm3, which is essentially the density of rocks. However, in soil, minerals are only a portion of soil volume.
4.2 Dry Bulk Soil Density
About half of soil volume is composed of minerals and organic material, while the other half is pore space. In sands, bulk density may be as high as 1.6 gm/cm3, while in clays that are well aggregated, the bulk density may be as low as 1.1 gm/cm3. It is not possible to compact the soil to the density of rock, although contractors working with civil engineers to prepare roadbeds do their best to achieve this. The orientation of the soil particles makes producing rock-type mineral density impossible. In soil, no matter how compacted it is, water and air can still move within it, although the greater the compaction the more slowly they are able to move. The bulk density of a soil is measured by taking a core or block of soil of a specific measured volume, drying it and then dividing its total mass by its volume, using the following equation:
\[ \text{Bulk Density} = \frac{\text{Dry Soil Mass}}{\text{Soil Volume}} \quad \left( \frac{\text{g}}{\text{cm}^3} \right) \]
4.3 Soil Porosity
As this term indicates, soil porosity is the measure of the total volume of the pore space in the soil. Porosity values vary from 30% to 60%. Sands have less pore space compared to clays. The calculation is:
\[ \text{Soil Porosity} = \frac{\text{Volume of Soil Space Filled with Air and Water}}{\text{Volume of Entire Soil}} \]
4.4 Soil Wetness
Soil wetness is measured as gravitational water (w) and/or volumetric water (Θ theta). The calculation for w is: \[ w = \frac{M_w}{M_s} = \frac{\text{Mass of Water}}{\text{Mass of Dry Soil}} \] The dry soil mass (Ms) is determined by drying the soil in an oven at 105 C (221 F) until a constant weight is achieved. Even at that high of a temperature, clay soils still retain a tightly held film of water that isn’t released; however, since results are defined by the method, and this is the conventional method used, the resulting values are what are compared, used and accepted. The calculation for Θ is:
\[ \Theta = \frac{\text{Volume of Water}}{\text{Volume of Soil}} \]
For medium-textured soils, Θ ranges between 40% and 50%, while in clays Θ is typically near 60%.
4.5 Soil Water Movement
It is common for people to think that the overall movement of soil water is downward due to gravity. It is true that gravitational water (Θ_g) is an important part of the direction of water movement but only one part. Soil physicists depict direction of water movement or total water potential (Θ_t) as:
\[ \Theta_t = \Theta_g + \Theta_p + \Theta_o + \dots \]
which translates to total water potential equals gravitational water potential plus pressure or matric potential plus osmotic potential plus other environmental factors that can include capillary water movement or changes in water table due to accumulated rainfall or drought.
The gravitational potential of the water depends on the relative height of the water from a maximum elevation to whatever is perceived to be the base (for calculation purposes).
Below the water table the pressure potential is positive. Above the water table, the pressure potential is negative, referred to often as a positive suction and it is influenced by upward movement of water due to capillary flow. For example, take a person drinking from a straw, as they suck the water in the straw moves upward in a certain amount. When the diameter of the straw is decreased yet the amount of suction stays the same, the water moves upward much farther. In soil, since the pore spaces are very small, the capillary movement of the water may be a foot or two in sandy soil but as much as ten or more feet in fine-sandy loams, silt loams and clays.
Osmotic potential at the root/soil interface, plays a key role in water uptake by plants. Osmotic potential is a measure of how much total dissolved solutes (salts or “stuff”) are in the soil water, which affects how easily plants can absorb or suck in the water. The more solutes there are dissolved in the soil water, the harder it is for plants to take up the water. In North Dakota, there are nearly always solutes (salts) present in the soil water, which increases its osmotic potential. Within the plant cells, however, there are also dissolved solutes. One mechanism the plants use to uptake water is through the plant cell’s osmotic potential. Plants deposit sugars and minerals inside the cells in their roots increasing their osmotic potential making it easier for water to enter the cells via osmosis. Water moves from a volume of lower osmotic potential to higher osmotic potential. With low soil water osmotic potential a plant root cell’s osmotic potential enables it to uptake water and dissolved nutrients with minimal energy. However, in a soil with a higher soil water osmotic potential (greater load of salt), plants have to expend more energy to uptake the same amount of water, potentially accumulating a higher concentration of solutes than is beneficial or healthy for proper cell function, ideal metabolism and overall growth. too great of solute concentration for ideal plant metabolism. Later in the saline soil discussion, the osmotic potential of salt in relation to plant health will be further explained.
4.6 Soil Water Retention
The amount of water held by the soil changes depending on whether the soil is drying or becoming wetter, this in turn affects how much suction is needed to remove the water. The visual effect of soil water content at varying degrees of suction force is the soil retention curve (Figure 4.1). A clay soil retains much more water in a plant-usable form compared to that of a sandy soil.

4.7 Infiltration of Water into Soil
A soil infiltration rate is defined as the volume flux (mm/hr) of water flowing into the soil surface area. In a uniform soil (which does not exist but helps us understand the principles for infiltration), the infiltration rate depends on soil texture. A sandy soil can generally accept the water from even a moderate summer thunderstorm, which can result in .5 to 1.5 inches of water, but Fargo clay soils can accept only about 1/3 of an inch per day, which largely explains flash flooding in Red River Valley towns, cities and fields during summer months.
Table 4.1. Water infiltration rate based on soil texture.
| Soil Texture | Infiltration Rate (mm/hr) | Infiltration Rate (inches/hr) |
|---|---|---|
| Sand, loamy sands | >20 | >0.8 |
| Sandy loams, silt | 10–20 | 0.4–0.8 |
| Loam | 5–10 | 0.2–0.4 |
| Silty clay loam, clay | 0.1–5 | 0.01–0.2 |
| Sodic, clayey | <1 | <0.01 |
4.8 Effect of Surface Crusting on Water Infiltration
In poorly aggregated soil, such as a soil with minimal residue that’s been tilled in the spring, the soil particles tend to break down into a single-grain structure. When rainfall occurs, it further disperses these aggregates, turning them into a slurry. When dry, the soil particles bind together, closing off small pores and forming a surface crust that prevents water infiltration.This is referred to as a soil crust. Crusts are strongly held together by particle-to-particle interaction, and they can be quite thick. The strength of the crust particle adherence makes it difficult for germinating seeds to penetrate and for water to penetrate at the next rainfall event.
4.9 Preferential Flow
Although the previous discussions and calculations are performed on uniform soils, the reality is that nature is not perfect and that cracks, old root channels, soil aggregates and any other discontinuity favoring downward water movement results in water tending to follow the paths of least resistance within the soil. With an air-filled pore space of 25%, one would think that an inch of rainfall would infiltrate to a uniform depth of 4 inches in the soil. However, at a small spatial scale, some of the water might flow to a depth of 1 foot or more if there is an earthworm hole present. In the Red River Valley following an extended dry period, the cracks in the smectitic clays may reach to 4 feet in depth, and the water will flow there, while other areas of more continuous mineral or organic matter makeup at the surface may only wet to a half inch.
4.10 Plant Available Water
Plant-available water refers to the amount of water in the soil that plants can access for growth and metabolism. This water exists between two critical moisture levels (Figure 4.2):
Field capacity
Wilting point
Field capacity is the amount of water the soil holds after excess water has drained, the remaining water is held onto by the soil against the force of gravity but is still available for plants. This water is typically held at a tension of about 0.33 bar of atmospheric suction (meaning it would take a plant root exerting a suction force greater than this to pull this water out of the soil). In contrast, the permanent wilting point is the level at which the water is held so tightly by the soil that plant roots can no longer produce a suction force strong enough to extract it. This is typically at a tension of about 15 bars of atmospheric suction, which may vary depending on the crop. The difference between these two points defines the amount of plant-available water, which is the water that can be extracted by plants for growth (Table 4.2). Plant-available water depends highly on soil texture and also varies depending on the growth stage of the crop and rooting depth.



Table 4.2. Plant-available water by soil texture.
Plant-available water at selected soil textural classes, assuming plant-available water is the water held between 1/3 atmosphere suction and 15 atmosphere suction.
| Soil Texture | Plant-Available Water (inches of water per inch of soil) |
|---|---|
| Coarse sand and gravel | 0.02–0.05 |
| Sand | 0.05–0.11 |
| Loamy sand | 0.09–0.15 |
| Sandy loam | 0.11–0.15 |
| Loams | 0.11–0.17 |
| Silt loam | 0.11–0.18 |
| Silty clay loam | 0.11–0.15 |
| Clay loam | 0.09–0.16 |
| Sandy clay loam | 0.09–0.15 |
| Silty clay | 0.10–0.16 |
| Clay | 0.10–0.16 |
4.11 Tile Drainage
Since a relative wet period began in the early 1990s, the acreage within fields that are tile drained in North Dakota has increased from less than 1,000 acres to well over 1 million acres. The purpose of tile drainage is to remove free water from a potential rooting zone to enable more consistent crop production. A secondary purpose of drainage in North Dakota is to remove excessive soluble salts from the rooting zone. The removal of free water to a depth of tile placement is always accomplished, at least directly over the tile. However, the removal of soluble salts requires not only the outlet but also excess precipitation over what the crop uses to dissolve soluble salts and move them into the tile, hence removing them from the field. Tile spacing will depend on the soil texture in the part of the field where the tiles are installed (Figure 4.3). Clay soil tile spacing may be only as wide as about 33 feet, while spacing in a sandy loam soil may reach a width of over 200 feet (Table 4.3). Water will not move from soil into the tile unless the hydraulic pressure over the tile is greater than atmospheric pressure. So only free gravitational water enters the tile.
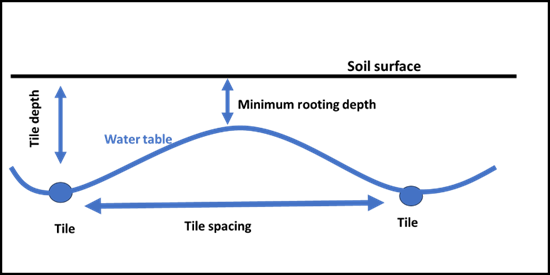
Table 4.3. Tile spacing and hydraulic conductivity with soil texture.
| Soil Texture | Hydraulic Conductivity (cm/day) | Tile Spacing | Tile Depth |
|---|---|---|---|
| Clay | 0.15 | 33–66 ft | 3–5 feet |
| Clay loam | 0.15–0.5 | 48–80 ft | 3–5 feet |
| Loam | 0.5–2 | 65–115 ft | 3–5 feet |
| Fine sandy loam, silt loam | 2–6.5 | 95–130 ft | 3–5 feet |
| Sandy loam | 6.5–12 | 95–220 ft | 3–6 feet |
4.12 Seasonal Plant-Available Water Sources
4.12.1 Water Table
Do not assume that the water a crop takes up, and is available for its uptake, is only the precipitation from seeding until maturity. In the North Dakota environment, the depth of the water table at the date of seeding, the water content of the soil to rooting depth, and any losses in water due to tillage and planting are all very important. Here is an example of total water availability for a spring wheat crop in a made-up year and field in central North Dakota.
Field Soil texture: Loam
Soil Moisture at Planting (April 20th): 4 feet and 8 inches
Water table depth at planting: 4 feet
Growing season rainfall from April 20 planting date until maturity at July 20: 6 inches
No-till planting moisture loss: ¼ inch
Conventional-till planting moisture loss: 1.5 inches
Total seasonal moisture availability no-till: 13.75 inches
Total seasonal moisture availability conventional till: 12.5 inches
Additional in-season capillary moisture availability: about 4 inches
Total moisture availability no-till: 17.75 inches
- Potential wheat yield ~ 80 bushels per acre
Total moisture availability conventional till–16.5 inches
- Potential wheat yield ~ 70 bushels per acre
4.12.2 Capillary water movement
Capillary water movement of the water table is very important for North Dakota crop production. In one experiment near Casselton, a 200-bushel-per-acre corn yield was achieved in a clay soil with only six inches of seasonal rainfall. The remainder was available from pre-spring moisture storage and capillary water rise, which in a clay soil can exceed 8 feet, a height also achievable in fine, sandy loams and silt loams. A mulch covering from no-till or strip-till systems will also decrease moisture loss during the growing season, further increasing the efficiency of soil water to produce grain in those systems.
4.13 Further Reading and Study
For a more simplified description of soil physical properties, the book written by Hillel (1982) “Introduction to Soil Physics” (Academic Press, San Diego, CA) is highly regarded in soil science circles, and it minimizes the need for knowledge of calculus for reader understanding.