6.1 Source of Soil Salinity
A common challenge of North Dakota soils, and in other regions around the world where evaporation exceeds annual precipitation, is the accumulation of soluble salts in the crop rooting zone. The dominant anion in North Dakota soluble salts is sulfate. The exception to this is a few areas, where chloride is the dominant anion, particularly west of Grand Forks, where the orientation of the shale bedrock leads to chloride-rich salts near the soil surface (see chapter 1). The major cations in North Dakota’s soluble salts tend to be calcium, magnesium and sodium. The combination of these cations and anions results in an abundance of Gypsum (calcium sulfate) and magnesium sulfate. The presence of sodium sulfate or sodium chloride may lead to saline-sodic soils and to the development of sodic soils. Soluble salts in general reduce the productivity of a crop and restrict its growth by interfering with plants ability to uptake water or by toxic build up in the plants tissue.
The visual symptoms of high soluble salts resemble crop experiencing a drought. In simplest terms, a plant can take up water because their plant sap has more dissolved salts in it than the soil water, which pulls water into their roots. Water moves from regions of low salt to regions of high salt. When soil water increases in saltiness, plants either have to increase their salt/electrolyte concentration in their sap, or they begin to suffer from drought stress. A plant can only increase its internal salt concentration so far before it interferes with basic cellular functions. As the salt concentration rises in the tissue, the function of intracellular organelles begins to decline, and the plant may eventually exhibit toxicity symptoms due to the high concentrations of certain elements. North Dakota crops have a wide range of differences in salt tolerance, with considerable variation in salt tolerance even among cultivars. The notion to test cultivars for tolerance is a relatively new idea not only in North Dakota alone, but in the world. However, except for a few salt-tolerant perennial grasses and soybean cultivars, up to this point there has been little work to identify cultivar differences in salt tolerance. Although some preliminary work has begun in North Dakota, the screening of cultivars is very limited due to its complexity. One reason why this screening work is so difficult is the spatial variability of soluble salts within fields. The basics of soil salinity are provided here, however a more comprehensive publication on soil salinity in North Dakota is available through North Dakota State University Extension (Franzen, et al. 2019).
Soil salinity, as discussed previously, becomes a concern in regions where evaporation or transpiration potential is greater than precipitation. This is common in North Dakota’s seasonal climate, which features low rainfall during the growing season, combined with high summer temperatures, and strong winds; leading to an increase in moisture loss from both soil and plants. The groundwater (i.e. saturated zones under the soil surface) in the state tends to have high salinity. Shallow groundwater means the distance from the soil surface to the saturated zone is small. Groundwater, and the salts it contains, moves toward the surface through capillary pull (often termed “unsaturated flow”). This capillary rise in clay loams, silt loams, fine sandy loams, silty clay loams and clay can be as great as 11 feet.
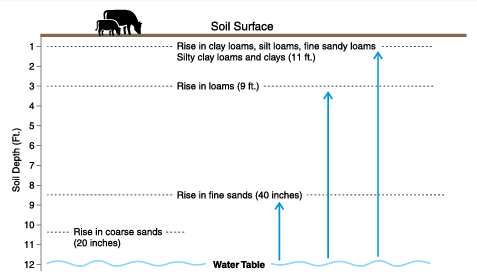
Precipitation tends to remove salts from the soil surface leaching them downwards; however, this same precipitation also tends to close the distance between groundwater depth and the soil surface. During periods of precipitation, soil surface salinity is temporarily reduced; however, once the soil dries, capillary pull tends to increase salinity.
6.2 Types of Salinity Development in North Dakota
The types of salinity that develop in North Dakota are related to where the salt-laden groundwater intersects with crop rooting depth. In the Red River Valley and other relatively flat landscapes in the state, microenvironments are present in which rainwater or snowmelt infiltrates into depressions, leaching out salts. However, the movement of water downward is impeded by clay content, thus the capillary pull of the water from the dry atmosphere of summer results in bumps on the landscape pulling water from the depressions sideways, then upwards, resulting in salinity on the landscape bumps.
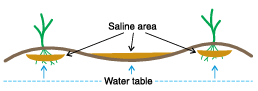
Another type of salinity is characterized by surface water, either natural from a pothole, wetland or marsh, or man-made from a roadside ditch. This surface water exerts a pressure downward (the force of gravity) into the underlying soil; however, the evaporative pull of the dry summer air pulls water sideways from beneath the standing water out into the field and then upwards to the soil surface. Because the water moves from beneath the standing water out into the field in an arc, sometimes the soil directly adjacent to the standing water is relatively low in salts. It’s not until farther out into the field where a barren ring in the landscape forms, due to the accumulated salts, around the wetland or ditch resulting in a ‘dead zone’. One strategy to reduce road‑ditch salinity is to plant alfalfa or a salt‑tolerant grass in a strip adjacent to the water body.
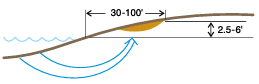
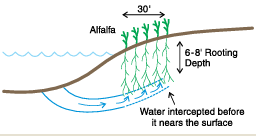
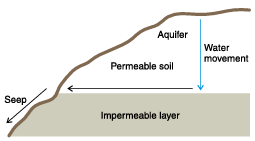
In hilly landscapes a water infiltration limiting layer, such as a textural discontinuity, may prevent downward water movement. Upland water leaches until it reaches a discontinuity in texture or more easily moves within a coal seam (Halvorson, 1990). The sediments above the limiting layer saturate with water and move with gravity sideways, escaping out the side of the hill. The water carries salts with it, which in turn are deposited on the hillside where the water evaporates, producing a saline seep.
6.3 Detecting and Measuring Soil Salinity
To manage salinity, measure the degree of salinity using proper soil sampling and testing techniques. The soil surface (0‑to‑6‑inch depth) and the subsurface (6‑24 inches) are especially important for determining overall soil salinity. Most soil laboratories generally have the ability to conduct soil salinity analyses. One standard test is the saturated paste method (ECₑ), where a lab technician essentially saturates a soil, afterwards removing/separating the water from the soil “paste” via a vacuum pump where they then determine the electrical conductivity (EC) of the water. The more common diagnostic method for determining salinity however, is the 1:1 method (EC₁:₁). The EC₁:₁ method is cheaper to perform, and it is used as default for most commercial salinity determination in the state. A conversion formula to convert 1:1 to saturated paste methods and vice versa has an R² value of about 0.90 in state soil sample comparisons.
Conversion formulas:
\[ \mathrm{EC}_a \;=\; 2.2 \times \mathrm{EC}_{1:1} \]
\[ \mathrm{EC}_{1:1} \;=\; 0.45 \times \mathrm{EC}_a \]
6.4 Crop Tolerance to Salinity
Of all the most commonly grown crops in North Dakota, oats are the most tolerant to salinity, followed closely by barley. Corn and soybean are two crops with some of the greatest acreage in production; however, their productivity is low if the soil EC₁:₁ is greater than two mmho/cm.
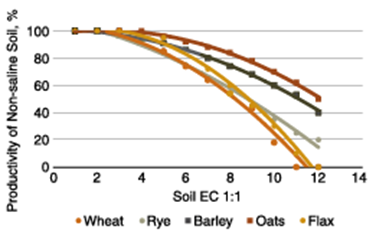
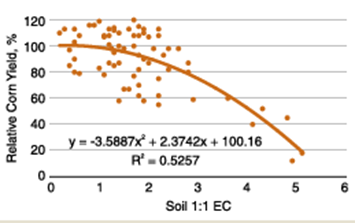
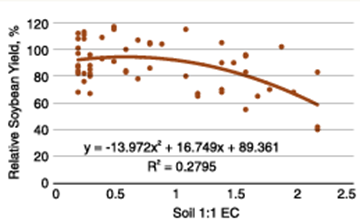
Table 6.1 Salinity tolerance of selected North Dakota crops.
| Crop | Threshold salinity (EC 1:1, mmhos/cm) | 10 mmhos/cm | 25 mmhos/cm | 50 mmhos/cm | 100 mmhos/cm |
|---|---|---|---|---|---|
| Alfalfa | 1.0 | 1.6 | 2.5 | 4.2 | 7.9 |
| Barley | 2.0 | 3.0 | 4.5 | 6.0 | 12.0 |
| Canola | 1.5 | 2.0 | 3.0 | 4.0 | 7.5 |
| Chickpea | 0.75 | 1.0 | 1.6 | 2.3 | 4.0 |
| Corn | 1.0 | 2.0 | 3.0 | 4.0 | 5.5 |
| Dry bean | 0.5 | 0.8 | 1.3 | 1.7 | 3.0 |
| Faba bean | 0.75 | 1.0 | 1.75 | 2.5 | 4.5 |
| Field pea | 0.3 | 1.0 | 1.8 | 3.75 | 7.0 |
| Flax | 0.5 | 0.6 | 1.0 | 1.5 | 3.0 |
| Lentil | 0.6 | 0.75 | 1.25 | 1.5 | 3.0 |
| Oats | 2.3 | 3.0 | 4.0 | 6.0 | 8.0 |
| Rye | 3.8 | 5.4 | 6.3 | 7.2 | 10.0 |
| Safflower | 3.5 | 4.5 | 6.5 | 8.0 | 14.0 |
| Soybean | 0.6 | 1.0 | 1.75 | 2.3 | 4.0 |
| Sugarbeet | 3.0 | 4.0 | 6.0 | 8.0 | 12.0 |
| Sunflower | 0.75 | 1.0 | 2.0 | 2.5 | 10.0 |
| Wheat | 1.0 | 2.0 | 3.5 | 5.5 | 11.0 |
Table 6.2 Salinity tolerance of forage grasses in North Dakota.
| Forage | Threshold salinity (EC 1:1, mmhos/cm) | 10 mmhos/cm | 30 mmhos/cm | 100 mmhos/cm | Reference |
|---|---|---|---|---|---|
| Alkaligrass Nuttal | 6.3 | 7.0 | 8.5 | 13.5 | Riedell, 2008 |
| Alkali sacaton | 6.3 | 6.9 | 8.0 | 12.0 | Grattan, 2004 |
| Brome, smooth | 2.3 | 2.6 | 3.0 | 4.5 | McElgunn and Lawrence, 1973 |
| Fescue, tall | 3.6 | 4.0 | 5.0 | 8.1 | Bower et al., 1970 |
| Foxtail, Garrison Creeping | 6.2 | 6.9 | 8.3 | 13.5 | Riedell, 2008 |
| Grama, blue | 2.7 | 3.0 | 3.5 | 5.4 | U.S. Salinity Lab, 1954 |
| Ryegrass, perennial | 2.6 | 3.3 | 6.5 | 10.0 | Brown and Bernstein, 1953 |
| Wheatgrass, green AC Saltlander | 4.0 | 5.0 | 6.0 | 14.0 | Steppuhn et al., 2006 |
| Wheatgrass, fairway crested | 2.7 | 1.0 | 1.75 | 2.5 | McElgunn and Lawrence, 1973 |
| Wheatgrass, intermediate | 2.7 | 3.0 | 3.5 | 5.4 | Dewey, 1960 |
| Wheatgrass, slender | 4.5 | 5.0 | 6.0 | 9.0 | McElgunn and Lawrence, 1973 |
| Wheatgrass, tall | 5.9 | 6.5 | 8.0 | 14.0 | Riedell, 2008 |
| Wheatgrass, western | 2.7 | 3.0 | 3.7 | 7.2 | U.S. Salinity Lab, 1954 |
| Wildrye, beardless | 5.9 | 6.4 | 7.7 | 11.7 | Brown and Bernstein, 1953 |
| Wildrye, Canadian | 4.5 | 5.4 | 7.2 | 14.2 | U.S. Salinity Lab, 1954 |
| Wildrye, Russian | 5.9 | 6.4 | 7.4 | 11.2 | McElgunn and Lawrence, 1953 |
6.5 General Recommendations for Improving Productivity of Saline Soils
- Manage saline sites as soon as they are identified to prevent further spread of salinity.
- Soil sample to determine EC values at the 0‑ to 6‑inch and 6‑ to 24‑inch depths.
- Grow something throughout the growing season to lower the water table depth. This may include cover crops.
- Monitor the EC every year to determine progress and to see if a greater choice of crops is possible.
- Establish an alfalfa or perennial grass buffer strip alongside ditches and surface water bodies. Consider tile drainage if practical.
6.6 References for Soil Salinity
- Butcher, K., Wick, A. F., DeSutter, T., Chatterjee, A., & Harmon, J. (2016). Soil salinity: A threat to global food security. Agronomy Journal, 108(6), 2189–2200. https://doi.org/10.2134/agronj2016.06.0368
- Butcher, K., Wick, A. F., DeSutter, T., Chatterjee, A., & Harmon, J. (2018). Corn and soybean yield response to salinity influenced by soil texture. Agronomy Journal, 110(1), 1–11. https://doi.org/10.2134/agronj2017.10.0619
- Franzen, D., Gasch, C., Augustin, C., DeSutter, T., Kalwar, N., & Wick, A. (2019). Managing saline soils in North Dakota (SF1087). North Dakota State University Extension. https://www.ag.ndsu.edu/publications/crops/managing-saline-soils-in-north-dakota
- Halvorson, A. (1990). Management of dryland saline seeps. In K. K. Tanji (Ed.), Agricultural salinity assessment and management (pp. 372–392). ASCE Manuals and Reports on Engineering Practice No. 71. American Society of Civil Engineers.