| Lubricant | OM (%) | Nitrate-N (ppm) | P (ppm) | K (ppm) | Fe (ppm) | Mn (ppm) | Zn (ppm) | Cu (ppm) |
|---|---|---|---|---|---|---|---|---|
| No lubricant | 1.67 | 1.4 | 14 | 249 | 11.4 | 1.5 | 0.8 | 1.7 |
| WD-40 | 1.59 | 1.3 | 16 | 248 | 13.2 | 1.8 | 1.0 | 2.0 |
| PAM | 1.66 | 2.1 | 16 | 263 | 13.5 | 3.8 | 1.1 | 2.3 |
| Dove Soap | 1.67 | 2.6 | 14 | 280 | 10.1 | 1.3 | 0.7 | 1.2 |
| Motor oil | 1.63 | 1.6 | 16 | 265 | 12.5 | 1.4 | 0.9 | 2.0 |
| Silicone | 1.62 | 1.3 | 16 | 246 | 9.9 | 1.3 | 0.6 | 1.0 |
| LSD 5% | NS | NS | NS | NS | 0.7 | 0.8 | 0.2 | 0.3 |
12.1 Importance of Soil Sampling
Soil testing measures the relative plant available nutrient status of soils and serves as a foundation for profitable and environmentally responsible crop mineral nutrient application. The accuracy of a soil test value is influenced by quality control of the laboratory analyzing the sample , but even more so by the overall quality of the soil sample. To ensure good sample quality, proper sample collection is imperative to the accuracy (and repeatability) of a soil test, along with proper handling of the sample following field collection. A soil sample that does not accurately represent the current nutrient status of the field it was collected from may result in over- or under-application of fertilizer. Therefore, collecting and handling soil samples must be done properly to ensure accurate data that can be used to make good management decisions.
12.2 Soil Sample Collection Timing
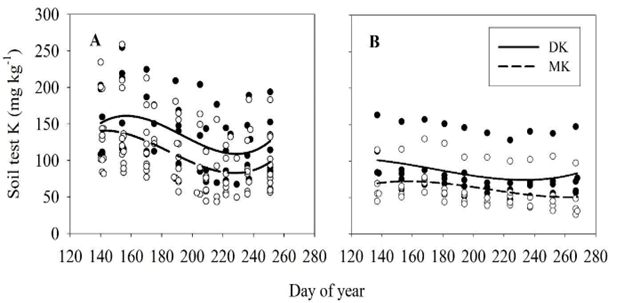
Soil samples used to analyze the soil pH, or the zinc (Zn) and phosphorus (P) content, tend to be stable during the sampling year; which in North Dakota is usually from March through November. Potassium (K) values are cyclic through the growing season (Figure 12.1) with the highest K values in the early spring, and the lowest K values in mid- to late-summer during dry soil conditions. With many growers and landowners wishing to track the trend of soil tests over the years, it is important that the soil samples used for K analysis are collected at the same time each year. Soil EC (electrical conductivity), a measure of soluble salt content, also varies during the sampling season with its value closely tied to rainfall and evapotranspiration.
Twenty years ago, NDSU recommendations included a ‘sampling date adjustment’ for sampling fields before September 15. However, close inspection of data generated in North Dakota by sampling the same site from spring through fall and then again the following spring found that sites sampled after small grain harvest sometimes increased in nitrate-N, sometimes decreased in nitrate-N and sometimes stayed the same. Therefore, the sampling date adjustment is not predictive, and no sampling date adjustment has been included in NDSU fertilizer N recommendations since around 2005.
Based on this the current guidelines on timing when soil sampling for nitrate in North Dakota is to take the soil sample immediately after any grain harvest. Sampling behind the combine is important because the earlier the date of sampling the earlier the results and this allows those soil test results to be used that year for fall N applications. Sampling early, right behind the combine, in turn gives growers the ability to sample more fields while sampling conditions are favorable. Sampling earlier can also indirectly lead to a better soil core since the fields have not yet been tilled prior to sampling. Sampling before tillage also results in a much better 0-6 inch core for P, K and other nutrients and soil factors, rather than the depth being confounded by tillage ‘depth guesses.’
12.3 Depth of Soil Sampling
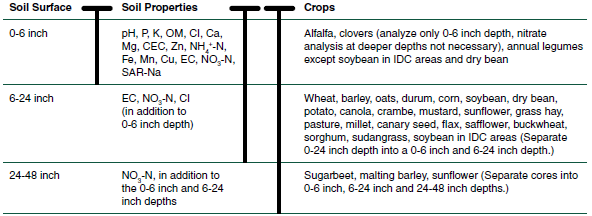
Soil sampling and analysis assumes that the top six inches of soil (0-six inch depth) in a given acre weighs 2,000,000 pounds. This weight per unit volume (bulk density) value assumes a medium soil texture with some minor compaction typically found following cropping and harvest activities. Bulk density differences can make a difference of plus or minus 10% in soil test values; however, due to the impracticality of measuring bulk density across every field, this variability is typically ignored in commercial soil sampling. Consistency in soil sampling depth and technique is critical, as differences in bulk density—especially between soil cores—can significantly impact test results. Sampling depth depends on the nutrient or soil factor of interest, the crop to be fertilized, and, in some cases, the tillage system in place at time of sampling (Figure 2). In no-till fields for suspected acidity problems, sampling at the 0-3 inch and 3-6 inch depth is highly recommended to identify stratification of pH.
12.3.1 Soil Sampling Depth for Specific Crop Mineral Nutrients
See Figure 12.2 for a visual on the following explanations. For soil pH, P, K, Zn, copper (Cu), manganese (Mn), sampling the full 0-6 inch depth is required, because that is the depth of sampling that is correlated to crop response in this region. A good consistent 0-6 inch core is best obtained from land that has not yet been tilled. If the field has been tilled to get a consistent soil core when using a hand probe outside the vehicle, take the sample in a spot where the sampler has first firmed it with their step or in the wheel track of the vehicle Otherwise, the loose soil may fall from the soil core or move out of the way of the soil core thus collecting a good full 0-6 inch core will be impossible. Instead, the core might represent a 2-8 inch depth or a more random depth of soil depending on the consistency of the loose soil.
For soil nitrate-N and chloride, a 0-2 foot core is required. It would also be instructive if instead of a 0-2 foot core, the core was divided into a 0-6 inch core and a 6-24 inch core, with each core being analyzed separately. Dividing the 2-foot core into a 0-6 inch and 6-24 core will also aid in the management of excess soluble salts (EC, electrical conductivity). For sugar beet, malting barley and sunflower, a 2-4 foot soil core for soil nitrate-N testing would also help determine whether deeper soil nitrate might affect the N rate guideline or crop quality (sugar concentration, grain protein and seed oil, respectively). A 2-4 foot core is strongly encouraged in fields new to sugar beet, however fields currently in sugar beet rotation, that have been properly managed for many years typically have a deeper soil nitrate-N level no greater than 30 pounds N per acre (the average or assumed amount to be present in most years at the 2-4 foot depth). Therefore In these well managed fields with a long history of sugar beet production, no sampling is typically done deeper than 2 feet. For malting barley and sunflower, improved grain/seed quality and N recommendation management would benefit from a 2-4 foot soil core nitrate analysis; however, the areas in North Dakota where these crops are grown have many rocks, or have numerous hidden pipelines, which are often not documented. Therefore, very few growers actually sample to the 2-4 foot depth despite being agronomically superior to the 0-2 foot depth alone.
The soil test procedure around the world and specifically in North Dakota for estimating soil sulfur (S) availability to crops for use in determining a S fertilizer rate is very poor, so no soil sampling should be conducted for S. Growers should refer to fertility circulars for specific crops for information on how to approach S rates.
12.3.2 Soil Sampling Depth for Crop Type
For crops that may require supplemental N, the nitrate-N analysis is conducted on a 0-2 foot core or a 0-6 inch and 6-24 inch core. In sugar beet, the N recommendation also considers the 0-6 inch depth; if the N content of the 0-6 inch depth is less than 65 pounds N per acre, fertilizer is applied to achieve 65 pounds N per acre regardless of what is in the 6-24 inch or greater soil depths. For soybeans, sampling for soil nitrate is not common; however, in areas of eastern North Dakota where iron deficiency chlorosis (IDC) is common, sampling for soil nitrate may help in the management of fields due to the effect that residual soil nitrate has on IDC severity.
12.4 Soil Sampling Considerations for Different Tillage Systems
12.4.1 Soil sampling for conventional tillage and conservation tillage
In conventional till and conservation till fields— where over 30% of the surface remains covered with residue after planting but results in tillage deeper than 3 inches— the 0-6 inch, 6-24 inch, 0-2 foot and 2-4 foot soil depths may all be appropriate. However, in no-till/strip-till systems, surface or near-surface application of fertilizer results in stratification of nutrients over time, especially P and K. The soil pH may decrease and become very acidic near the soil surface due to surface applied or near-surface application of either urea or other forms of N fertilizer. This is caused by soil bacteria that transforms these ammonia-based fertilizers into nitrate, releasing acid as a byproduct (see chapter 15.4). The 0-2 inch soil depth may become so acidic that crop growth and yield are reduced due to aluminum toxicity. Therefore, in fields under no-till systems, the 0-2 inch depth should be separated and analyzed separately for soil pH, P and K in addition to the 2-6 inch depth. For other plant nutrients and soil factors in the field, a 0-6 inch depth sample should also be obtained and analyzed.
12.4.2 Soil sampling in ridge-till and where concentrated starter fertilizer-bands are present
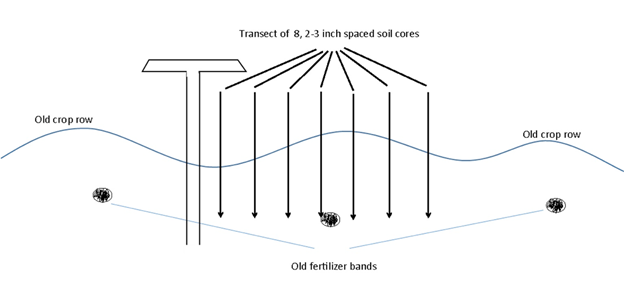
In a ridge-tillage system used by some farmers, the ridges are built by deep cultivation during the growing season and remain in the field following harvest and through winter. At planting, the top of the ridge is removed, exposing moist soil for seeding, and soil from the top of the ridge is moved into the row middles. Starter fertilizer is commonly used at planting in North Dakota in these systems and sometimes deep-placed fertilizer is applied directly under the ridge-top in the fall. Ridge-till should be sampled 0-6 inches to either side of the ridge and straight down into the ridge (Figure 12.3).
Fields with a history of band application of high rates of P and K are special problems, especially where within-field P and K levels are important. When band rates greater than 30 pounds P2O5 and/or K2O are used, there is usually a residual band effect for several years. If the bands can be located, such as the season following the first year of banding, the bands should be avoided. In most fields, however, avoidance is impossible, and one of the only good ways to sample for P and K in these fields is to sample in a transect across a row span. In North Dakota, high reproducibility of P levels has been achieved in zone sampling by obtaining 8-10 soil cores in banded fields on a transect (Figure 12.3).
12.4.3 Soil Sampling in no-till soils
As previously explained in Chapter 10, no-till management includes: - classic no-till, which has minimal residue disturbance - shallow-one-pass seeding, with disturbance of only the surface two inches or less - shank strip-till, which is disturbed in fall or spring by removing residue from a narrow band of one-quarter to one-third of the surface row area. Thus cracking the soil but not turning it in the middle of the cleared band.
In all of these no-till management systems dividing the surface 0-6 inch depth soil core into a 0-2 inch and 2-6 inch core would indicate pH stratification. The subdivision would only be necessary in soils with no free carbonate. Shank strip-till adopters frequently apply P, K and even N near the base of the shank during the strip-building process. Therefore, if the fields are shank strip-tilled, using the sampling strategy in Figure 12.3, if fertilizer has been placed at the bottom of the shank, would avoid wild differences between years.
12.5 Soil Sampling Tools
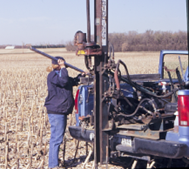
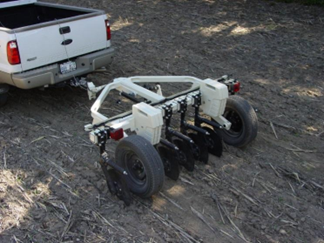
Soil is variable from side to side and with depth. A proper soil sample is obtained from a uniform volume of sampling tool from the top of the sample depth to the bottom. Neither wedge-shaped samples nor a handful of soil from the soil surface nor even a handful from the surface and one at depth will provide consistent soil sample values. The best soil sample is obtained using a soil probe (Figure 12.4). There are handheld probes and automated probes available in the commercial market. The probe should be selected that enables the user to sample at the desired soil depth. A handheld soil probe is handy to take a 0-6 inch sample, but deeper sampling may require an automatic hydraulic soil probe. Hydraulic soil probes in this region are usually installed in pickup truck cabs or on the side of the pickup truck bed on the driver side to enable the most efficient soil sample collection and handling (Figure 12.5).

In many soils, a lubricant is needed to prevent soil plugging the soil probe tube. Table 2 shows the effect of lubricants on soil analysis (Blaylock et al., 1995). For most soil nutrients, the use of lubricants, especially the most popular lubricants, does not affect soil test results. Exceptions would be Fe, Mn, Zn and Cu. If these micronutrients are of interest, a 0-6 inch core without lubricant is recommended.
12.6 Soil Sample Handling
Samples intended for nitrate-N analysis should be stored in ice chests/coolers during transport. Moist samples subjected to heat will result in N release through microbial mineralization and the soil test nitrate-N values will then artificially increase during transport and storage. Samples intended for nitrate-N analysis should be air-dried immediately after collection to prevent alteration of nitrate-N concentrations due to this microbial activity. To air dry them properly, the sample cores should be gently broken apart and spread onto a clean drying tray or clean paper in a dust-free area. Another procedure would be to transport the soil samples directly to the soil testing laboratory in an ice chest/cooler, where the drying and subsequent soil preparations will be conducted immediately after documentation. The laboratory may impose a drying fee on samples submitted in a moist condition. Soil samples intended for chloride analysis should be collected using rubber gloves by the sampler to avoid body-salt contamination. Samples intended for Zn analysis should not come into contact with any galvanized surface, including the soil sampling tool, a bucket, drying container or grinder, as this too can artificially inflate the results.
12.7 Soil Sample Collection: Where and How
Where to collect soil samples from a field and how many samples are required depend on the end goal of the data being collected. Advancements in soil science and agricultural engineering have resulted in the ability not only to identify the spatial variability of soil properties and available plant nutrients in soil but these advancements have also given us the ability to use the information to increase crop yield and reallocate inputs to maximize efficiency and minimize negative environmental impact.
12.7.1 Soil Sampling for Central Tendency
In North Dakota, many fields were sampled in the past, and some still are, as whole fields using a composite sample approach. In the composite approach 20-30 soil cores are collected in ‘representative areas’ of the field, excluding any odd soils. The composite cores were mixed thoroughly, and then a subsample was taken from the mix and sent to the laboratory for analysis, resulting in one soil test value per nutrient analyzed, which represented most of the field. This approach was appropriate for a time before the ability to manage a field site-specifically, and to fertilize in an era of stable crop prices and low fertilizer costs. All of those assumptions have changed over the past 20 years and growers now have the ability to site-specifically manage fertilizer within fields, and both crop prices and fertilizer costs are highly volatile. The usefulness then, of managing a field based on one soil test value per nutrient has greatly diminished. The composite soil sampling method tends to result in fertilizer areas with high salt and low crop productivity, does not identify potential huge pH gradients within a field, and may seriously result in over- or under-fertilization of a field depending on the distribution and range of actual soil test values present in the field.
12.7.2 Sampling for Within-Field Values
Sampling for within-field soil test values can be accomplished through either grid sampling or zone sampling. The goal of any within-field sampling is to describe adequately the patterns of similar values of plant available nutrients to facilitate practical site-specific nutrient, lime or other amendment application.
12.7.2.1 Grid Soil Sampling
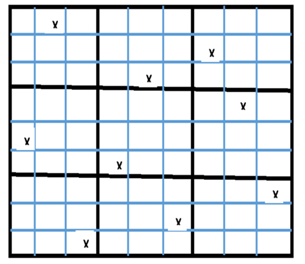
Grid sampling can accurately reveal soil test value patterns, as long as the sampling is conducted in a dense grid of 1 sample per acre (Franzen and Peck, 1995). The pattern of grid sampling should be a systematic unaligned grid as illustrated in Figure 12.6. Extensive research within North Dakota has indicated that any grid density less than this, such as one sample per 2.5 acres, is inadequate to reveal actual soil test patterns in fields. Sampling using a one-sample-per-acre grid is expensive, but is sometimes used by crop consultants when a client field is sampled the first time, to verify that an alternate sampling method is similarly revealing. Grid sampling is best conducted using the systematic unaligned grid approach. In central Corn Belt states, a 2.5-acre grid is usually recommended, because field P and K variability is mostly in the high soil test range therefore whether or not the 2.5-acre grid delineates patterns is of little practical consequence, since the recommendation within the different patterns is the same P and K rate. Contrastingly Soil test P and K values in North Dakota form patterns based on topography due to more conservative historic rates of P and K in the region compared to those in the central Corn Belt, so a 2.5-acre grid is inadequate for North Dakota grower needs (Franzen & Berglund, 1998). Grid sampling is only recommended in North Dakota in areas with large manure applications or in fields that have received large amounts of buildup P and K fertilizers.
12.7.2.2 Zone Soil Sampling
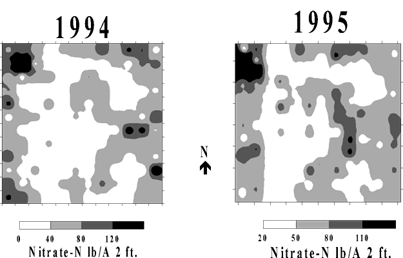
Zone sampling is based on the principle that patterns in either a field’s soil fertility or soil factors are related to some logical, more practically measured property. Zone sampling research in North Dakota began in 1995 when a field near Valley City that was sampled in a ¼ acre grid to 4 feet in depth showed similar patterns after a 1995 sunflower harvest compared to the patterns observed after spring wheat in 1994 (Figure 12.7). Similar patterns in this field were observed each year for 10 years. The nitrate-N values within a zone varied yearly, but the pattern remained the same. In all of the fields sampled from 1994-2003, totaling over 50 site-years, patterns were stable in fields between years.
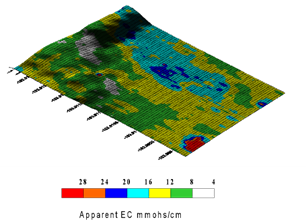
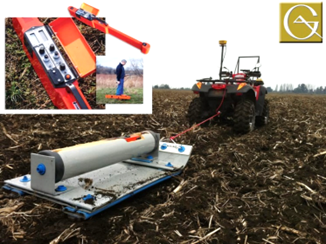
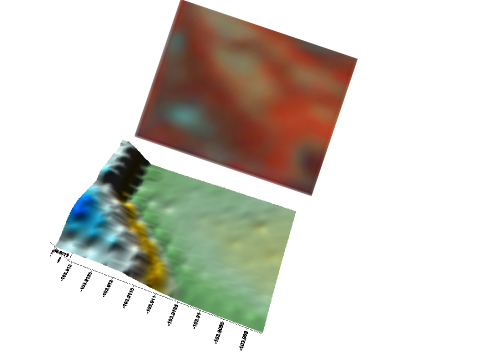
Zones should be developed using at least two tools (Franzen et al., 2011). Some tools that may be helpful in developing zones for soil sampling include aerial imagery of a growing crops canopy from either piloted aircraft or drones (unmanned aerial vehicles, or UAVs; Figure 12.8), satellite imagery of growing crops (Figure 12.9), soil electromagnetic sensors (Figure 12.10), multi-year yield maps (Figure 12.11), topography developed from sub-inch accuracy GPS elevation (Figure 12.12) such as that available with an auto-steer system soil electrical conductivity sensors (Figure 12.13 and Figure 12.14), and bare soil imagery from Farm Service Agency (FSA) photographs. Soil type maps from the NRCS through published soil surveys or through the web soil survey should not be used to develop site-specific zone maps due to the coarse nature of soil series delineation. Soil surveys are categorized as Order 2 by NRCS and only recognize features that are at least 2.5 acres in size. A soil survey would need to recognize features no larger than 1 acre in size to be useful in delineating sampling zones (Franzen et al. 2002). More zone development information is available in NDSU Extension Circulars SF 1176-2 and SF 1176-3 (Franzen 2018a, Franzen 2018b).


One sample within a zone is not appropriate to represent a soil test value for the zone. Multiple cores must be obtained (Table 12.2). Generally, 8 to10 cores should be obtained randomly within a zone for the value to be reproducible.
| Site | Mean (lb/ac) |
Number of sample cores used to estimate mean
|
||||
|---|---|---|---|---|---|---|
| 1 Core | 3 Cores | 5 Cores | 8 Cores | 10 Cores | ||
| 1 | 16 | 26 | 44 | 50 | 62 | 62 |
| 2 | 55 | 0 | 52 | 70 | 86 | 88 |
| 3 | 61 | 30 | 56 | 78 | 86 | 92 |
| 4 | 28 | 54 | 82 | 90 | 98 | 98 |
| 5 | 12 | 52 | 78 | 90 | 96 | 98 |
| Values represent the percent of composite values within ±20% of the mean. | ||||||
12.8 References for Soil Sampling
Blaylock, A. D., Bjornestad, L. R., & Lauer, J. G. (1995). Soil probe lubrication and effects on soil chemical composition. Communications in Soil Science and Plant Analysis, 26(9–10), 1687–1695. https://doi.org/10.1080/00103629509369301
Breker, J. S. (2017). Recalibration of soil potassium test for corn in North Dakota (Master’s thesis, North Dakota State University). North Dakota State University.
Franzen, D. (2018a). Soil sampling and variable-rate fertilizer application (NDSU Extension Circular SF-1176(2)). North Dakota State University. https://www.ndsu.edu/fileadmin/soils/pdfs/SF-1176-2.pdf
Franzen, D. (2018b). Yield mapping (NDSU Extension Circular SF-1176(3)). North Dakota State University. https://www.ndsu.edu/fileadmin/soils/pdfs/SF-1176-3.pdf
Franzen, D. W., & Berglund, D. (1998). Small-scale spatial variability of soil N and P and implications with regard to sample core number. In 1997 Sugarbeet Research and Extension Reports (Vol. 28, pp. 143–153). North Dakota State University Extension Service. http://www.sbreb.org/Research/soil/soil97/97p143.htm
Franzen, D. W., & Peck, T. R. (1995). Field soil sampling density for variable rate fertilization. Journal of Production Agriculture, 8(4), 568–574. https://www.ndsu.edu/fileadmin/soils/pdfs/Field_Soil_Sampling_Density.pdf
Franzen, D. W., Hopkins, D. H., Sweeney, M. D., Ulmer, M. K., & Halvorson, A. D. (2002). Evaluation of soil survey scale for zone development of site-specific nitrogen management. Agronomy Journal, 94(2), 381–389. https://www.ndsu.edu/fileadmin/soils/pdfs/Eval_of_Soil_Survey_Scale.pdf
Franzen, D. W., Long, D., Sims, A., Lamb, J., Casey, F., Staricka, J., Halvorson, M., & Hofman, V. (2011). Evaluation of methods to determine residual soil nitrate zones across the northern Great Plains of the USA. Precision Agriculture, 12(5), 594–606. https://www.ndsu.edu/fileadmin/soils/pdfs/Franzenprecag2011.pdf