| Manure Production and Nutrient Excretion by Animal Type | |||||
|---|---|---|---|---|---|
| Per 1,000 pounds of animal weight | |||||
| Animal type |
Manure Production per 1,000 lb animal weight
|
Excreted Nutrients in Manure per 1,000 lb animal weight
|
|||
| Solid (tons/year) | Liquid (gal/year) | N (lb/year) | P₂O₅ (lb/year) | K₂O (lb/year) | |
| Beef cattle | |||||
| Calf | 20 | 4,591 | 162 | 73 | 130 |
| Finishing | 9 | 2,141 | 131 | 39 | 83 |
| Cow | 17 | 3,982 | 128 | 66 | 106 |
| Dairy cattle | |||||
| Calf | 15 | 3,358 | 146 | 24 | 122 |
| Heifer | 11 | 2,536 | 112 | 39 | 112 |
| Lactating | 20 | 4,876 | 263 | 135 | 146 |
| Dry cow | 9 | 2,241 | 110 | 40 | 73 |
| Veal | 5 | 1,153 | 44 | 29 | 73 |
| Swine | |||||
| Nursery | 14 | 3,358 | 292 | 146 | 146 |
| Finishing | 9 | 2,168 | 219 | 73 | 97 |
| Gestating sow | 4 | 998 | 61 | 37 | 49 |
| Lactating sow | 8 | 2,025 | 165 | 107 | 127 |
| Boar | 4 | 900 | 49 | 37 | 37 |
| Poultry | |||||
| Layer | 9 | 2,068 | 316 | 97 | 146 |
| Broiler | 17 | 4,198 | 383 | 256 | 183 |
| Turkey (F) | 9 | 2,044 | 285 | 186 | 124 |
| Turkey (M) | 7 | 1,606 | 203 | 135 | 88 |
| Duck | 20 | 4,836 | 392 | 310 | 237 |
| Horse | |||||
| Pleasure | 10 | 2,394 | 66 | 22 | 22 |
| Racer | 10 | 2,446 | 110 | 55 | 84 |
| Sheep | |||||
| Feeder | 8 | 1,825 | 146 | 73 | 146 |
15.1 The Nitrogen Cycle
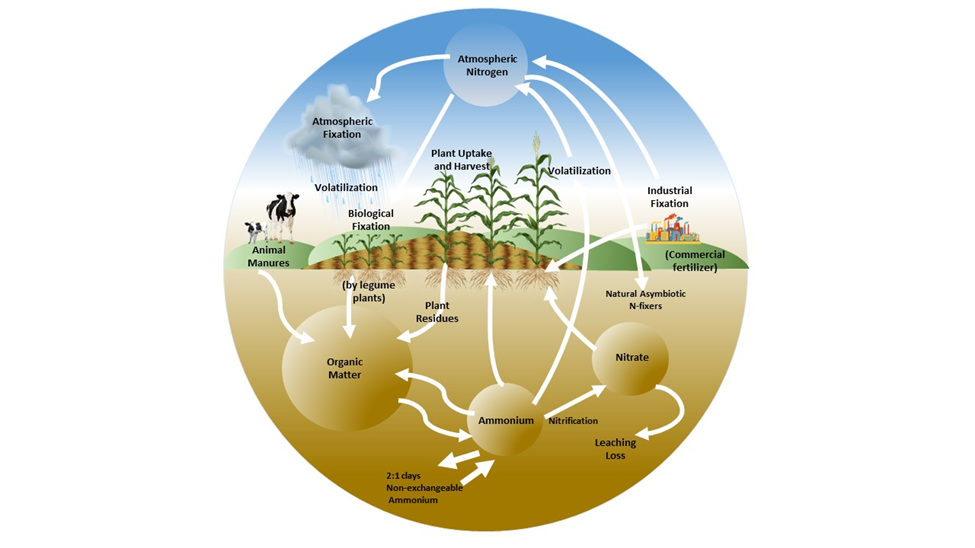
A simplified image of the Nitrogen Cycle is shown in Figure 15.1. In the following sections of this chapter, the important processes shown in this figure will be related in detail. Plant available N comes from ammonium and nitrate in soil. Legumes utilize ammonium directly through their symbiotic relationship with symbiotic N-fixing bacteria, thus they do not use N directly from the air either, although their symbiotes do. Ammonium-N comes from a variety of sources, which include animal manures, plant residue decay, natural asymbiotic N-fixers in soil, ammonium deposition from industrial sources, N-fixation due to lightning, decomposition of organic matter and the release of temporarily fixed ammonium from smectitic clays. Most commercially available N fertilizer are also ammonium-based, with the exception of the nitrate portion of ammonium nitrate in UAN N solutions. Once in the soil, a series of soil bacteria oxidize ammonium to nitrate. Nitrate can be lost from the soil system through leaching through the soil to a depth where crops cannot reach it. Under anaerobic conditions, another suite of bacteria reduces nitrate to nitrous oxides, and it escapes the soil as a gas. When urea fertilizer is applied to the soil with little rainfall afterwards, or insufficient application depth or inadequate depth of tillage, urea is broken down by the ubiquitous soil enzyme urease into its component parts of ammonia and carbon dioxide, and the ammonia can volatilize, especially in soil pH neutral to alkaline conditions. Because of the losses of N from the system, the nitrogen cycle is not a true cycle, but the term is used to describe inputs to the soil/crop system, transformations within the system and losses from the system nonetheless.
15.2 Functions of nitrogen in plants
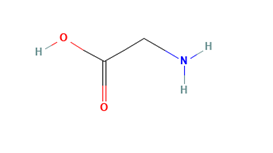
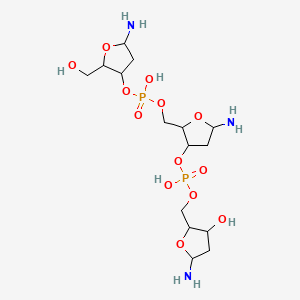
Nitrogen is essential to all plant life. Nitrogen is the key building block of all amino acids (Figure 15.1), which are the building blocks of all proteins. Nitrogen is also found in DNA and RNA. Therefore Nitrogen (N), it can be concluded is necessary for all plant functions (Figure 15.2).
Although some N can be taken into plants through the leaves, almost all is taken up by the roots. Plants are able to utilize both the nitrate (NO₃⁻) and ammonium (NH₄⁺) forms of N. A good reference to identify the many N-containing compounds in plants is Harborne (1984).
15.3 Supplement nitrogen sources
The atmosphere is made up of about 78% N₂ gas (by weight). However, this nitrogen is not in a form that can be directly used by plants, unless it is first converted to an ammonium compound by either a biological or industrial process. Before any industrial N conversion processes for ammonia production were developed, the world had to produce food using only organic N sources. The organic food industry still relies on one or more of these sources depending on the farm.
15.3.1 Organic nitrogen sources
Manure
Manure and compost can both vary widely in their nutrient content. For manure the nutrient content depends on both the source, and whether or not it is fresh or the length of its storage. For compost the nutrient content depends more on the degree of composting that has occurred. The nutrient content is especially important when considering what fraction of the nitrogen (N) is immediately plant available, or will be available later, for crop production. Given the wide range of possible N contents of different manure sources, sampling of all manure and compost, prior to or at the time of application is a good practice (Table 15.1). Spatially, even within a manure pile the N content can vary considerably e, making proper sampling technique imperative. Simply reaching into a pile and expecting to take one representative sample is a poor sampling technique, and will give you both misleading and inaccurate data. Information regarding proper manure sampling can be found at the NDSU Extension article, Solid Manure Sampling for Nutrient Management Planning (Agustin et. al., 2021).
Across all methods of manure handling and storage , some loss of N in the form of ammonia, N2 gas and nitrous oxides is expected . Table 15.2 provides estimates of spring/summer/fall manure N losses. The remaining N i (determined by manure sampling near time of application) is not immediately available for crop uptake, with most of it being tied up in organic carbon (C) compounds and will require decomposition by microorganisms in order for the N to be released. The exception being any free ammonia produced during manure storage, which has not volatilized. Estimates of N provided by manure application should be used with the understanding that actual N provided by the manure to the crops may vary considerably (Table 15.3).
Table 15.2 Estimated percent storage loss of N from various manure sources (University of Minnesota Extension, 2012).
| Manure Storage & Handling Method | Manure Type | Percent Storage N Loss, % |
|---|---|---|
| Daily scrape & haul | Solid (tons) | 25 |
| Manure pack | Solid (tons) | 30 |
| Open lot | Solid (tons) | 50 |
| Above ground tank | Liquid (gallons) | 20 |
| Below ground covered pit | Liquid (gallons) | 20 |
| Below ground open pit | Liquid (gallons) | 25 |
| Under-floor dry storage | Solid (tons) | 25 |
| Under-floor liquid storage | Liquid (gallons) | 20 |
| Earthen storage | Liquid (gallons) | 30 |
| Lagoon | Liquid (gallons) | 75 |
| Litter | Solid (tons) | 35 |
Table 15.3 Estimated N provided from application of manures to farm fields in the region applied using different methods with different times between application and incorporation (University of Minnesota Extension, 2012).
| Estimated Nitrogen Availability from Manure Applications | |||||
|---|---|---|---|---|---|
| Percent of total N available per year (University of Minnesota Extension, 2012) | |||||
| Year available |
Broadcast & incorporation time
|
Injection
|
|||
| > 96 hours | 12–96 hours | < 12 hours | Sweep | Knife | |
| Beef | |||||
| Year 1 | 25 | 45 | 60 | 60 | 50 |
| Year 2 | 25 | 25 | 25 | 25 | 25 |
| Lost | 40 | 20 | 5 | 5 | 10 |
| Dairy | |||||
| Year 1 | 20 | 40 | 55 | 55 | 50 |
| Year 2 | 25 | 25 | 25 | 25 | 25 |
| Lost | 40 | 20 | 10 | 5 | 10 |
| Swine | |||||
| Year 1 | 35 | 55 | 75 | 80 | 70 |
| Year 2 | 15 | 15 | 15 | 15 | 15 |
| Lost | 50 | 30 | 10 | 5 | 15 |
| Poultry | |||||
| Year 1 | 45 | 55 | 70 | NA | NA |
| Year 2 | 25 | 25 | 25 | NA | NA |
| Lost | 30 | 20 | 5 | NA | NA |
| NA indicates data not available. | |||||
Green manure
A green manure is a crop, typically a legume, that has a low carbon to nitrogen ratio (C:N). When the green manure crop is worked into the soil, while still actively growing, it decomposes releasing a portion of its N for use by the next crop. The disadvantage of a green manure crop is the loss of a production year in our northern climate. The green manure crop also does not act like a fallow rotation, instead removing water out of the system resulting in a higher water demand for the next crop. This leads to the subsequent crop being more reliant on any moisture from the winter/spring growing season and not on the buildup of water from the cover crop year. The portion of N in the green manure that will be available to a crop is a statistical estimate and the actual N availability is related more to soil texture and the soil moisture level the subsequent spring. A sandy soil, for example, may result in a higher loss of the cover crop N, leaving less available to the main crop.
Table 15.4 The N replacement value of a legume green manure crop (Manitoba data).
| Nitrogen Contribution from Legume Crops by Soil Type | ||
|---|---|---|
| Pounds of N per acre per 1,000 pounds of legume dry matter | ||
| Legume crop | Clay loam soil | Dry, sandy soil |
| Alfalfa | 48.0 | 2.5 |
| Red Clover | 14.0 | −33.0 |
| Chickling vetch | 28.0 | 50.0 |
| Black Lentil | 30.0 | 25.0 |
| Note: that red clover in the dry sandy soil actually took N from the soil rather than providing supplemental N. | ||
The contribution of N from legume cover can be anywhere from 0 to 50%, with averages of about 25%. A helpful resource is the organic fertilizer and cover crop calculator published by Oregon State University Extension (Andrews & Foster, n.d.).
Additional organic nitrogen fertilizers
- Blood meal (12.5-1.5-0.6). The guaranteed analysis will appear on the container.
- Bone meal (3-20-0.5). The guaranteed analysis will appear on the container.
- Fish meal (10-6-2). The guaranteed analysis will appear on the container.
- Soy meal (6.5-1.5-2.4).
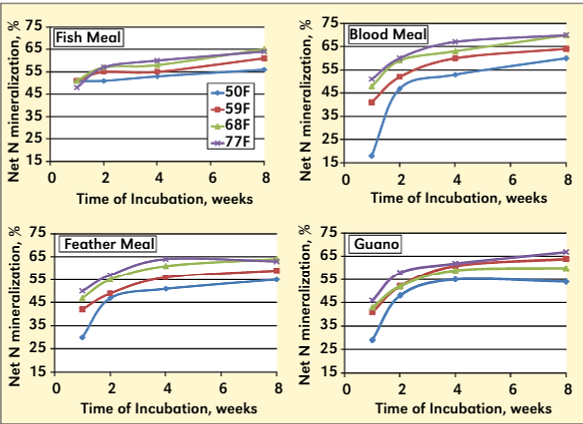
Generally, organic fertilizer amendments release about two-thirds of their N from 4 to 8 weeks after application, depending on the type of organic fertilizer, and both the soil temperature and moisture.
15.3.2 Synthetic nitrogen fertilizers
The organic system of farming was the only form of farming available until well into the 20th century. With improved farming methods, food production increased resulting in corresponding increases in the populations. These improvements brought new challenges which were addressed by Thomas Robert Malthus, an English cleric, economist and scholar, in his 1798 book An Essay on the Principle of Population, as it affects The Future Improvement of Society. The book had a far-reaching impact on British society as a whole. A good example of this being, the statement by the character Ebenezer Scrooge in Charles Dickens novel A Christmas Carol, “If they would rather die, they had better do it and decrease the surplus population.” No doubt the echoes of Malthus’s essay were behind this statement from Dickens (1843).
With the opening of the American and Canadian prairies to wheat production, the specter of mass population crash due to famine was delayed. However, in 1898, Sir William Crookes addressed the British Academy of Science in Bristol, England, and proclaimed that the scarcity of the current nitrogen supply was limiting crop production, and that without an additional source of N, the population would soon crash. The major mining source of Chilean guano was depleting, and 1920 was the predicted year that the supply would ultimately run out entirely. The solution proposed to evade this forecasted doom was to find a way to synthesize ammonia from the air. #### Anhydrous ammonia
The development of practical ammonia production, called today the Haber-Bosch Process, is detailed very well in Thomas Hager’s 2008 book, The Alchemy of Air Haber developed a process to produce ammonia, but in order to be successful it required immense pressures the likes of which were unknown in the early 1900s. Bosch worked out what it would take for the German steel industry to make the process practical, and with the support of BASF, in 1914 a single commercial plant in Oppau, Germany was constructed. The initial production of this, and other, ammonia was coupled with the production of munitions that were used by Germany during WWI. A horrific offshoot of the early ammonia fertilizer production plants was the production of poisonous gas. The use of these chemical gasses as weapons in the war was devastating, resulting in 1.3 million casualties and 90,000 deaths; their use was later outlawed after the war by the Geneva Convention. This juxtaposition of the good that the Haber-Bosch process is known for today lies in stark contrast to its early use as not just a means of producing fertilizer for crop production but also for producing weapons. The very life of Fritz Haber can be viewed as an ironic and striking example of the great as well as devastating potential scientific achievement and the scientist themselves hold. Fritz Haber’s contribution to the invention of the Haber-Bosch process has helped billions of people, even earning him the Nobel Peace Prize in Chemistry in 1919 for the Haber Process. However despite being both a German, and a Jew (although he converted to Christianity) he was also one of the chemists who perfected the hydrocyanide-based insecticides Zyklon A and Zyklon B, the latter gas used to kill millions of Jews, including some of his relatives. After WWI, the German secrets of ammonia production were sold to or stolen by other countries, and ammonia production using the Haber-Bosch process began internationally.
Anhydrous ammonia production process
The overall Haber-Bosch process is not simple, but can be rendered in its simplest chemical reaction form as:
\[ N₂ + 3H₂ ⇌ 2NH₃ \]

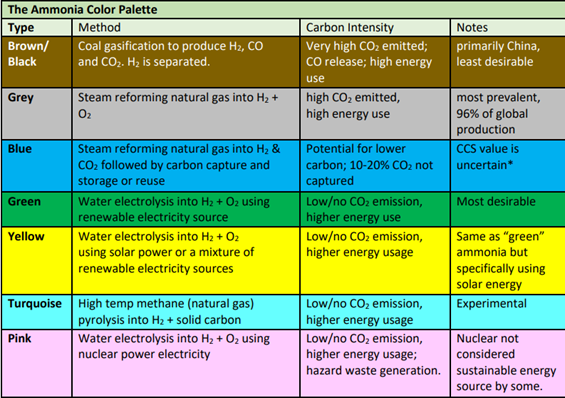
Ammonia (NH3) is always ammonia. Ammonia is colorless and can be a liquid or a gas. As a liquid, it has a density of 5.15 pounds per gallon. Due to a growing concern about, and greater sensitivity towards, carbon dioxide emissions the methods of producing anhydrous ammonia have diversified and modified to help reduce the CO2 emissions; These additional methods have been classified by the industry using a color coded system based on the intensity of their carbon emissions (Figure 15.7).
Ammonia is the chemical foundation for most of the other N fertilizers used today. In North Dakota, urea is the most used fertilizer as of 2023, with ammonia a dominating second. Urea-ammonium nitrate solutions, 28-0-0, is the 3rd most common N fertilizer in North Dakota. Use of 28-0-0 supersedes that of 32-0-0 in North Dakota, reverse of that in more southern regions, due to the cold temperatures from October through mid-April that deny the use of 32-0-0. The phosphate fertilizers used in North Dakota including MAP (monoammonium phosphate [11-52-0] ) which is the primary P fertilizer across the state, and DAP (diammonium phosphate [18-46-0]) which is used some in ND, although more in MN and SD; are also significant sources of N to crops, since triple super phosphate (0-46-0) availability is very low in the state. Another source of N is ammonium sulfate (NH₄)₂SO₄ and ammonium thiosulfate (NH₄)₂S₂O₃ , both of which are particularly useful given the r increased risk of sulfur (S) deficiency in North Dakota, specifically in corn, small grains, and especially canola production.
Anhydrous ammonia properties and handling
Ammonia is a gas under pressure and boils at -28 F. The pressure at which it is stored is directly related to the temperature in the storage container.
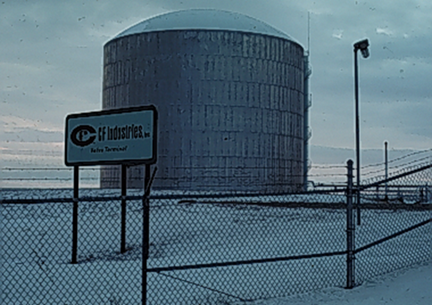
Table 15.5 Ammonia pressure inside a sealed vessel at selected temperatures.
| Temperature (°F) | Pressure (psi) |
|---|---|
| -28 | 0 |
| 0 | 30 |
| 32 | 48 |
| 50 | 75 |
| 72 | 119 |
| 90 | 166 |
| 100 | 197 |
Retail fertilizer sites that handle anhydrous ammonia have a larger storage tank, usually from 12,000 to 30,000 gallons in size. These tanks and the smaller tanks to haul to a farm field are painted white and kept in good condition, in order to keep the ammonia temperatures low. A white-painted tank may still warm more than air-temperature on a sunny day, but it will not increase in temperature as much as a dark colored tank.
Anhydrous ammonia safety concerns
Anhydrous ammonia is toxic to humans, animals, and plants if they are exposed to amounts greater than certain threshold limits. In humans, it is an irritant and is corrosive to the skin, eyes, respiratory tract and mucous membranes. In all retail facilities, a Material Safety Data Sheet (MSDS) is available that details risks of exposure, and physical properties of anhydrous ammonia, as well as list precautions and safeguards against potential exposure and harm. Equipment must be maintained in top order, as any breakage or uncoupling of hoses, pipes can release large amounts of ammonia from either the storage or transport tanks, potentially exposing the user, transporter and/or the general public to severe injury or even death. The NDSU Extension Ag-Hub maintains a site, Anhydrous ammonia: Managing the risks, to find safety information and personal protective equipment required to handle anhydrous ammonia (Nowatzki, 2021).
Included in the suite of required PPE are protective gloves, Z87-rated safety goggles, 5 gallons of water with a serviceable water hose on each ammonia nurse tank. At the ammonia distribution facility, requirements are even more rigorous, with a large tank of water next to the ammonia fill station, and the proper use of approved goggles and gloves and additional safety equipment all being tightly regulated. The NDSU Anhydrous Ammonia Managing Risks Publication is much more detailed than the brief description of risks and prevention of injury than appears in this publication, and should be reviewed and understood by anyone handling anhydrous ammonia. Anhydrous ammonia can be used safely; however, the unexpected can always happen and a person handling it should be prepared. It is of special importance for the handler to be particularly cautious when tired, which frequently occurs during peak ammonia use periods, because it is easy to become complacent and skip a step in safe handling.
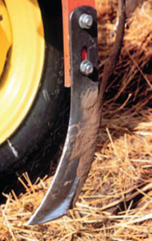
Since anhydrous ammonia boils at temperatures greater than -28 F, it cannot (and should not) ever be applied to the soil surface. Ammonia is placed only into the soil either via the flow method, applying it into the soil at a pressure just below the pressure of the tank, reduced a little due to expansion into the hoses to reach the soil, or via the “cold-flow”method, a common term referring to first allowing the ammonia to expand in a cylinder , and then reducing the pressure to less than 10 psi before applying it into the soil (Figure 15.9). Regardless if you are using the cold-flow or flow method, once the ammonia is in the soil, the ammonia continues to boil and will expand from the effective radius of its application to about 3 inches in soil that is not cloddy. Therefore it is imperative to place the anhydrous ammonia at a minimum of at least 3 inches deep. The more cloddy the soil the deeper the anhydrous ammonia application should be. Covering disks are seldom used in North Dakota; however, cover disks should be considered, especially since they are more effective in covering the trench made by the anhydrous ammonia application shank.
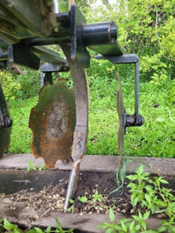
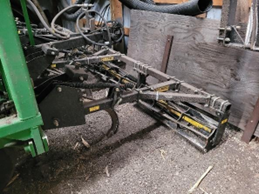
Abundant earthworms and other organisms can be seen in no-till fields with a history of anhydrous ammonia application. Although when exposed to anhydrous ammonia after injection into the soil, micro, and macro-organisms (earthworms) are killed. However, due to the anhydrous being applied in strips that are 12 to 30 inches apart, only a small percentage of the overall population of soil organisms are affected. The ammonia reacts with soil water and reacts in a ph dependent chemical equilibrium to form ammonium N, binding to the negatively charged clay cation exchange sites. The result of this influx of ammonium N in the soil ecosystem is an even more robust overall macro and micro biomass than an N starved field.
An old ‘farmer’s tale’ is that anhydrous ammonia makes the ground hard. This has never been scientifically supported. It is possible that this idea originated from a misattribution of hardness that was not a product of the anhydrous ammonia itself, but instead from too-early of an application on particularly wet soil that resulted in typical spring compaction and the soil hardness that accompanies it. There is nothing chemically possible from a reaction of soil with anhydrous ammonia that could make a soil ‘hard’.
Urea
Urea manufacture and handling
Urea is produced by combining anhydrous ammonia and carbon dioxide (Figure 15.10). A schematic of this process is provided from Chemical Engineering News.
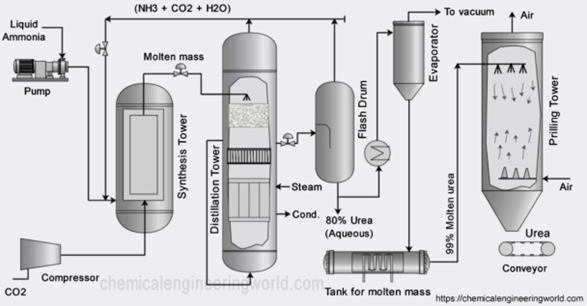
Within the process are two main reactions, the first to produce ammonium carbamate
$$
2 + ⇌ $$
Followed by decomposition of ammonium carbamate to form urea (NH₂)₂ + water H₂O.
\[ NH₂COONH₄ ⇌ H₂O + (NH₂)₂CO \]
Pressure and temperature are important in the first reaction, and temperature control is important in the second or decomposition reaction. Too high a temperature in the second reaction produces biuret, which can be harmful to plants, particularly if urea is applied as a foliar solution. Urea is an easily handled product, unlike anhydrous ammonia. Although anhydrous ammonia has the highest N content of any fertilizer (82%, 82-0-0), the equipment it requires for handling is expensive, specialized, and requires constant maintenance. Urea in its prilled form, mixes well with granular phosphate and potassium fertilizer, and even some other N fertilizers. However, as a dry blend it is incompatible with ammonium nitrate producing a liquid when mixed in the presence of humidity. Urea can also be made into a liquid fertilizer with the addition of water, with a final chemical analysis of up to 21-0-0. The resulting urea solution does not produce leaf burn as a urea/ammonium nitrate solution will, provided that the urea is very low or absent in biuret. Urea is stored in bins at retail fertilizer locations and can even be stored in farm buildings if sufficiently removed from moisture. It is hauled in semi-trailers and smaller trucks, and hauled into fertilizer locations using railcars, where it is transferred to dry fertilizer applicators and seeders using conveyors or augers. The density of urea is less than either phosphate or potassium fertilizers, so application using spinner spreaders is not practical because denser granules travel farther than urea. The density of urea is 48-50 pounds per cubic foot, compared to 60-65 pounds per cubic foot for MAP(monoammonium phosphate).
Urea application
Urea can be surface applied and incorporated, placed with a seeder with or near the seed, as long as attention is paid to rate limits, or surface applied unincorporated. For side dress and top dress applications it can be, applied over the top of crops after emergence, applied between rows on the surface, or with a side-dress knife beneath the soil between rows. Ammonia volatilization can be an agronomic hazard when applied at the soil surface or within a couple inches of the surface. Ammonia volatilization will be addressed in another section of this publication, but to briefly summarize it here: urea can be broken into its component parts of ammonia and carbon dioxide by the activity of the enzyme urease. Urease enzyme comes from plants and bacteria, but due to aresistance to decomposition, the urease remains active in the soil even when the plant/bacteria that originally produced it has decomposed beyond recognition. Urease activity increases as pH increases greater than seven and with increase in surface plant residue. Any ammonium-N released by the urea is not completely protected from ammonia volatilization loss unless it is applied below two inches in depth.

Table 15.6 Loss of ammonia from placement at different depths (From Rochette et al., 2014, J. Env. Qual.).
| Period (weeks) | Surface (% loss) | 1 inch (% loss) | 2 inch (% loss) | 3 inch (% loss) |
|---|---|---|---|---|
| 0-1 week | 2.2 | 18.4 | 2.6 | 0.0 |
| 1-2 weeks | 29.5 | 15.2 | 3.2 | 0.1 |
| 2-3 weeks | 15.2 | 3.8 | 1.8 | 0.5 |
| 3-4 weeks | 3.4 | 1.0 | 1.0 | 0.0 |
| Total | 50.3 | 38.4 | 8.6 | 0.4 |
Ammonium nitrate
Ammonium nitrate is produced by a reaction of ammonia and nitric acid. Use of ammonium nitrate in North Dakota declined greatly after its use by domestic and foreign terrorists in deadly bombings within the United States. In addition, the list of deadly accidents not associated with deliberate criminal acts is very long, and Ammonium nitrate fertilizer has been banned in several countries. The main use of ammonium nitrate as a fertilizer in North Dakota is as a component of urea-ammonium nitrate solutions.
Urea-ammonium nitrate solutions (UAN)
Manufacture of urea-ammonium nitrate solutions begins with anhydrous ammonia to produce urea, and in a separate stream producing nitric acid, and subsequently reacting the nitric acid with the ammonia to produce ammonium nitrate. This mix is then combined in a heated solution of urea with a heated solution of ammonium nitrate to produce UAN. A UAN solution can be formulated and stored as 32-0-0 in climates where the storage temperatures do not dip below 32oF in the tank. As a UAN solution of 28-0-0 it has a salt-out temperature of 0oF, resulting in some potential crystallization of 28-0-0 in North Dakota. Large tanks (>100,000 gallon capacity) with greater mass of storage have fewer issues compared with smaller tanks when storing UAN solutions over winter. Recirculation of the material, if there is sufficient liquid, once the tank contents warm will re-dissolve crystallized urea-ammonium nitrate. Fall applied UAN is not a reasonable practice since about one-quarter of the N in an application is already in the nitrate form, and any good fall applied N strategy should minimize nitrate going into freeze-up due to its leaching potential. Spring broadcast UAN application is an option, and UAN makes a particularly good carrier for preplant incorporated herbicide application. However, broadcast UAN left on the surface is more susceptible to ammonia volatilization compared to urea. Stream-bar UAN is a preferred method of topdressing winter and spring small grains. In theory a concentrated UAN surface band would be less prone to ammonia volatilization than surface broadcast UAN, but in practice for reasons currently identified, little difference between the two has been observed. Coulter-applied UAN is also an excellent side-dress method for corn and other row-crops especially in high clay soils due to lack of N loss in wet conditions that might leave the application slot open. Although side-dressing with anhydrous ammonia is a good option in soils that seal the application slot; however, the slot in high clay soils is often wet and does not close readily, making UAN superior to anhydrous ammonia in these soils.
Ammonium sulfate
The main world-wide method of manufacturing ammonium sulfate (NH4)2SO4 is through direct reaction of anhydrous ammonia and concentrated sulfuric acid: \[ 2NH₃ + H₂SO₄ → (NH₄)₂SO₄ \] as a coke-oven ammonia byproduct in the steel manufacturing process, and as a by-product of caprolactam ((CH₂)₅COHN) production within the nylon manufacturing process. In the basic process, a mix of ammonia gas and water vapor is introduced into a reactor of a saturated solution mixture of ammonium sulfate and 2-4% sulfuric acid at 140oF. As additional ammonium sulfate is produced, sulfuric acid is then continuously added. The heat generated by the reaction evaporates the water present and results in dry, powder ammonium sulfate, which is then re-solubilized, circulated while it thickens, and then crystallized gradually with the crystals removed using a centrifuge. In North Dakota, the Dakota Gasification Company at Beulah, ND captures both ammonia and sulfuric acid from gasification of lignite and uses them to produce ammonium sulfate. Ammonium sulfate is seldom used to supply all the N to a crop due to cost per pound of N, and also because of its greater acidification potential compared to other ammonium fertilizer sources. Ammonium sulfate is, however, used as a preferred sulfur (S) source for crops across the state, particularly canola, corn, and small grains.
Despite many years of research and many scientific and technological advantages, precision nitrogen (N) management for crop production continues to be a difficult challenge producers face today. This is mostly due to both the unpredictable biological transformations that N fertilizers undertake when they are applied to soil, and the uncertainties of weather (Cabrera et al., 2008). Most N fertilizers, used by producers today, are based on ammonia/ammonium. Ammonium (NH4+) is retained by the soil and adsorbed onto the CEC exchange sites of the soil’s clay particles. As long as it persists in its NH4+ form it can stay adsorbed to the clay surface (Kissel et al., 2008).
Through the activities of specific soil bacteria (Norton, 2008), NH₄⁺ is oxidized into nitrate (NO₃⁻). This nitrate, and all nitrate forms of fertilizer, can be leached by excess rainfall (Randall et al., 2008a) or lost to the atmosphere as a gas after it undergoes bacterial denitrification (Coyne, 2008). The ultimate fate of nitrate depends on the water content of the soil and its movement down through the soil profile. Generally in North Dakota soils, there is very little retention of nitrate except in the driest of years, due to either leaching or gaseous loss from denitrification . Nitrogen fertilizer in the form of urea can also volatilize as ammonia gas into the atmosphere. This form of N loss is caused by the enzyme urease. Urease is found in all soil and plant residues (Kissel et al., 2008). Due to the nitrogen loss pathways discussed above, along with other biological processes, nitrogen fertilizer use efficiency is generally low.
Nitrogen is commonly applied to soils in North Dakota prior to planting. This means that the majority of N used by the crop may not be taken up for several weeks, sometimes even months, after the preplant N application. For example, in corn during the first four to six weeks after planting, only about five percent of its total seasonal N is taken up by the crop. It is not until seven to nine weeks after planting, as the corn passes the V6 growth stage, that it rapidly increases, with most of the total seasonal N requirement taken up by tasselling (Bender et al., 2013).
Another example of a delayed N uptake pattern is winter wheat, which requires very low amounts of plant-available N for overwintering. Once the wheat breaks dormancy in the spring, a large proportion of the total N requirement for the crop will be rapidly taken up over the next month. To address some of the delayed N requirement issues of winter wheat, some producers top-dress N in the spring. Spring wheat only needs a small amount of N during the first two to four weeks after seeding to get established; most of the remaining N requirement is taken up within the next 30 days, with the rate of N uptake decreasing after anthesis. In the Northern Plains specifically, post-N applications are sometimes made in spring wheat for yield. However, due to the innate variability of the rainfall patterns during the growing season that predominates across North Dakota, postemergence N applications to spring wheat as a primary source of the major plant N requirement are discouraged in the state (Franzen, 2009), with the exception being irrigated wheat. In corn, some growers choose to use side-dress applications to avoid losses during the historically wet periods of late April through mid-June in high clay soils and sandy soils; however, spring preplant application is by far more common. Late fall application is used by some growers in the northern and midwestern states.
In order to increase nitrogen use efficiency, either crop yields must be increased or nitrogen application rates reduced. To this end a number of products have been developed to slow the biochemical and microbial processes that N undergoes in the soil, which can lead to losses through leaching, ammonia volatilization or nitrous oxide loss from denitrification. The goal behind using these products is to ensure that the N remains in the soil and is available to the crop during the periods of peak growth and demand. These products can be classified into the following groups: nitrification inhibitors, urease inhibitors and slow-release N products.
Step 1: (Nitrosomonas sp aerobic bacteria)
\[
\text{NH₄⁺} + 1\frac{1}{2}\text{O₂} \rightarrow \text{NO₂⁻} + \text{H₂O} + 2\text{H⁺}
\]
Step 2: (Nitrobacter sp aerobic bacteria)
\[
\text{NO₂⁻} + \frac{1}{2}\text{O₂} \rightarrow \text{NO₃⁻}
\]
In order for the nitrifying bacteria to convert the ammonium (NH₄⁺) into nitrate (NO₃⁻) they need oxygen and temperatures to be above 32F. Because it is an anaerobic process, nitrification does not occur in saturated or poorly drained soils. The whole process is most efficient in moist, well aerated soil conditions, and in a soil pH range between 6.5 and 8; with the conversion rate peaking at temperatures near 75F.
Nitrification inhibitors can be used to slow the nitrification process. It is imperative that these inhibitors target the first stage of the nitrification process, and the specific enzyme pathway of the bacteria involved in that step. If the inhibitors target the second stage of the nitrification process it would result in accumulation of excess levels of nitrite, which is toxic to plants. Nitrification control is generally through inhibition of a specific enzyme pathway in bacteria involved in step one of nitrification. It is important to understand that the bacteria that are part of nitrification occur ubiquitously in all soils. Therefore, nitrification inhibitors cannot stop the nitrification process completely, instead they can only slow the process, reducing the rate at which ammonium is transformed into nitrate; thus reducing the portion of N that could be lost to leaching denitrification.
Whether or not to use nitrification inhibitors depends on the N source, application timing, depth and uniformity of soil incorporation, soil texture, and the crop being grown. The following sections compile various study results to provide a better scope of the possible effects of or possible use cases for a nitrification inhibitor.
Nitrapyrin
Nitrapyrin (2-chloro-6-[trichloromethyl] pyridine) is one of the oldest and most studied nitrification inhibitors;having been used commercially since the late 1960s (Figure 15.12).The mode of action of nitrapyrin as targeting Nitrosomonas bacteria is supported by its Environmental Protection Agency-issued U.S. federal label. When Nitrapyrin is applied with anhydrous ammonia it can result in less N lost to leaching, however its effectiveness is dependent on the ratio of applied Nitrapyrin to anhydrous ammonia (Jansen, 1969; Hergert & Wiese, 1980). When the Nitrapyrin and anhydrous are applied by late October/early November differences in recoverable N can be seen as late as April (approx 190 days after application), June (230 days) and sometimes as late as July (280 days post application), with the differences decreasing over time.
![Figure 15.12 Nitrapyrin chemical structure: (2-chloro-6-[trichloromethyl] pyridine. Gray spheres = carbon; light blue = hydrogen; green = chlorine; cyan = nitrogen).(National Center for Biotechnology Information, n.d.)](Pics_and_Figs/Chp_15_figs/12.png)
N-Serve®
N-Serve® (DowAgroSciences LLC, Indianapolis, Ind.) is a specific formulation of nitrapyrin. It should be incorporated (or injected) immediately when applied with anhydrous ammonia. If left on the soil surface the nitrapyrin will rapidly volatilize. Initial studies conducted in Illinois in the mid 1970s showed that N-serve did reduce nitrification losses of both anhydrous ammonia and urea. (Figures 15.13 and 15.14) (Touchton et al., 1978a, 1978b; Touchton et al., 1979a). During the years the studies were carried out however, lower than average rainfall totals across Illinois were recorded. This resulted in N-serve having no influence on yield or overall corn N uptake (Touchton et al., 1979b; Blackmer & Sanchez 1988).
Contrastingly later studies across various states did report greater corn yield with fall-applied N-Serve (Stehouwer & Johnson, 1990); attributed to the higher residual N levels in the soil later in the season. N-serve has been shown to both increase corn yield, and higher N-use efficiency levels, when applied with anhydrous ammonia in both the fall (Randall et al., 2003) and spring (Randall & Vetsch, 2005). In Minnesota a long-term study showed a 15 bushel per acre increase for fall applied N serve and a 27 bushels per acre increase for spring applied (Randall et al., 2008b).

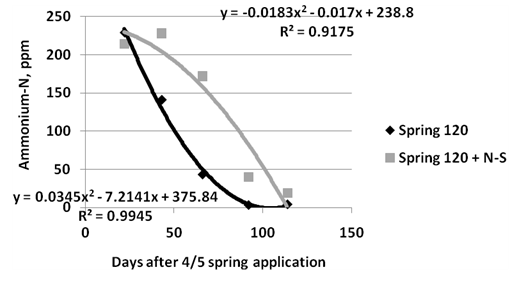
The longest duration that N-serve has been shown to increase recoverable N in the spring from a fall application with anhydrous ammonia varies by study and location; until May in a Wisconsin study (Hendrickson et al.,1978), June in a Minnesota study (Malzer, 1977), and July in a North Dakota study (Moraghan and Albus, 1979). Any reported increase in yield from applying N-serve in the fall with anhydrous ammonia, was comparable to yield increases gained from a simple split application anhydrous in the fall and spring with no inhibitor in Minnesota (Malzer et al., (1979).
One of the barriers complicating the general use of N-serve as an inhibitor is its corrosive formulation. For example, when added directly into ammonia nurse tanks, it loosens the rust inside the tanks resulting in clogged application flow screens. It is also corrosive to aluminum float gauges inside nurse tanks, and leads to gaskets deteriorating much faster than normal. Anhydrous ammonia retail suppliers and farmers who inject N-Serve directly into ammonia nurse tanks must first install stainless steel float gauges and special gaskets to keep their tanks maintained and operational, and ensure overall user safety. The use of N-Serve with anhydrous ammonia also can be metered into the ammonia flow stream on applicators. This is initially a more expensive application strategy to employ, but it avoids the problems associated with nurse tank injection highlighted previously.
Instinct®
Instinct® (DowAgroSciences LLC, Indianapolis, Ind.) is another nitrification inhibitor that has undergone years of research and commercial availability. Instinct is a microencapsulated nitrapyrin formulation that can be applied with ammonium fertilizer and, according to its label, can be left on the soil surface for up to 10-days delaying the nitrification and reducing N-losses. Research on the different formulations of Instinct over the years have shown mixed results.
For example, various studies conducted across multiple states have reported no yield increases from the use of Instinct, when compared to applying various N fertilizers alone, including one in Iowa (Barker et al., 2014), Minnesota (Randall, unpublished data), and Illinois (Fernandez, 2010). Data out of Nebraska, testing the GF-2017 formulation specifically, also showed no yield benefits when applying Instinct. In this case however, heavy rains and in-field variability may have played a potential role in these results (Ferguson et al. 2008; Ferguson et al., 2009). Despite the various studies documenting no yield benefits from applying Instinct, many others have demonstrated mixed results. Research in Wisconsin indicated Instinct increased yields, compared to applying N fertilizer alone, but this effect was not consistent. Yield increases were observed in some study years, while in others no difference was detected (Laboski, unpublished data). In Indiana, Instinct applied with UAN was found to increase the half-life of ammonium in soil in a non-drought year by between 4.5 and 6 days (Omonode and Vyn, 2013). Complicating the picture further however, a study done in Iowa (Sassman, 2014) even reported slight yield decreases when injecting or broadcasting Instinct and UAN in the spring, compared to applying UAN alone.
What explains the wide variation across the different experiments looking at the effectiveness of Instinct? The overall poor to mixed, field-performance of Instinct may, in part, be attributed to how wet conditions were in the specific year or region where the study was being conducted. Another explanation, postulated here by the author, is that overall, the poor field performance of Instinct as an nitrification inhibitor can more likely be attributed to variations in the thickness of the microencapsulation shell of the product itself. Consider this, throughout all the experiments where considerable inconsistencies regarding the effectiveness of Instinct were found, in both the laboratory and field trials, the soil types in each experiment were known, the rate of Nitrapyrin used was known, the conditions of the experiments were known, but the microencapsulation thickness of the material used in the experiments was left up to question. In the original Dow Agrosciences patent for Instinct, U.S. Patent number US20090227458 (Dow Agrosciences, 2009), it states that the actual microcapsule shell-wall varies from about 0.2 to about 15 percent of the total weight of the microcapsule, and has reported thickness within the tolerance levels anywhere from 10-125 nm. It also states that a thicker capsule cell wall, from about 75-125 nm would be more ideal for soil surface stability, i.e. a broadcast application without incorporation.
The differences in the microencapsulation of nitrapyrin, could influence the effectiveness of nitrification inhibition. Research from Indiana demonstrates this (Table 15.7), reporting that the levels of the percent inhibition of nitrification achieved by Instinct varied widely across several different soil types (Menelas, 2014). Highlighting the importance of soil properties when determining the overall efficacy of Instinct.
Table 15.7 Percent inhibition† of nitrification by Instinct formulation from Menelas (2014) in three Indiana soils.
| Percent Inhibition of Nitrification by Instinct Formulation (Menelas, 2014)1 | |||||
|---|---|---|---|---|---|
| Soil | 14 days / 54°F | 28 days / 63°F | 42 days / 72°F | 56 days / 72°F | 63 days / 72°F |
| Ade | 4.0 | 6.5 | 5.1 | 8.4 | 14.2 |
| Avonburg | 4.4 | 5.0 | 55.3 | 87.2 | 90.9 |
| Chalmers | 1.1 | 3.7 | 22.6 | 34.3 | 41.7 |
| 1 Percent inhibition of nitrification defined as: [(ammonium concentration with inhibitor – ammonium concentration without inhibitor) / (ammonium concentration with inhibitor)] × 100%. | |||||
The variation in the thickness of the microencapsulation could have multiple consequences, but principally it could result in a wide variation of release rates. In theory the microencapsulated nitrapyrin should also have an overall slower release rate compared to an unencapsulated form of nitrapyrin. The slower nitrapyrin release rate should alter the concentration of available nitrapyrin, at any one given time, which would be important when considering broadcast applications.
The patent also states that although the microencapsulated nitrapyrin release rate initially was suspected to be “too slow to provide [any] biological effect”, “in fact the opposite…is observed”. Instinct results in a “superior performance when compared to unencapsulated nitrapyrin [products], even when incorporated into the soil”. The patent presents data from several efficacy experiments comparing Instinct to N-Serve. Different treatments of Instinct ranging in the sizes of particles, and shell thickness of the micro-encapsules (all within the tolerances listed above) were shown to better inhibit nitrification compared to N-serve (N-Serve 24 formulation) in both lab and field experiments. In the lab the concentration of nitrapyrin in Instinct could be halved compared to double the concentration of N-serve and still achieve similar, or better, results even after 5 weeks. Data from field studies list that after 9-weeks of application whether incorporated or surface applied, Instinct is “more effective at nitrification inhibition than N-Serve 24” (Dow Agrosciences, 2009).
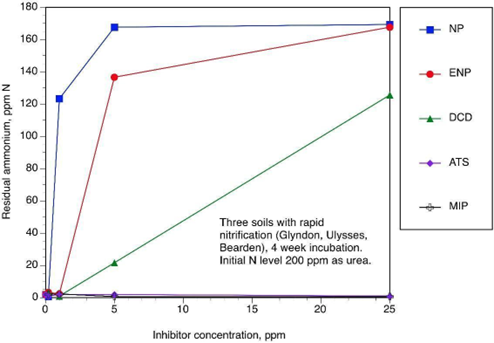
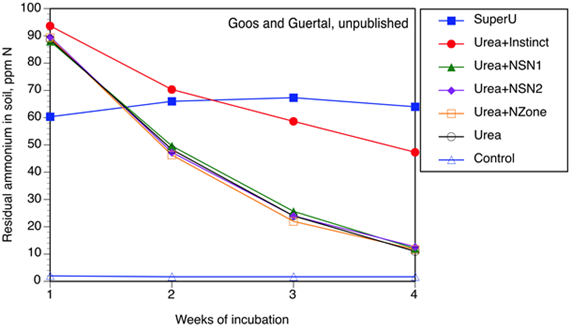
Numerous studies contradict the data and claims presented in the patent of Instinct. N-Serve applied with anhydrous ammonia performs more consistently than Instinct, due to the immediate and complete availability of the nitrapyrin at the time of application, as well as the concentration of nitrapyrin in the ammonia injection band. Several unpublished laboratory experiments by Goos at North Dakota State University (Figure 15.15) demonstrates this, showing that the slower release of nitrapyrin in Instinct, compared to N-serve, resulted in no inhibition of nitrification, when using the label rate of Instinct. In fact, it was not until five times the label rate that Instinct produced an effect comparable to N-Serve.
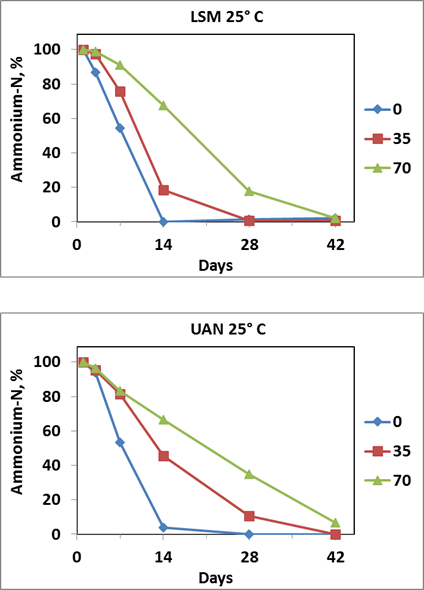
Even in studies showing that Instinct does reduce ammonium losses from both liquid UAN and Liquid swine manure (Figure 15.16), the nitrification process started almost immediately regardless of whether or not Instinct was applied (Sassman and Sawyer, 2013, unpublished data).
Because the Instinct label has no information regarding the microencapsulation thickness, except for the data within the original patent release, the user must decide whether the release rate after soil application will lead to a difference in the effectiveness of use. Regardless of the effect Instinct has on yield, or the level of nitrification inhibition and subsequent N-losses, multiple studies conducted in Indiana have shown that Instinct significantly reduced Nitrous Oxide emissions from 22 to 44% (Omonde and Vyn, 2013; Burzaco et al., 2013).
Dicyandiamide (DCD) nitrification inhibitor
Another molecule besides nitrapyrin that has been shown to act as a nitrification inhibitor is dicyandiamide (DCD or cyanoguanidine), though its effective duration is shorter than nitrapyrin (Bronson et al., 1989). The DCD molecule contains about 67 percent N and originally was considered for use as a slow-release N source early in the early 20th century (Reeves &Touchton, 1986). Initially it was reported that at rates in excess of 36 pounds an acre, resulted in crop yield loss (Cowie, 1918). Growers following current label rates of DCD products are unlikely to overapply to the point of phytotoxicity.
A review of North Central states research on DCD published in 1989 concluded that DCD was similar to nitrapyrin in its nitrification inhibition (Malzer et al.,1989). The same review also concluded that yield differences between fertilizer both treated with DCD and un-treated were inconsistent and limited to those soils and conditions where nitrate was lost through leaching or denitrification. The differences also varied by crop, with corn being largely unresponsive, and potato having a more consistent positive response (Table 15.9). The findings from this summary are reproduced in Table 15.8 (Malzer et al., 1989). Malzer et al.(1989) is reproduced in Table 15.8.
Table 15.8 Summary of corn grain yield responses to DCD and nitrapyrin at N rates equal to or less than optimum for fine-textured Midwest soils (from Malzer et al., 1989).
| Table 15.8 | ||||||
|---|---|---|---|---|---|---|
| Summary of corn grain yield responses to DCD and nitrapyrin at N rates ≤ optimum for fine-textured Midwest soils | ||||||
DCD
|
Nitrapyrin
|
|||||
| Total | With Significant Advantage | Average Response (%) | Total | With Significant Advantage | Average Response (%) | |
| Timing | ||||||
| Fall | 4 | 1 | 1.6 | 2 | 0 | −0.2 |
| Spring | 15 | 3 | 3.4 | 7 | 1 | −0.4 |
| Side-dress | 3 | 1 | 1.4 | 3 | 2 | 8.1 |
| N Source | ||||||
| Ammonium sulfate | 2 | 0 | −1.0 | 0 | 0 | NA |
| Anhydrous ammonia | 6 | 1 | 3.6 | 6 | 1 | −1.8 |
| Urea | 4 | 4 | 2.2 | 6 | 2 | 1.1 |
Table 15.9 Relative effect of dicyandiamide (DCD) used with three nitrogen sources on potato yield, % Grade A US1A tubers, and apparent N recovery in tubers at Hancock, Wis., 1984-1986. From Malzer et al., 1989.
| Table 15.9 | |||||||
|---|---|---|---|---|---|---|---|
| Relative effect of dicyandiamide (DCD) on potato yield, grade, and apparent N recovery in tubers (Hancock, WI, 1984–1986) | |||||||
| N Source | Number of Comparisons |
Number of Positive Significant Responses
|
Average Relative Response to DCD (%)
|
||||
| Yield | % Grade A | Tuber N Recovery | Yield | % Grade A | Tuber N Recovery | ||
| Ammonium nitrate | 9 | 3 | 1 | 4 | 2.0 | −3.6 | 6.5 |
| Urea–ammonium sulfate | 6 | 3 | 0 | 4 | 5.1 | −10.8 | 23.7 |
| Urea–ammonium nitrate solution | 9 | 2 | 2 | 6 | 4.0 | −5.1 | 27.6 |
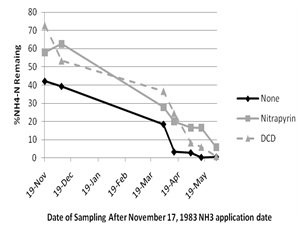
A study in Illinois reported that within 30 days of application of ammonium-N, there were differences in residual ammonium-N whether DCD, nitrapyrin, or no inhibitor were applied (Sawyer, 1985). In the spring however, the DCD and nitrapyrin treatments both resulted in higher levels of residual ammonium-N (Figure 15.17; Figure 15.18) (Sawyer, 1985). A study in Iowa (Barker et al., 2014) found no effect of SuperU on soil inorganic-N, nitrous oxide emission shortly after application, or corn yield when broadcast incorporated or not incorporated. Inconsistent results with DCD also may be due to some products containing low use rates of DCD.
Products that contain DCD in the U.S. include Super-U (IMC Phosphate Co., licensed exclusively to Agrotain International LLC) and Guardian fertilizer additive (Conklin Co. Inc.). Guardian is added to N fertilizer, and either banded and injected along with no less than 20lbs N at a rate of 3.7% or 3qts/acre , Broadcast along with no less than 40 lbs of N at a rate of 7.5% or 4-5qts/acre or applied with liquid manure knife injected around 4-5qts/acre. Super-U is a Urea N source mixed with a DCD concentration of ~0.85%, according to the current label.
Use Cases for Nitrification Inhibitors
Any conditions that increase the risk of N loss, also increase the likelihood of yield gains or other economic benefits from the use of a nitrification inhibitor. Key factors include rainfall totals and seasonal patterns, soil moisture dynamics, soil texture, and temperature. When these factors create conditions that favor nitrogen loss, nitrapyrin must still be present at sufficient concentrations to effectively inhibit the nitrification process and reduce potential losses.
Examples of these factors resulting in conditions where an inhibitor may reduce N- losses: sandier soils which more readily leach nitrate, or high-clay soils, which have higher rates of denitrification. Another documented case, where the benefits of an inhibitor, specifically N-serve, have been observed is in irrigated sands under elevated temperatures, where higher rates of evapotranspiration occur (Hergert et al., 1978). However, even if rainfall and soil moisture patterns are favorable for N loss and a nitrification inhibitor is use, the nitrapyrin (or DCD) must still be present at sufficient concentrations to effectively inhibit the nitrification process.
Aside from the potential economic or yield benefits, an under-considered benefit to the use of inhibitors is the reduction in nitrous oxide emission may result in environmental benefits, particularly for regions that are sensitive to excess emissions. The potential role nitrification inhibitors could have in reducing losses into the environment needs to be a factor when considering their use. Off target N losses can be detrimental to sensitive regions, such as a watershed, especially over periods of prolonged N use. Nitrification inhibitors could play a key role in mitigating these environmental impacts, reducing N losses of fertilizer use in agriculture via the emissions pathway, and their abatement from the agroecosystem to the environment. (Wolt, 2004).
Another use case for nitrification inhibitors that has generated considerable interest is using them in conjuction with liquid manure applications. In response to reports of poor corn growth due to injected liquid manure in Illinois, placement studies with and without nitrapyrin were conducted on similar soils. The results of one study showed that the use of nitrapyrin increased corn plant and grain N concentrations but did not translate into a yield increase (Sawyer et al., 1991). In another study, the use of nitrapyrin was useful in lowering soil nitrite levels in the liquid manure band, which was one reason why poor corn growth was observed in the banded liquid manure fields (Sawyer et al., 1990).
15.3.3 Urea, Urease, and Urease Inhibitors
Urea is the most widely used fertilizer, nitrogen or otherwise, in the north-central region of the United States. The chemical formula for urea is CO(NH₂)₂. A 3-D image of urea is displayed in Figure 15.19.
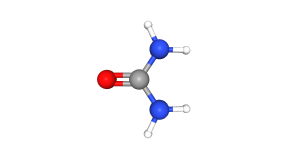
Urease is a naturally occurring enzyme that catalyzes the hydrolysis, or splitting, of Urea into its component parts: ammonia (NH₃) and carbon dioxide (CO₂); this results in a net pH increase.
\[ CO(NH₂)₂ + H₂O → NH₃ ↑ + CO₂ ↑ \]
Urease is abundantly found in virtually all plants (and plant residues), and soil microorganisms. The urease enzyme is also highly resistant to decay, and can continue to function long after the organism (i.e. plant, bacteria, fungi) it originated from is either dead or decayed; functioning as an extracellular plant/soil enzyme. Due to the widespread abundance of urease, any urea applied at the soil surface, or over the top of crop residues, will be quickly hydrolyzed.
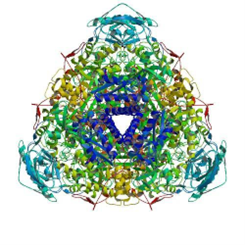
Structurally, urease is a comparatively large protein composed of multiple subunits, each containing two nickel ions (Ni²⁺) in their active site, and is one of the only nickel-requiring enzyme in plants (Joseph et al., 2022). The three-dimensional arrangement of urease is precisely configured to bind to the triangular shape and size of the urea molecule (Figure 15.20), lowering the activation energy required for urea’s hydrolysis, accelerating the rate of its conversion to NH₃ and CO₂ by as much as 10¹⁴ times (Zambelli et al., 2014).
If the urea is placed at or near the soil surface, the NH3 produced from its hydrolysis can volatilize rapidly into the air. Many factors influence the rate, and risk, of NH3 volatilization from surface-applied urea such as soil texture, surface residue, soil moisture, humidity, pH, windspeed, and ambient and soil temperatures. The length of time the urea sits on the soil surface without incorporation is one of the most prominent factors when calculating potential NH3 volatilization rates. Soils with greater crop residue at the soil surface also have much greater concentrations of the urease enzyme, and consequently exponentially high volatilization rates as well; when compared to soils with little remaining crop residue. Soils with a pH greater than 7 also have higher NH3 volatilization rates. This occurs as a result of a shift in the chemical equilibrium of NH4 to NH3 in the soil solution; as the pH increases this equilibrium shifts to the right, favoring the production of more NH₃.
\[ NH4↔ NH₃ (pKa 9.25) \]
\[ NH₄⁺ (aq)↔NH₃ (aq) + H⁺ (aq) \]
NH₃ volatilization rates increase as the soils’ cation-exchange capacity decreases. NH₃ volatilization rates also increase when the urea is applied to soil surfaces that initially have a higher water content but after application experience a period of slow drying with little to no precipitation.
NBPT (N-(n-butyl) thiophosphoric acid triamide) has been shown to be the most effective compound that reduces the risk of urea volatilization when mixed with urea or urea-ammonium nitrate solutions (Figure 15.21). NBPT originally was marketed as Agrotain (Agrotain International LLC), with the commonly used product today branded as Agrotain Ultra (Koch Agronomic Services, Wichita, Kan.). Aside from Agrotain however, the NBPT active ingredient has also been made available to other distributors and manufacturers. As such, there is a large variety of NBPT products, under several different brand names, that exist on the market today.
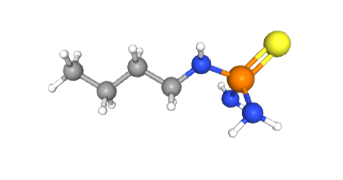
The NBPT molecule inhibits the activity of the urease enzyme by blocking its binding site, preventing it from hydrolyzing urea, regardless of the urea concentration (Manunza et al., 1999).
For growers in the northern plains, there are two potential uses for Agrotain in their crop production systems. The first is applying it in conjunction with surface applied, or near surface applied urea, in order to reduce the rate of ammonia volatilization typically for up to about 10 days after application (Table 15.10). The second is to apply it at planting, in order to reduce the risk of seed injury caused by higher rates of seed-placed urea. Although Agrotain has been shown to increase the rate of urea that can be applied safely with small-grain seed (Table 15.11), this practice is rarely recommended for growers in the northern plains, due to the unpredictability of germination times in cooler soils.
Agrotain (NBPT) has been shown to increase yields, and decrease the rate of ammonia volatilization from surface applied urea (both dry urea and urea-ammonium nitrate [UAN] solutions) (Brouder, 1996, Table 15.12; Varsa et al., 1999, Table 15.13. In Brandon, Manitoba Agrotain reduced recorded ammonia volatilization losses of surface applied urea by as much as 95% (Grant, 2004 Table 15.11).
Table 15.10 Cumulative ammonia volatilization losses of urea, ammonium sulfate and urea + NBPT from a Dewitt silt loam soil during a 15-day laboratory incubation at 25 C. Norman data, University of Arkansas, Fayetteville, from Franzen et al., 2011.
| Cumulative NH₃ Loss After N Application | ||||
|---|---|---|---|---|
| % of N applied | ||||
| N Source | DAY 3 | DAY 7 | DAY 11 | DAY 15 |
| Urea | 14.500 | 35.9 | 51.8 | 56.9 |
| Ammonium sulfate | 0.100 | 0.2 | 0.5 | 0.6 |
| Urea + NBPT | 0.006 | 2.7 | 12.9 | 18.3 |
| Urea + Nutrisphere (0.25%) | 17.600 | 42.2 | 57.8 | 62.7 |
| NBPT = N-(n-butyl) thiophosphoric triamide | ||||
| LSD(0.05) among N sources within a sampling time = 12.2 | ||||
| LSD(0.05) among sampling times within N source = 9.6 | ||||
Table 15.11 Effect of seed-placed urea with and without Agrotain on stand density and grain yield of barley on a fine sandy loam soil, 1994-96. From Grant, 2004.
| Effect of N Rate and Agrotain on Stand and Yield | ||||
|---|---|---|---|---|
| N rate (lb/ac) | Stand (No Agrotain) | Stand (Agrotain) | Yield (No Agrotain) | Yield (Agrotain) |
| 0 | 7.6 | 7.6 | 50 | 50 |
| 18 | 7.9 | 8.2 | 55 | 52 |
| 36 | 7.3 | 7.7 | 53 | 62 |
| 54 | 6.0 | 7.1 | 59 | 57 |
| 72 | 5.7 | 7.1 | 63 | 61 |
| 89 | 4.7 | 7.1 | 57 | 65 |
Table 15.12 Mean corn yield from Purdue Agronomy Farm, SEPAC, Pinney, Purdue and Kosciusko locations, with urea and UAN alone and treated with NBPT. From Brouder, 1996, citing work by Phillips, Mengel and Walker, 1989, unpublished work, Purdue University.
| Fertilizer Treatment | Yield (bu/acre) |
|---|---|
| Control (20 lb. N/acre in starter only) | 99 |
| Urea broadcast, surface | 130 |
| Urea + NBPT broadcast, surface | 143 |
| UAN broadcast, surface | 135 |
| UAN + NBPT broadcast, surface | 140 |
| UAN dribbled, surface | 139 |
| UAN spoke injected | 142 |
| UAN coulter injected | 147 |
| UAN knife injected | 145 |
In Kansas Agrotain increased reported yields from surface applied urea by 25 bushels an acre (Weber and Mengel, 2009). The same studies that noted a yield increase however, also documented no yield benefit when significant rain events occurred immediately after urea + Agrotain was applied on the soil surface. Consistent with this, 11 and 12 bushel per acre increases in sorghum have been noted when Agrotain or SuperU, respectively, were used, compared with urea alone. The same studies also reported no yield differences in drier locations. (Weber et al., 2009a).
In Illinois, when Agrotain was applied and incorporated with the urea in a conventional-till system it resulted in a 3-bushel yield increase compared to broadcast and incorporated urea. This yield difference increased up to 11 bushels/acre when the urea and urea + Agrotain were surface applied in a no-till system (Ebelhar et al., 2010).
In Kentucky, (Schwab and Murdock, 2009) Agrotain and Agrotain Plus (a combination of NBPT and DCD formulated specifically for use with UAN) resulted in increased yields from the side-dress applications of both Urea and UAN (Table 15.14). A key finding from this particular study reinforces the principle that urease inhibitors are effective in limiting but not eliminating ammonia volatilization. For example, although yield increases were observed when the urease inhibitors were applied along with the urea, these gains still did not equal the yield achieved with the application of ammonium nitrate alone (ammonium nitrate has inherently lower to negligible ammonia volatilization losses). Consequently, any grower practices that can physically reduce the risk of N losses from ammonia volatilization —such as placing urea or UAN below the soil surface— can offer far greater potential for maximizing their yields compared to simply adding a urease inhibitor to surface applied urea.
Table 15.14 Yield for side-dressed no-till corn in Hardin County, Ky. (Schwab and Murdock, 2009).
| Treatment | Yield (bu/acre) |
|---|---|
| Check (50 lb. N/acre preplant N only) | 117 d* |
| Urea | 158 c |
| Urea + Agrotain | 201 b |
| SuperU | 201 b |
| UAN | 150 c |
| UAN + Agrotain | 179 bc |
| UAN + Agrotain Plus | 175 bc |
| Ammonium nitrate | 239 a |
Numbers followed by the same letter are not significantly different at P ≤ 0.05.
NPPT (N-(n-propyl) thiophosphoric acid triamide) has a similar mode of action as NBPT. A more recently introduced product containing both NPPT and NBPT is Limus™ (BASF Corp., Research Triangle Park, N.C.,) (Figure 15.21). Research from North Dakota has shown that Limus is at least as effective as a urease inhibitor compared to either Agrotain Ultra or technical grade NBPT (Figure 15.22).
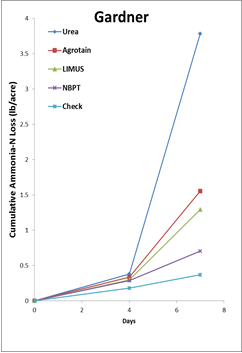
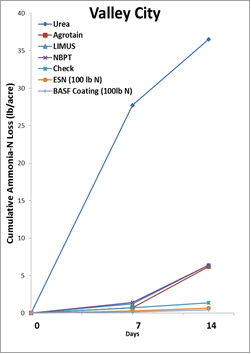
Comparison of cumulative ammonia loss during an eight-day period near Gardner, N.D., on a conventionally tilled, low-residue, neutral-pH soil, compared with 14 days near Valley City, N.D., on a high-residue, long-term, no-till field with slightly acid surface pH. Urea N rate applied was 100 pounds N per acre. Franzen 2014, unpublished data.
15.3.4 Compounds with limited abilities as both nitrification and urease inhibitors
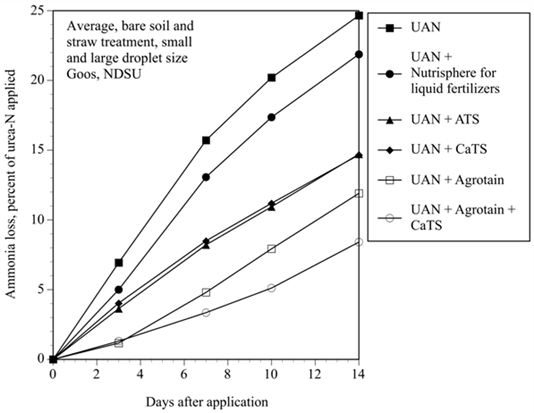
When ATS is put into solution with purified urease, no inhibition occurs. However, when ATS undergoes oxidation it reacts with Mn-oxides and forms Mn²⁺ and tetrathionate [S₄O₆]²⁻. It is this oxidation reaction and its by-products that inhibit the activity of urease. This inhibition increases when ATS is added to UAN that has been placed in a concentrated band.
Ammonium thiosulfate (ATS), along with several additional commercial thiosulfates, have all been shown to inhibit both nitrification (Goos, 1985; Janzen & Bettany, 1986) and soil urease activity (Goos, 1985) to some degree. However, the measurable nitrification inhibition of ATS can be inconsistent and highly variable (Figure 15.23). This can largely be attributable to the rapid rate at which Thiosulfate readily breaks down in warm soils. In a laboratory study at 15 C, ATS was noted to have been almost entirely mineralized in about a week. Although under cooler temperatures some amount of thiosulfate was shown to remain in the soil for up to two weeks, by three weeks it was completely mineralized (Goos 1985). Thiosulfate when banded along with fall applied aqua ammonia, results in both similar yields and spring soil residual N levels (both ammonium and nitrate), when compared to fall nitrapyrin + aqua ammonia (Goos & Johnson, 1999). Despite promising findings such as this, looking back at its history, researchers very early on in the initial process of identifying the potential use of thiosulfates as nitrification and soil urease inhibitors, noted that the compounds would most likely not perform as well as other alternative nitrification and urease inhibitors due to the comparatively shorter decomposition period for ATS (Goos, 1985).
Adding ATS to UAN has been shown to reduce ammonia volatilization from surface-applied UAN under greenhouse (Goos, 2013, Figure 15.23) and field (Grant et al., 1996, Figure 15.24) conditions. Some studies in a no-till system have resulted in no yield differences between Spring-applied UAN + ATS, and broadcast urea (Tucker and Mengel, 2007).
Although some studies have failed to show any urease inhibition from the application of ATS (McCarty et al., 1990), these same studies have also used very different rates of ATS then the studies cited above (Goos, 1985). Evidence for this conclusion is based on the fact that Thiosulfate activity is regulated by its concentration (effective at S rates of 25 mg kg⁻¹, Goos and Johnson, 2001).
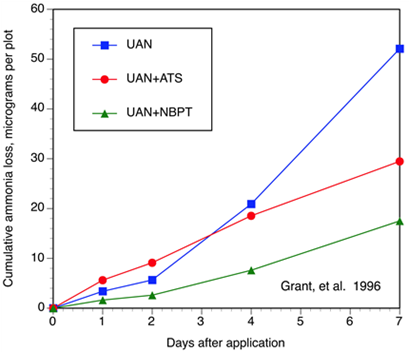
Apart from its urease inhibition, ATS also inhibits nitrification. The nitrification inhibition of ATS targets the second step of the nitrification process —conversion of nitrite to nitrate— which is normally considered instantaneous due to the presence of Mn-oxides (Bartlett et al., 2008). ATS interferes with this process thereby inhibiting the conversion of nitrite to nitrate. Evidence of this inhibition is noted in experiments where there is an observed increase of nitrites when ATS has been added. However, the degree to which ATS inhibits nitrification has been shown to be less effective compared to other nitrification inhibitors in a field setting (Goos and Johnson, 1992; Figure 15.25).
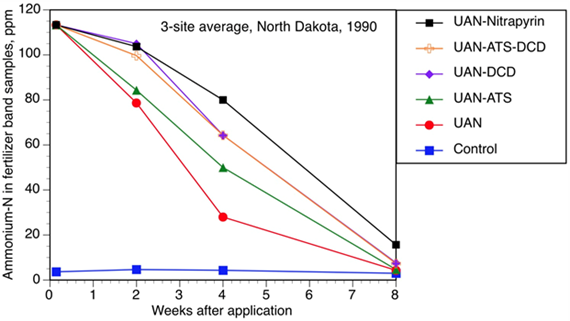
Since ATS targets the second step in the nitrification process, researchers have expressed cautions surrounding the application of high rates of banded ATS (in excess of 100 parts per million, or ppm) due to the potential for toxic nitrite accumulation that can damage the plant or seed (Janzen and Bettany 1986). However, rates of 43 ppm expressed as a band with a radius of 2 inches, have not been shown to result in significantly elevated levels of accumulated nitrites (Goos 1985).
15.3.5 Additional nitrogen transformation inhibitor products
#### Products marketed as nitrogen transformation products
All products with active ingredients that have demonstrated consistent activity as either a nitrification or urease inhibitor have been presented in the previous sections. All other products marketed, as of yet, have failed to produce consistent nitrification or urease inhibition, yield increases, or reduced N-losses and should be therefore heavily scrutinized. Products containing maleic and itaconic acid blends for example, have not performed well as either a nitrification (Figure 15.26) or urease inhibitor (Figure 15.25). Furthermore, the purported mode of action of these products is chemically and thermodynamically impossible (Franzen, 2013; Chien et al., 2014). Other products, such as the ones containing calcium heteropolysaccharide, claim to reduce N losses through leaching, but have failed to show any nitrification inhibition when applied to urea granules (Figure 15.26), nor result in any increase in yield across multiple field experiments (Chatterjee, 2015, unpublished report). Although some labels for these products claim to keep N in the ammonium form longer, careful laboratory experiments show that this claim is unsubstantiated and they do not perform as nitrification inhibitors.
Poly-coated Urea
Poly-coated urea is used to physically prevent hydrolysis of the urea molecule, therefore extending the period in which the N remains available for plant uptake. ESN™ (Environmentally Smart Nitrogen, Agrium Inc., Calgary, Alberta, Canada) is the most widely distributed and applied poly-coated urea available to crop producers in the north-central region. It does not inhibit nitrification or urease, but ample evidence suggests that its use can extend the availability of the N longer into the growing season and protects the N from nitrification or volatilization losses until the coating breaks down and the urea is released into the soil. In ESN studies in North Dakota fall-applied ESN, placed into the soil, resulted in more than half of the urea within the pellets persisting into the spring, and about one-third into late May to early June (Table 15.15). The rate of urea release from the coated pellet of ESN depends on both the temperature and soil moisture levels, with dryer weather delaying the rate of release, and moist soil conditions increasing the rate. Although the urea cannot react with the urease enzyme while encapsulated within the poly coating, it also is not available for plant uptake, only becoming plant- available when the coating breaks down and the urea is released.
Table 15.15 Urea in ESN remaining after field burial, Casselton, N.D., fall 2013. Ransom, unpublished data, North Dakota State University.
| Urea Remaining After ESN Field Burial | ||
|---|---|---|
| Casselton, ND (Fall 2013) | ||
| Sampling Date | 10/11 Burial | 10/25 Burial |
| 10/25/2013 | 89 a† | na |
| 11/08/2013 | 84 a | 96 a |
| 04/29/2014 | 55 bc | 65 b |
| 05/13/2014 | 50 c | 59 bc |
| 05/27/2014 | 37 d | 45 cd |
| 06/10/2014 | na | 38 d |
| † Values followed by the same letter are not significantly different (P < 0.05). | ||
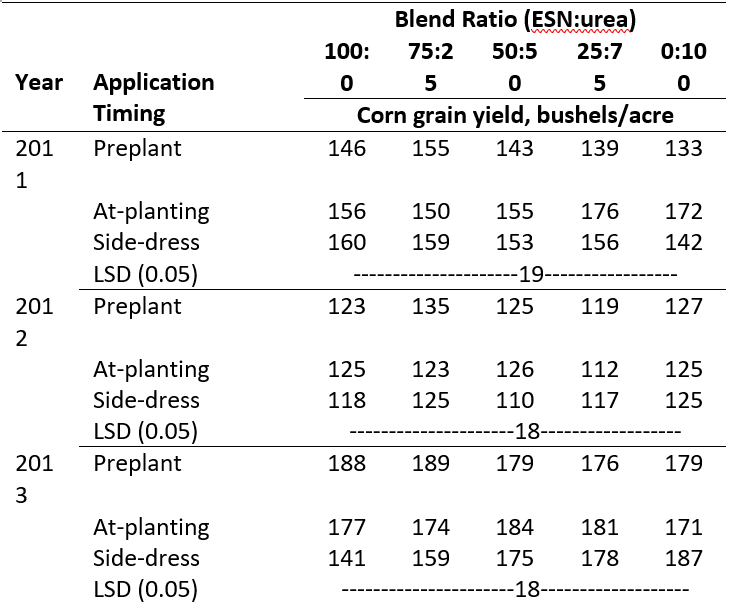
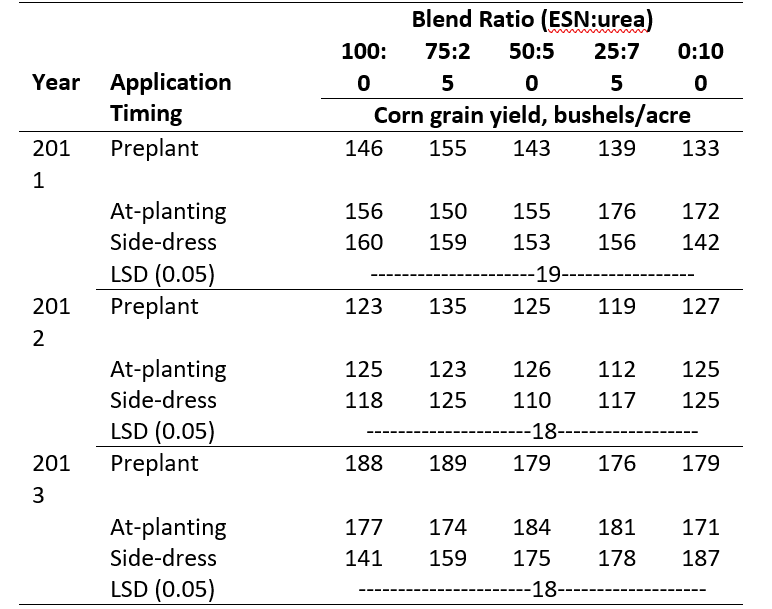
Studies in Michigan (Table 15.16), have shown few corn yield differences between multiple blending ratios of ESN and urea, across different N application times and rainfall from 2011 through 2013 (Steinke and Chomas, 2014). Although these studies did note that the ideal blend of ESN:urea shifted with different planting dates, and application timing (preplant or side dressed).
Preplant N as Instinct-treated urea or ESN has not been shown to increase yield or protein content of spring wheat in North Dakota (Ransom, unpublished data, Table 15.17). In Kansas spring applied ESN- urea blends (Table 15.18) resulted in higher yields compared to winter applied blends, but the yields were similar to spring applied N or N + inhibitors (Weber and Mengel 2009). ESN has also been shown to increase N use efficiency and grain yield compared to UAN on coarse textured irrigated soils in Nebraska (Maharjan et al, 2016).
Table 15.17 Spring wheat protein and yield at three sites in the Red River Valley of North Dakota and Minnesota as affected by source of N (ESN and urea) and Instinct, 200 lb. N/acre applied, spring, 2015. (Ransom, unpublished data, North Dakota State University).
| Spring Wheat Protein and Yield Response to N Source | ||
|---|---|---|
| Treatment | Protein (%) | Yield (bu/acre) |
| Check | 13.2 | 50.9 |
| ESN | 14.3 | 70.4 |
| Urea | 13.9 | 71.6 |
| 75% ESN : 25% Urea | 14.4 | 69.7 |
| 50% ESN : 50% Urea | 14.5 | 70.8 |
| Urea + Instinct | 14.4 | 70.1 |
| LSD (0.05): Protein = 0.7, Yield = 7.3 | ||
Table 15.18 Corn grain yield as affected by 80 lb. N/acre applied as N source, timing, method of application and additive. Manhattan, Kan. (Weber and Mengel 2009).
| Effect of N Source and Season on Grain Yield | |
|---|---|
| Treatment | Yield (bu/acre) |
| Control | 104 |
| Winter urea | 138 |
| Winter ESN | 154 |
| Spring urea | 165 |
| Spring urea + Agrotain | 169 |
| Spring urea as SuperU | 173 |
| Spring ESN | 167 |
| Spring 50% ESN : 50% Urea | 174 |
| Spring UAN broadcast | 148 |
| Spring UAN + Nutrisphere | 149 |
| Spring Coulter UAN | 162 |
| LSD (0.05) = 19 | |
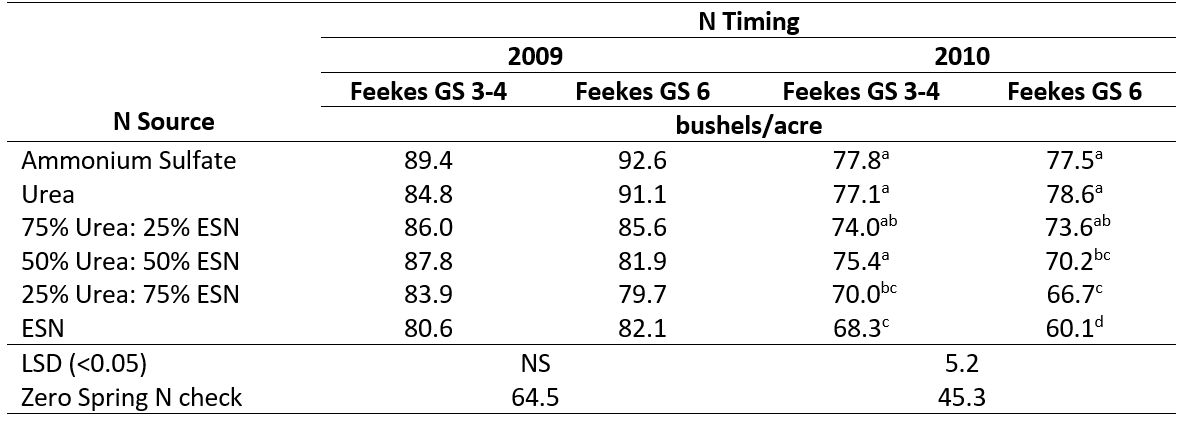
Multiple studies in Iowa found no significant increase in corn yield, n-use efficiency, or other agronomic benefits resulting from the use of ESN compared to un-coated urea, or other N additives when broadcast on the soil surface and left un-incorporated (Moore et al., 2008; Barker and Sawyer, unpublished). Interestingly, in one of these studies in particular, it was noted that ESN resulted in higher in-season (V6 and V15) soil ammonium-N concentrations, and postharvest soil nitrate-N and ammonium-N concentrations. This could potentially increase the risk of post-season nitrate loss. In cooler conditions in Ohio, ESN has actually been shown to perform worse than other N sources or blends. Although, this also supports the use case of blending the ESN with other N sources, in case the environment is unfavorable for immediate release of the urea from the polymer coating, and a more immediate source of N is needed, such as un-coated Urea (Table 15.19; Lentz, 2012).
Table 15.19
15.3.6 Summary of nitrogen additives and transformation inhibitors
Nitrapyrin and DCD are well-documented nitrification inhibitors, and NBPT and NPPT are well-documented urease inhibitors. Agronomic and environmental benefits may not be realized every year when using these products, mainly because rainfall patterns and rainfall intensity are what dictate the risks of N- losses through leaching, volatilization or denitrification.
Ammonium thiosulfate also has a measurable nitrification and urease inhibitors but is not nearly as effective as other inhibitors. Polymer-coated urea(s) is(are) best suited for conditions that result in a high probability for N-loss such as sandy or water-logged soils. The potential benefits of using N extenders and additives includes an increase in yield and/or a decrease in the optimum fertilizer N required. Before deciding whether to use an alternative N product or amendment, producers must consider the major N loss mechanisms possible for that particular soil and field. These products add additional cost to a farming operation, so producers need to weigh this cost against the potential economic losses caused by N loss. Producers need to give careful thought to selecting the product appropriate for a specific field and soil, or if any product is even needed, especially if the potential benefits do not outweigh the potential risks. In addition, when considering any product that has not been outlined here, common sense should apply. This includes: looking for data from independent field trials, preferably conducted by land-grant university researchers that can verify the effectiveness and modes of action.
15.4 Independence of nitrogen rate and crop yield
15.4.1 The problem with yield goal-based fertilizer recommendations and the move to relative yield
Historically, soil fertility specialists in the North Central States of the USA constructed N application rate recommendations based on the ‘yield goals’ (Dahnke et al., 1992; Hoeft and Peck, 2002; Warncke et al., 2004) or ‘expected yields’ (Vitosh et al., 1995) approach. The yield-based approach worked just fine for growers when in 1970, “high-yield” corn was just 80 bushels per acre in North Dakota and 150 bushels per acre in Illinois. These early N recommendations also did not consider economics, which was understandable given the grain surpluses in the US during the late 1970’s through the mid-1980’s, resulting in the narrow range of prices paid to farmers for those crops. The range of fertilizer prices from the mid 1970’s to the early 1990s was also similarly narrow. However, the severe drought years around 1988, and the above average rainfall years of the early 1990’s, that resulted in devastating small grain diseases, devastated the northern plains wheat crops, causing the surplus of grain to vanish. Around this same time, natural gas prices also rose steeply. All of this resulted in the prices for crops and for fertilizer inputs becoming much more volatile.
This volatility in grain prices made it increasingly more difficult to justify a yield-based approach for calculating N rate recommendations. The yield-based approach psychologically drove farmers to increase N rates, attributable to the formula of the models themselves, which implies that “higher N rates = greater yields”. In most studies, crop yield was not shown to be limited by N, but instead, was limited by too much or, not enough rain, and soil differences that either enhanced or decreased water and/or nutrients use efficiencies.
The increased economic volatility, combined with frustration by soil fertility specialists and researchers in the deficiencies of their existing N recommendation systems, sparked the idea of a new regional approach for creating N recommendations based on the accumulated data from multiple participating states. The factors that were to be incorporated into these new N recommendations were both crop yield responses to N rate, and the economic costs of the applications. Several states within the North Central Region now have a version of the Maximum Return to N (MRTN) concept explained by Sawyer and Nafziger (2005). Although not specifically stated, the MRTN approach contains little consideration of yield expectations. The researchers who originally researched the MRTN approach recognized that yield is not driven by N rate, but instead is driven by a multitude of other factors. Since then, more recent studies have confirmed that yield is not directly correlated to N, by examining a plethora of data across multiple long-term N-rate experiments that conclude that there is no relationship between N rate and the crop yield achieved (Raun et al., 2011; Arnall et al., 2013; Franzen et al., 2016). Wheat N rate recommendations developed by North Dakota State University have been based on the MRTN approach since 2010. Similarly, the N rate recommendation for other major crops have also been developed based on the MRTN model approach for: corn, sunflower, and two-row malting barley. During a presentation in Fargo at the annual Soil and Soil Water Workshop to regional certified crop advisors (CCA’s) in January, 2016, the question was posed by a respected consultant to extension researchers: “how could N rate recommendations for sunflower be established when the relationship between available N and yield was so poor”. This thought-provoking question led to a reexamination of a trove of data that previously had been considered to show a strong relationship between available N and sunflower yield. When the data was taken and combined across multiple locations, and analyzed as a whole this relationship was slightly significant. However, the relationship between yield and N-rate was more related statistically when the data was parsed out and analyzed at each individual site.
In the summer of 2016, a large-scale project was incepted to determine whether recognizing, and accounting for, the independence of N rate and crop yield at every site, as well as normalizing the relative crop yields within each given site, would reveal stronger correlation between overall N rate and relative yield.
The data that was examined as part of this undertaking consisted of a conglomerate of over 100 spring wheat/durum wheat, 100 corn, and 30 sunflower N rate and crop yield trials. All trials had been conducted at independent sites, each consisting of four to eight N-rate treatments all arranged in a randomized complete block design. All the datasets were provided by the respective researchers who had originally collected them, and used with their permission, effectively covering a wide geographic area. The corn data sets alone consisted of 9 sites from southern Manitoba, over 20 sites from northwest Minnesota, and 6 sites from the northern counties of South Dakota.
A regression analysis of the data sets (combined with previous research findings) aided in separating out the data into groupings, in order to eliminate potentially conflicting factors such as region, tillage (long-term no-till [continuous no-till for 6 or more years] or conventional till), and high clay soils or medium texture sites within each data set. Within each site-year dataset, all yield values were normalized by dividing them by the maximum yield observed at that site. This resulted in per-site linear rescaling giving relative yield values ranging from 0 to 1. Residual soil test nitrate levels, and previous crop N credits were factored into the fertilizer N-rate treatments. Separation and per-site normalization of the data resulted in dramatic visual and statistical differences. The spring wheat and durum wheat N-rate response trial datasets are depicted in Figures 15.27, 15.28, 15.29 and 15.30. The trial sites were all located west of the Missouri River, where the climate is semi-arid and the soils developed from much older parent materials compared to sites east of the river. For the conventional- till sites (Figure 15.27 and Figure 15.28) although the r2 (a metric that measures how tightly correlated the yield response at that site is to an increase in N-rate) of the original data (Figure 15.27) is significant, the r2 increased dramatically when the yields were normalized within each site (Figure 15.28). There would have been no increase in the r2 value if the N rate and yields between sites were not independent. The r2 value showed a similar increase (tighter correlation between relative crop yield response and N-rate) in the no-till sites of spring wheat and durum wheat trials (Figures 15.29 and 15.30).
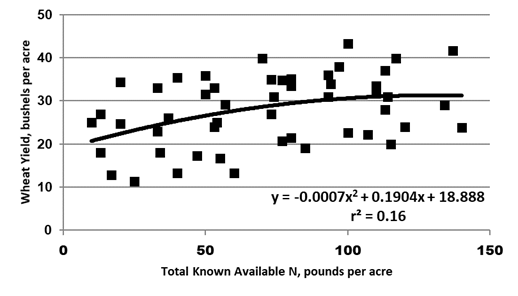
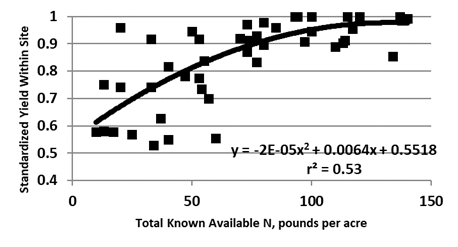
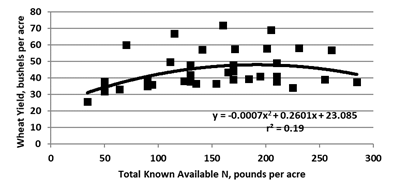
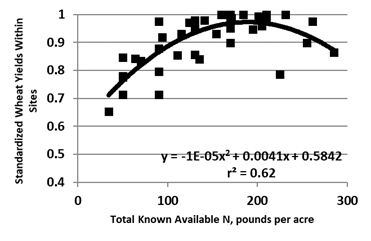
Figure 15.31 and Figure 15.32 effectively highlight why graphing the actual yield attained in each trail tends to blur the relationship between crop response and N-rate. In Figure 15.31, it is easy to distinguish the individual site responses to N. Although the aggregate graph appears scattered, the overall trend of the individual sites appears similar. In comparison, the normalized data in Figure 15.32 represents a common response of each of the sites, even though the maximum yield achieved at each site was different due to environment effects.
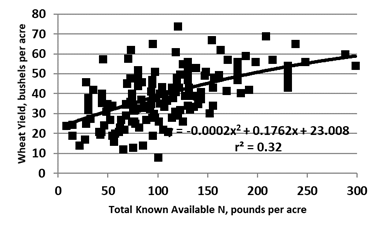
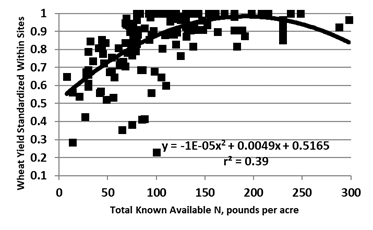
Figures 15.31 and Figure 15.32 effectively demonstrate how some relationships can be misrepresented by using the original data. It is easy to conclude based on Figure 15.31 that the optimal N-rate, based on the crop response, could be much higher than even 300 pounds N per acre. However, using the normalized relative yield approach (Figure 15.32), the optimum N rate without economics considered can be identified by locating the peak of the curve, which is 245 pounds of N per acre according to the regression equation. Figures 15.33 and 15.34, illustrate the same principle comparing available soil N and wheat yield data collected from sites in eastern North Dakota. The r2 value comparing total soil N and the normalized relative yield data (Figure 15.34) is about twice the value of the r2 of the original data (Figure 15.33).
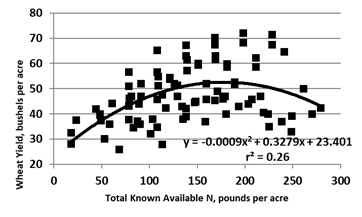
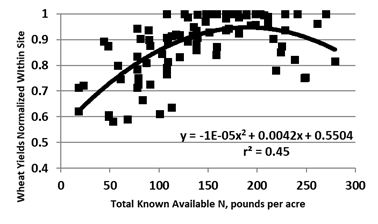
Normalizing the corn yield data sets results in similar results compared to the wheat yield data sets. Figure 15.35 predicts the optimum N-rate to achieve maximum corn yield could be in excess of 300 pounds of N per acre. whereas normalizing the relative yield within sites (Figure 15.36) results in a predicted optimum N rate to achieve maximum relative corn yield of 230 pounds of N per acre. Figures 15.37 and 15.38 highlight the differences in the r2 value between the original and normalized relative corn yield for conventional till, high clay soils in eastern North Dakota, southern Manitoba, northwest Minnesota, and northern South Dakota, and available N. Yield data collected on medium textured soils in the same region had even greater r2 using the normalized relative yield data versus the original yield data (Figures 15.39 and Figure 15.40). Long-term no-till sites in eastern North Dakota (Figures 15.41 and 15.42), demonstrate that normalizing the data within sites not only resulted in an increase in the r2 value (0.68 compared with 0.20), but the optimum N rate to achieve maximum relative yield using the normalized regression was calculated to be 173-pound N per acre, 460 pounds an acre less than the original yield formula (Figure 15.41).
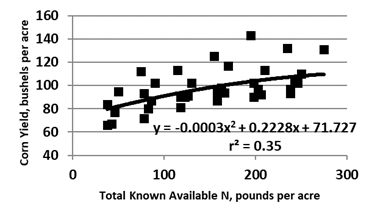
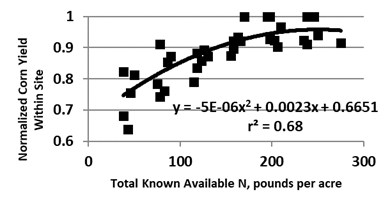
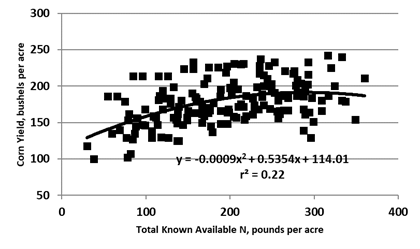
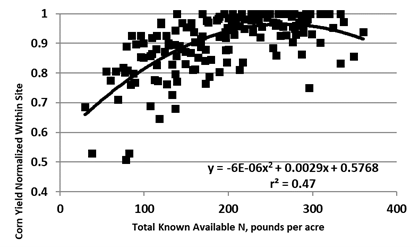
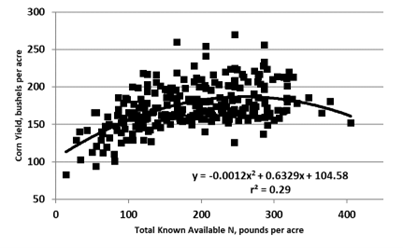
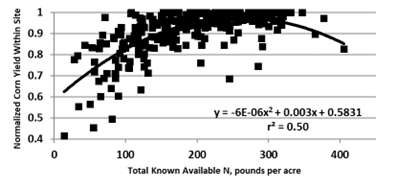
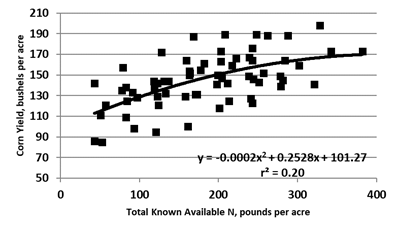
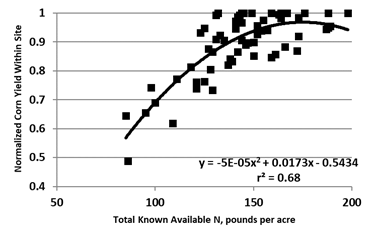
Normalizing the sunflower yield response to the N-rate data set resulted in a higher r2 value compared with the original data set, consistent with the patterns found with both the wheat and corn data sets. Within the sunflower data set, some sub-categories, such as western sunflowers, the normalized regression equation between yield and available soil N results in a reasonable predicted N rate for achieving maximum relative yield, while the predicted N rate based off the original data proves unrealistic (Figures 15.43, 15.44, 15.45, 15.46, 15.47 and 15.48).
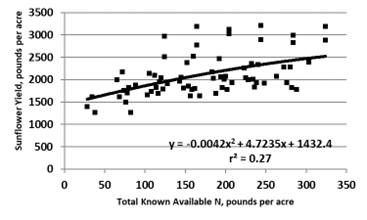
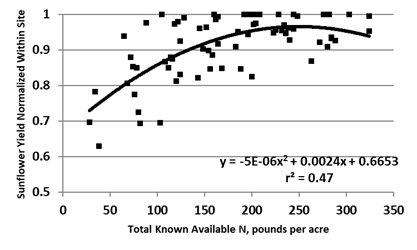
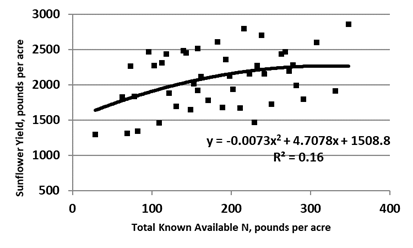
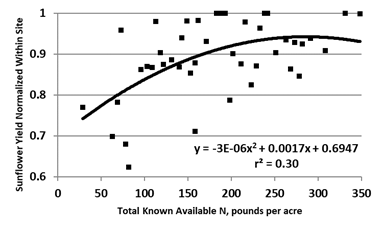
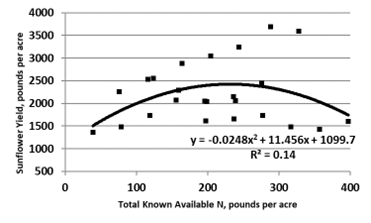
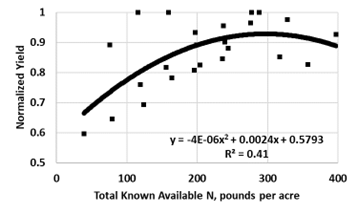
In wheat, corn, and sunflowers, use of normalized data increases the relationship between crop yield and available N soil N. This demonstrates that the ‘cloud’ of plotted data points around a curve predicting raw yield vs available N is simply a series of nearly parallel response curves. When normalized, the data around the curve becomes much tighter as a result of all the individual site curves essentially being stacked on top of each other; the normalized data better express the common underlying N–response pattern across sites.
These results may surprise practitioners and farmers; however, the basis for similar recommended N rates regardless of realized yield might be explained by other sources of N availability to plants. Soil moisture can act to increase or decrease the pool of soil N available to the crops (Martin et al., 1982). In dry soils, N cannot move to the roots by mass flow, but instead is restricted in its path of movement towards the root, limiting the methods of N uptake available to the plant to diffusion or root contact. Also, in dry soil, N mineralization rates are significantly lower. The result of a poorer N use efficiency in dry soils is a higher rate of N required to achieve the same bushels compared to moist soils. In moist soils, N mineralization rates are much higher and movement of N to plant roots is more efficient, resulting in a higher N efficiency lower N required to achieve maximum yields.
15.5 Tillage and nitrogen availability
15.5.1 The North Dakota long-term no-till nitrogen credit
Tillage can be an important factor for growers in North Dakota, when calculating the optimal N-rate. Beginning in the 1970s, farmers in the region who switched from a conventional-till to a no-till system found that after several years, they could reduce their N-rate without affecting their crop yields. After 20 years of continuous no-till management, in the 1990s growers began to realize that the optimal N-rates for their respective fields no longer fit into the NDSU N recommendations at the time. The NDSU spring wheat and durum N rate recommendations were re-examined in 2010 following years of N rate trials across North Dakota. Researchers pooled data from N-rate studies conducted across the state between 2001-2010, along with data sets from other N-rate trials performed by several researchers spanning from the late 1970s to 2000. In all, these data sets included factors such as the preplant nitrate-N soil test value down to two feet, type of tillage management system, and the N-rates that were used. Inclusion of all these various factors allowed for the creation of both a crop yield and protein response curve. When the results of this analysis were partitioned according to the type of tillage management system (no-till or conventional tillage) the wheat in the no-till sites required about 50 pounds N per acre less than conventional till sites to achieve both similar yield and protein concentration.
At the same time, N rates were also re-examined for corn and sunflowers grown in North Dakota. Studies were conducted from 2010-2016, with sites being selected from both long-term no-till management system and conventional tillage system across North Dakota. A comparable “N-credit” to the one document using the wheat data set was also observed at sites with six years or more years of continuous no-till for both corn and sunflower. These results led to the developments of N recommendations for the region that considered long-term no-till sites separately from conventional till sites.
To date, there are only theories on the source of the NDSU no-till N credit. It might be tempting for one’s mind to leap to ‘increased N mineralization from long-term no-till’ as the reason. However, it is not logical that a system that results in greater organic matter over time, in which an associated ~1 pound N is required for each 10 pounds of C sequestered into organic matter, can also release additional N compared to the conventional tillage system. If a long-term no-till site is tilled, it would be expected that a large amount of N would be released due to oxygen exposure to previously protected organic matter on and within no-till aggregates that were broken apart. However, left alone by continued no-till management, this organic matter would not be exposed to oxygen and mineralization directing microorganisms.
One possible explanation for the N credit may be due to the immediate uptake of the applied ammonium-N fertilizer by soil microorganisms (Pan et al., 2017; Ma et al., 2020). Microorganisms as a community preferentially take up ammonium-N over nitrate-N. When ammonium-N fertilizers, ammonia, urea, ammonium sulfate, ammonium-N in other N fertilizers, are applied, some are taken up in conventional till soils, but since there is greater microbial biomass in no-till soils, and there is a far greater supply of C-based substrates, the uptake in no-till soils would be expected to be much greater. The N in microorganisms is released as the organisms die and decompose, and can subsequently be utilized by either the crop or other microorganisms. This effect may be regarded as a kind of biological slow-release N fertilizer.
In addition, another possible explanation could be the fact that there is much greater asymbiotic N-fixing activity in long-term no-till soils compared to conventional till soils (Franzen et al., 2019). There is evidence that asymbiotic N-fixing organisms were present up to 1.5 billion years ago (Boyd & Peters, 2013). However, the natural process of N-fixation requires large amounts of energy, regardless of whether the organism is symbiotic or asymbiotic (Smercina et al., 2016). The main source of energy for asymbiotic N-fixing organisms comes from organic matter, and root exudates. In long-term no-till soils, communities of organisms can remain in spaces on, and within, the soil aggregates as long as they are not disturbed with tillage. Perhaps as much as one-third of the no-till credit may come from the increased activity of these organisms. However, the activity of many asymbiotic N-fixing organisms (probably mostly from bacteria) is not continuous throughout the growing season, but instead peaks in warm, moist conditions, and declines sharply immediately following the spring thaw or in both very dry or very saturated soil conditions (Franzen et al. 2023).
15.5.2 Organic matter content that results in nitrogen mineralization greater than that required to achieve environmentally possible yield
There are some soils in North Dakota that have an organic matter content that exceeds 6%. The highest observed level of organic matter achieved after 40 years of continuous no-till was 7.5% organic matter; with the soil receiving cover crop seeding within and between crops for the previous 6 years prior to this data point collection. Greater than 6% organic matter has been recorded multiple times in eastern North Dakota, particularly in long-term no-till managed soils. There are also areas in extreme northeastern North Dakota that, in the past, have been sheltered from, either by the escarpment west of Pembina along Rt. 5, or in random fields found between the ridges. In several N-rate studies looking at both corn and spring wheat yield responses, there was about a 50-pound N per acre credit recorded when the organic matter was between 6 and 6.9%, and another 50-pound N per acre credit (100-pound N per acre credit total) noted, when the organic matter was 7% or higher. Organic matter ranging from 5.9% and lower is still important in increasing the yield potential of soil, but did not result in a credit against N-rate required for maximum relative yield or profitability.
15.6 N rate as affected by too much water in the growing season
In North Dakota, the wettest period during the growing season is from mid-April through mid-June. The yield response data collected from the North Dakota N-rate trials in spring and durum was not statistically affected by any spring rain events, despite some years, during the course of the study, receiving higher levels of rainfall compared to the 30-year normal at the time. Contrastingly, the corn N rate trials were adversely affected by spring rains; especially in sites where the soils had higher clay content such as: Fargo, Hegne, Viking and Bearden soils, where greater rates of N-loss via denitrification occurred. In sandy soils that were low in organic matter, such as sandy loams and loamy sands, there were also large losses to nitrate leaching. In both sandy and clay soils the yield response to N in wet years was nearly linear, unlike the curvilinear or quadratic response normally seen in soil fertility rate trials. The correlation model fit to this linear data resulted in a predicted N rate of 600 pounds per acre to produce maximum yield. It would not be practical nor would it be environmentally responsible to apply rates even one-third that great to the sandy soils of this region due to their high leaching potential. Poor yields due to higher levels of N-leaching or denitrification can be addressed and corrected more effectively by adjusting the timing of application, not by increasing the N-rate.
To avoid N-losses due to leaching caused by excess water, a particularly effective management strategy is a split N application, which means splitting the total rate of N applied across two or more applications. Corn yield response to timing trials data sets showed that a side-dress application of up to half of the total N rate, taking into account the residual soil nitrate levels at planting and subtracting any previous crop N credits, followed up by another application of the remaining N before V8 (8th true leaf growth stage of corn) resulted in yields of over 200 bushels per acre. The same data set recorded yields of 120 bushels when all of the N was applied to the corn preplant, in a wet spring.
In wet, high clay soils, not all N fertilizers or application methods should be treated the same. For example, coulter-applied UAN is often preferred over anhydrous ammonia, due to its lower drag in application, and the ability to apply it in a narrower and shallower trench than anhydrous ammonia resulting in minimum volatility. Alternatives to coulter-applied UAN in wet clay soils may be NBPT-treated urea applied either with a coulter, or between the rows and under the leaf whorl. Additionally, up to 60 lbs per acre of NBPT-treated urea may be applied over the whorl by ground or air. In soils with high clay content anhydrous ammonia may be used if the soil is dry, and during application the soil is able to fill in the slit produced by the application knife. In medium to sandy textured soils, anhydrous ammonia is usually a good application method. In all the cases where anhydrous ammonia may be applied as a side-dress, the use of covering disks to help fill in the application slit is a wise strategy. Under irrigation, the preferred N application is UAN added directly to the irrigation water. This is called fertigation, and up to about 30 pounds N per acre can be applied at a time, with repeated applications made several times throughout the growing season up until tasseling.
15.7 Regional effects on nitrogen rate
When considering N application methods and N rates in terms of North Dakota geography, there is a very obvious split along the Missouri River/Missouri Couteau boundary. East of the Missouri River, soils are younger and generally more productive. West of the Missouri River, the soil material is much older and the region experiences far less rainfall, leading to significantly lower yields most years, but also less chance for spring N losses due to leaching or denitrification. When N rate data is grouped by east and west regions, it results in a tighter relationship between N rate and relative yield. In state N recommendations an area designated the ‘Langdon Area’ has also been separated out from the rest of eastern North Dakota. The soils in the Langdon Area are characterized by their relatively shallow depth to an underlying shale bedrock layer. Consequently, the soils in this area have a large amount of ground shale and small shale pieces mixed in them. This region was classified as having ‘shaley soil’ by Redmond and Omodt et al. (1967). The shale that is mixed up in these soils can be important when calculating N rate guidelines, particularly because they can contain a relatively large amount of mineralizable ammonium in the ancient clay lattices of the shale (Power et al., 1974). The ammonium trapped in the shale is slowly released over time, turning the soil itself into a kind of slow-release N fertilizer. N rate studies in this region always result in less N required to grow a crop of similar yield than in soils located outside of this region. In the corn fertilizer recommendation for eastern North Dakota, N rates and guidelines that might require a side-dress N application are confined to the Red River Valley and beach ridge region. The rest of eastern North Dakota is grouped with the Central North Dakota region, because the need for side-dress N is greatly reduced in these areas due to the mostly loam soils, and lower rainfall potential. A map of the regional effects taken into consideration when calculating the N rates are included in the fertilizer guidelines for North Dakota published by NDSU Extension.
15.8 Importance of soil test nitrate-nitrogen to North Dakota nitrogen recommendations for all crops
In North Dakota, the soils freeze anywhere from late-November until mid-December varying from a depth of several inches to several feet in most years. As a result, post-harvest residual soil nitrate levels remain relatively stable until seeding the following year. A multi-year study conducted in North Dakota tracked what the residual soil nitrate values were following the crop harvest up until the following seeding dates down to a 2-foot depth from various sites across North Dakota (Swenson, 1976). The study reported that at some sites, residual soil nitrate values would remain unchanged from fall to spring. Contrastingly at some sites residual soil nitrate values either increased or decreased slightly. Precipitation appeared to have no effect on the residual nitrate values. Although, it might seem intuitive that soil sampling again in the spring just prior to fertilizer N application could give you a more accurate representation of what the crop could potentially take up, resampling millions of acres in the spring is impractical, with the fall residual nitrate values being very representative of spring residual nitrate values.
Without consideration of residual nitrate-N soil test values from the 0–2-foot, the relationship between N rate and the crop yield response is very poor. The following Figures present data across multiple spring wheat and durum yield response and n rate trials. The yield of wheat at an N rate of zero ranges from around 10 bushels per acre up to over 80 bushels per acre. This does not make for an accurate prediction of crop yield response based on N rate. Comparatively, when the residual soil nitrate-N values are considered, taking into account the previous crop N credit, the overall spread of the data tightens around a characteristic quadratic curve. The crop yield response at the lower N rates (zero soil does not occur in nature in the soils of North Dakota) being more indicative of a realistic crop response, compared to when the residual N levels are not considered.
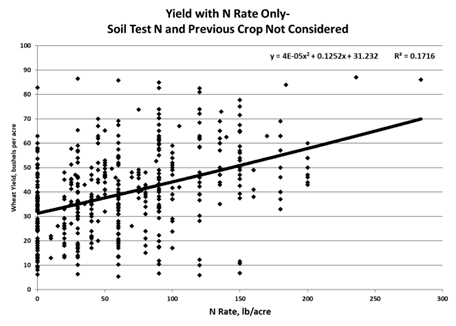
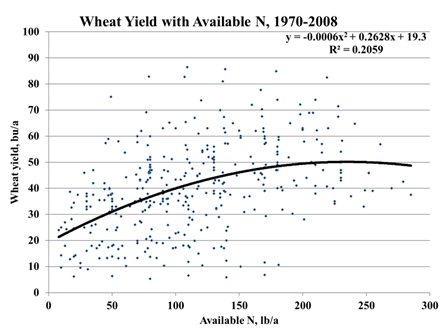
15.9 Previous crop nitrogen credits
The previous crop, planted immediately before the current crop, can be an important factor to consider when calculating the amount of N required in order to maximize the economic return to N for the current crop. As the previous crop’s residue remaining in the field decomposes, a portion of the N from the residue can be utilized by the current crop. Depending on what the previous crop was, its C:N ratio, its yield/biomass, and the length of the previous growing season, a “credit” or certain allotment of N can be subtracted from the current crop’s fertilizer budget. Some crop residues have a lower carbon-to-nitrogen (C/N) ratio than others, which results in a release of plant-available N through rapid decomposition. Also, the mass of residue of some crops is less than others (dry bean compared with wheat or corn, for example). Evidence also indicates that some crops (soybeans, other annual legumes) may accelerate the normal N mineralization rate from organic matter during their growing season, extending to the early growing season of the next crop. Nitrogen availability is greater following crops with a lower C/N ratio (sugarbeet, alfalfa) and crops having a lower mass of residue (soybean, dry bean) with less ability to tie up N during decomposition. The total amount of N that can be subtracted based on this previous crop N “credit” can vary between State, University, and private soil laboratory or fertilizer retailer depending on their fertilizer guidelines. North Dakota State University currently has a previous N-credit for alfalfa, sugarbeet, sweetclover, dry edible bean, and legumes.
###Sugarbeet leaf color and terminated perennial legume nitrogen credits
The sugarbeet leaf N credit comes from research that was conducted in the late 1990’s at both NDSU and the University of MN. The typical color of sugar beet leaves at the time of harvest (late-August until freeze-up) is yellow-green, denoting that the crop nutrient status at the time of harvest is slightly N deficient; consequently, the leaves have a relatively low N content. Sugarbeets with completely yellow leaves at the time of harvest mean that the plants are very N deficient, and there is most likely no N from the decomposing leaves that could be utilized by the subsequent crop. Dark green leaves at harvest mean that the plant has taken up excessive N and there is a potential for a substantial amount of that N to be utilized by the subsequent crop as it is released through decomposition (Table 15.18).
Table 15.18 Nitrogen credit following sugarbeet, based on harvest leaf color.
| Leaf color | Pounds N per acre credit |
|---|---|
| Yellow | 0 |
| Yellow-Green | 30 |
| Dark Green | 80 |
The N credit for alfalfa is based on the expected N mineralization rates of the decomposing alfalfa residue after termination, both the roots and litter portions (Table 15.19). This N credit is based on a conventional tillage system, and although it could be assumed that the N credit could be valid in a no-till system as well, there is no data currently to support this assumption. The greater the alfalfa stand is at the time of termination, the larger the overall biomass will be. The larger the above ground biomass is the larger the amount of residual plant residue there will be after harvesting the crop, and higher amounts of plant residue means a higher amount of potential N that could be mineralized and become plant available. Thus, a poor stand of less than 1 plant per square foot would provide a N credit of 0 pounds per acre, while a better stand would have a substantially larger N credit.
Table 15.19 Previous crop N credit from harvested alfalfa or a sweet clover green manure the 1st year following termination. Half of this N credit should be considered in year 2 following termination.
| Plants per square foot | Pounds N per acre credit |
|---|---|
| 5+ | 150 |
| 3–4 | 100 |
| 1–2 | 50 |
| Less than 1 | 0 |
15.9.1 Nitrogen credit from annual legumes
The source of the N credit given to crops grown after annual legumes (Table 15.20) is different compared to the N credits given to crops following alfalfa, sweetclover green manure, and the sugar beet leaves N credit. The annual legume N credit is based on numerous soybean rotation studies. One hypothesized reason for the legume N credit may be from the annual legume’s potential ability to stimulate the microorganisms in the soil responsible for N mineralization. The hypothesized effect legumes have on the microorganisms appears to not only persist throughout the annual legume growing season, but can continue even after termination of the legume crop and into the subsequent crops growing season. As the soil responds to the new influence (or lack thereof) the new crop has on the soil microbiome, a shift can occur in the relative abundances of the various microbial populations. Consequently, the overall rate of N mineralization in the soil decreases as a response to this change.
Vanotti and Bundy (1995) found evidence for the stimulative effect soybean can have on the soil microorganisms that mineralize N. In a long-term crop rotation and N rate study, the soybean crop was followed by two non-legume oat crops. The first oat crop planted the year immediately following soybean achieved maximum yield with a N rate lower than the calculated N-rate based on: Yield goal * N factor - (Residual soil N + N credit). Contrastingly the following cropping year (2nd year after soybean) there was a consistent N deficit resulting in more N being needed than the predicted rate in order to maximize the yield of the oat crop. They speculated that the first year following soybean the stimulated N mineralization organisms depleted the most easily mineralized organic matter, resulting in a N deficient the second year following soybean.
Another reason for the annual legume credit is based on the comparatively lower amounts of N tie-up from the decomposing residue; attributable to the comparatively lower C:N ratio of annual legumes (Green and Blackmer, 1995).
Table 15.20 Previous crop N credit from annual legumes and harvested sweet clover.
| Previous crop | N credit (lb N/acre) |
|---|---|
| Soybean | 40 |
| Edible bean | 40 |
| Field pea | 40 |
| Lentil | 40 |
| Chickpea | 40 |
| Sweet clover (harvested) | 40 |
During a fallow year or a prevent-plant fallow N is still naturally mineralized during the growing season from the soil organic matter despite there not even being a planted crop present. When a crop is present, the decomposition of high carbon (C) crop residues including corn stover and small grain straw, can result in soil microbes “tying-up” all of this naturally mineralized N from the soil organic matter. This tie-up means there is less overall soil N available to the subsequent crop. Even though the residues from soybean, edible bean (pinto, black, kidney, other Phaseolus cultivars), field pea, lentil and chickpea are not N-rich enough to result in a large mineralization and release of N into the soil following their decomposition, because their residue’s carbon concentration is lower compared to that of corn stover or small grain straw, there is less N tie up per pound of plant residue. The overall biomass of annual legume residue is also less in any given year than that of small grains and corn. Resultingly, the annual legume previous crop N credit comes partially from both the lower amounts of crop residue and the lower carbon and higher N content of the residue (not enough to provide direct N mineralization from the residue, but enough to result in more residual soil N to be available for subsequent crop uptake) (Green & Blackmer, 1995). The calculated N credit for soybeans, and presumably other annual legumes, is the result of N rate rotational studies and some of them are conservative values, and all are legitimately research-supported values to consider in rotations including annual legumes and harvested sweet clover.
15.9.2 Lack of nitrogen cycling from North Dakota cover crops
The commonly accepted belief held by crop and soil scientists as well as producers is that the tie-up, or release of N, from cover crops is based largely on the ratio of carbon to nitrogen of the cover crop(C/N). Generally, the reasoning is that if the dry matter from the cover has a C/N ratio greater than 30, N tie-up is likely. If the ratio is less than 20, release of N is more likely, and C/N ratios between 20 and 30 result in negligible amount of tie-up/release of N. However, recent research in North Dakota challenges this long-held belief.
A field study was set up in 2016-17 at a site southwest of Rutland, ND (a couple miles north of the North Dakota/South Dakota border). Starting in early August 2016, a cover crop mixture was seeded into the winter wheat stubble of a long-term no-till field (>30 years continuous no-till) consisting of field pea, flax, forage radish, and any volunteer winter wheat. After emergence, the cover crop was killed approx. 2 weeks after seeding. The main plots of the study were those that had a cover crop vs no cover crop. Measurements taken were: the cover crop biomass (sampled in late fall before freeze-up), residual soil nitrate-N to 2 feet in depth, and soil moisture (Tables 15.21 and 15.22). The following spring, the plots were seeded with corn, and then N rates in 40 pounds of N per acre increments ranging from 0 to 200lbs were applied on the soil surface as ammonium nitrate. The total amount of N in the biomass of the cover crop was around 85 pounds N per acre. The residual soil nitrate-N level in plots that had the cover crop was 15 pounds of N per acre (Table 15.22), while the residual nitrate-N in the no-cover crop plots was 114 pounds N per acre. Therefore, the total known N (N in the cover crop biomass plus residual nitrate-N) in the cover crop plots was 100 pounds N per acre. Another cover crop of Rye, radish, and camelina was seeded between the rows of all the corn plots on June 22nd, 2017. On the 16th of August, the total above ground biomass of the newly planted cover crop was sampled across each N treatment. The dry matter weight of the newly planted total cover crop was 133 pounds per acre, with an N content of about 4%, resulting in a total uptake of only 5 pounds of N per acre, a trivial amount compared to the total N taken up by the corn crop. #### Table 15.21 Cover crop biomass, C/N ratio, soil moisture to 2 feet, and residual soil nitrate, sampled on 21 October 2016, at Rutland, ND. | Cover crop | Biomass (lb/acre) | C/N ratio | |——————-|——————-|———–| | Field pea | 1,490 | 18.1 | | Radish top | 1,690 | 15.4 | | Radish root | 1,370 | 29.8 | | Flax | 200 | 21.0 | | Winter wheat | 220 | 14.5 | | Total / Weighted mean | 4,970 | 18.0 |
Table 15.22 Residual nitrate-N and volumetric soil water content in cover crop and no-cover crop main plots, winter wheat stubble, Rutland, October, 2016.
| Treatment | Residual soil nitrate-N (2 ft) | Water content (inches in 2 ft) |
|---|---|---|
| Cover crop | 15 | 5.05 |
| No-cover crop | 114 | 5.25 |
The N rate response equations for the corn yield (Figure 15.51) indicated that the N rate required for maximum corn yield + a cover crop was 162 pounds N per acre, while the N rate required for maximum yield in plots without a cover crop was 161 pounds N per acre. In terms of Economic Optimum N Rate (EONR), assuming $3.50 corn price and $0.40 cents per pounds of N cost, the EONR for the no cover crop was 0 pounds N per acre, while the EONR for the cover crop was 136 pounds N per acre. In terms of residual N plus N rate, the Economic Optimum N (EON, which includes residual nitrate-N plus N rate) is 77 pounds N per acre for corn grown without a cover crop, and 178 pounds N per acre for the corn grown in the cover crop residue. The cover crop resulted in a N-drag of about 100 pounds N per acre, equating to an economic loss of about $57 as a result of the cover crop. The reduction in yield due to cover crop could not be explained by soil moisture differences, since there were no significant differences in spring soil moisture at the time of planting between either treatment.
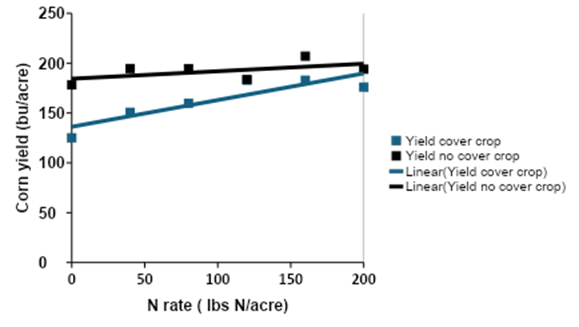
From this study, it is evident that the C:N ratio alone is not the sole factor that determines whether or not the N from the previous cover crop biomass will be available to the next corn crop. Instead, it is more likely due to a host of factors including the total biomass produced, the structure of the plant biomass, and the time of termination. Grass cover crops or grass-only cover crop mixtures were not included in these studies; however, it has been indicated by others that they do not provide the same N credit to the following corn crop (Pantoja et al. 2015). There are many species of cover crops available to plant in mid-August and each has their own potential benefit; however, if a grower in North Dakota is interested in a cover crop that will supply N, choices appear to be limited only to legumes (assuming a full growing season)
15.9.3 Natural asymbiotic nitrogen-fixers
Asymbiotic or non-symbiotic N-fixing organisms living in the soil, usually various species of bacteria, have the ability to ‘fix’ nitrogen (N) from the atmosphere, where it is abundant as N2 gas, and convert it in into plant available NH3 without being associated with plants or fungi. Fossil evidence indicates that asymbiotic N-fixers were present and active up to 1.5 billion years ago (Boyd & Peters, 2013). This dwarfs the earliest evidence we have of symbiotic N-fixing bacteria associated with legumes appearing only about 59 million years ago (Sprent & James, 2007).
The process used by asymbiotic organisms to fix N from the atmosphere is highly energy intensive. The enzyme that serves as the fixation facilitator in bacteria is nitrogenase. To convert one molecule of N2 to one molecule of NH3, it requires 16 ATP (adenosine triphosphate) molecules (the chemical fuel for most biological reactions) and 8 electrons. For context, the synthesis of a single peptide bond during amino acid synthesis, a process that is considered to have a ’high energy requirement, only requires 5 ATP (Smercina et al., 2019).
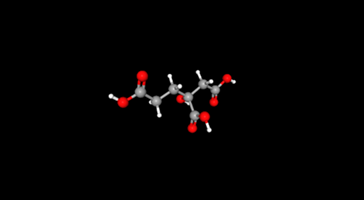
N-fixing asymbiotic organisms acquire the large amount of energy needed to to fix N from a variety of sources depending on their spatial presence in the surface soil biome. These sources may include some of the soil organic matter, or other intermediary compounds that result from the process of decay in the soil of various plants, animals or microorganisms. Another rich source of energy is the root exudates of the growing plants. Contrastingly, if N-fixing organisms are active inside living plant tissue, the only energy source for N-fixation has to come from the plant itself.
There are many species of asymbiotic bacteria, including those of the genera Azotobacter and Clostridium. In a China study of Tibetan soil (Li et al., 2021), after a genetic screening of all the asymbiotic bacteria found in various soil samples, the reported from the soil 6 different Phylas, 13 different classes 43 unique genera, and numerous species of bacteria. The level of activity of all of these N-fixing bacteria is linked to both the substrate and soil conditions, requiring both a stable housing and food source. The overall level of activity of asymbiotic N-fixing organisms is reported to be greater in a no-till management system compared to a conventional tillage system (Lamb et al., 1987; Franzen et al., 2019; Figure 15.53). Although Lamb et al. (1987) concluded that the difference in the level and rate of asymbiotic N-fixing between the two systems was not great enough to reduce supplemental N requirement based on their incubations. It has been proposed by Franzen et al. (2019) however that asymbiotic bacteria can supply as much as one-third of the 40-50 pound per acre N credit based on various N rate studies comparing conventional tillage to no-till environments under crops of spring wheat, corn and sunflower in North Dakota. Of note, is the possibility that soil disturbance caused by the handling of the soil during sample collection and preparation for laboratory incubation in both studies no doubt could have contributed to the degradation of the housing for the organisms, which leads the proposed values reported from the incubation of the bacteria to act more as an index, or qualitative values rather than representing their in situ activity had they remained in the field.
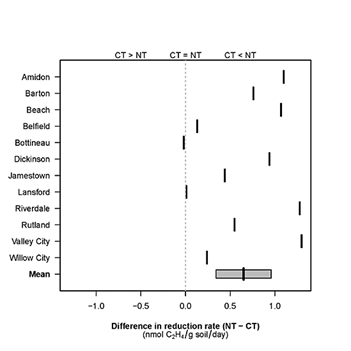
Asymbiotic N-fixation is highly dependent on soil temperature and soil moisture. Using monthly sampling of six sites in eastern North Dakota and relating the level of activity back to mean total monthly rainfall and to mean air temperature for the 30 days prior to each sampling, leads to the conclusion that moist soil and warm temperatures produce greater levels of activity (Figure 15.54).
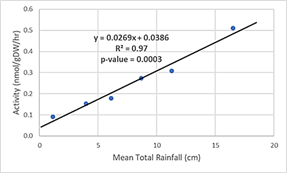
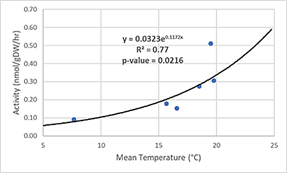
Asymbiotic nitrogen-fixing bacteria are currently commercially available, with a range of claims regarding their ability to supplement and take the place of a portion of a nitrogen fertilizer recommendation in crops. As already stated however in this section, asymbiotic nitrogen-fixing bacteria are a part of the natural soil environment, with the limitation of their activity being tillage, moisture, temperature and abundance of food supply. Farmers should consider the following points and ask questions about products before committing to large-scale use.
- It is important for farmers to be curious regarding new products, but it is equally important for them to test them in replicated trials on their farm before general purchase and adoption (Thompson et al., 2022).
- There should be a ‘kit’, or a means to test the soil and/or plant to determine whether the organism is present, alive and functioning as advertised.
- Asymbiotic nitrogen-fixing bacteria have a specific range of temperatures for them to stay viable. Explore the supply chain to determine whether the range of conditions necessary to keep the organisms is in place from the time it exits factory production to when it enters the soil or crop.
- Is the commercial organism competitive enough to ‘win’ when placed into an environment where many things want to kill it or eat it.
- Soils in North Dakota can be droughty, or wet, sandy or high clay, high pH or low pH, high salt or low salt, and sometimes all of the above are present together in the same field. Are the organisms adapted to this wide range of conditions?
- Know that whatever the asymbiotic organism, it will never be able to supply all of the nitrogen to a crop due to the limitation of food sources. Symbiotic N-fixers are able to supply most of the nitrogen to legumes because they are intimately connected to their host plant and able to access food whenever it is required. Not so in the asymbiotic condition.
15.10 Nitrogen recommendation for North Dakota crops, in alphabetical order
15.10.1 Nitrogen for Alfalfa and Clovers
- Alfalfa and clovers, if properly inoculated, require no additional N. The N-fixing bacterial inoculants for each crop are:
- Alfalfa and yellow/white sweetclover – Rhizobium meliloti
- Alsike clover and red clover – Rhizobium trifolii
- Birdsfoot trefoil – Rhizobium loti
15.10.2 Nitrogen for Barley: 6-row barley and 2-row malting barley
For barley, the line between adequate N and excessive N can be very fine. Barley requires adequate nitrogen (N) for good yields, but a grain protein level in excess of the limits set by the industry will result in the crop being rejected as malting grade barley. Excess N may also result in smaller kernel sizes, and greater incidence of lodging, which lowers yields and increases the pervasiveness and severity of both fusarium head blight (scab) and other potentially devastating diseases.
In recent years a shift in the brewing industry has led to an increase in the use of 2-row barley cultivars, over 6-row barley. Two-row barley has more consistently favorable protein concentrations and other malting-friendly properties. Nitrogen rate trials were conducted that focused on determining the most profitable N rate to use for growing 2-row barley cultivars in North Dakota (Goettl et al., 2024). The other objective of these trials was to develop an N calculator to predict the most profitable N rates given varying both the cost of N fertilizer and the price of 2-row barley.
Due to the irregularity of rainfall in the region, a preplant N application is important to adequately feed the barley through its short growing season. All of the N intended to be used by the barley crop should be applied preplant. Top-dressing N after crop establishment is discouraged because it can result in higher levels of grain protein without increasing yield. Once the N application is made, managing the crop for high yield is important. Although yield is most directly related to temperature, soil moisture and rainfall within any given growing season, growers still have a number of important management factors that can influence yield in any given year. High fertilizer application rates will not result in any yield increase greater than the environment, and their other management decisions, will allow. Yield and N rate have not been found to be closely related between environments. Hence, in lieu of yield predictions, fertilizer rates for barley are instead based on the rate that could maximize both yield and quality in any given year. Since feed barley is not limited by protein, N rates for feed are slightly higher compared to malting barley. However, excessive N rates may still result in pre-anthesis lodging, increasing the severity of disease and decreasing grain recovery during harvest.
Nitrogen considerations due to date of planting for barley
Research at NDSU has shown that seeding barley early is one of the most important management practices a producer can do to help achieve the highest yield season to season. Seeding barley before May 15th provides the greatest chance of achieving malting grade south of Highway 2, for northern-tier county growers the critical seeding date is May 25th. Seeding two weeks later than either of these dates may eliminate any chance a grower has of achieving malting grade, unless they greatly reduce N rates. Very low yield resulting from late planting and low N rates is typically not an economically viable option, long-term, for most growers.
Nitrogen considerations due to seeding rate of barley
Adequate seeding rate using a barley variety approved for malting is important for growing and marketing the crop effectively. Current barley seeding rates are 1.5 to 2.0 bushels per acre (65-90 pounds live seed per acre). Growers would be advised to determine both the number of seeds per pound, and the germination percentage when attempting to calculate a more accurate seeding rate. A typical target plant population is anywhere from 1.25 million to 1.30 million plants per acre, or approximately 30 plants per square foot.
Additional management tools for optimal barley performance
Adequately controlling insects, weeds, and disease is imperative to producing a successful malting barley, or quality feed barley. NDSU has a variety of publications to help these decisions available from County Extension offices, or from the NDSU Extension Publication website.
Abandonment of yield goal as a consideration of barley nitrogen rate
The most important reason for abandoning yield goals when calculating fertility recommendations for barley, is that the data from modern fertilizer rate trials indicate that a similar rate of nutrients will result in the highest yield possible regardless of what the particular maximum yield potential may be in any given experiment. In other words, the rates of nutrient resulting in highest yield in a low-yield environment are similar to the rates that result in highest yield in a high-yield environment. A logical way to explain this is that in a low-yield environment, resulting from either too wet or too dry of conditions, nutrient use efficiency is quite low, therefore a greater overall rate of nutrients is required to produce the unit of yield as a lower rate would be in a high-yield environment. Crops grown in a higher yield environment often have higher nutrient use efficiencies since the rate at which nutrients are released from the soil matrix into the soil solution is maximized, root growth is maximized, and movement of nutrient to the root is maximized, and so a lower rate of nutrient is required to produce a unit of yield. The recommended N rate table values should therefore be utilized regardless of what yield a grower believes will result from their barley cultivation. The recommended N rates for 6-row feed barley can be found in Table 15.11.2.2 for conventional tillage, and in Table 15.11.2.3 for feed barley under no-till. Tables 15.11.2.3 through 15.11.2.4 show the economic optimal N rates for 2-row malting barley. The table values represent the values provided in the 2-row malting barley N calculator, which can be accessed at https://www.ndsu.edu/pubweb/soils/N_calculators/#.
Nitrogen rate adjustments for barley
Total N requirements are the sum of residual nitrate-N soil analysis to 2 feet in depth, previous crop N credits (Table 15.20), and an adjustment for 6 years or more of continuous classic no-till and shallow one-pass seeding. Soil sampling is usually conducted the fall before planting, although early spring sampling works just as well, with neither time being superior to the other in terms of accuracy in measuring the residual soil nitrate-N value. Site-specific zone soil sampling can help to reduce over- or under-fertilization in areas of the field where variations in residual fertility levels are masked by the overall average given by a whole-field composite soil sample. The N rate adjustment for barley in a long-term no-till production system is due to an apparent decrease in the N rate required to achieve maximum yields based on research in spring wheat, corn and sunflower conducted at NDSU over the past 10 years. In fields that are transitioning to no-till, or are no-till during only part of the rotation, an additional 20 pounds N per acre would be required to overcome the tie-up of N by residue before soil microbial communities convert to a more efficient N cycling system. In the Langdon region, subtract an additional 30 pounds of N per acre from the 6-row barley N recommendation.
The N rates required for both maximum yield and a malting grade protein of less than 14%, are more conservative than for barley grown for feed. Compared to 2-row barley, 6-row barley, needs to be slightly N deficient in order to achieve malting grade protein. In drought years, the chances of making malting grade protein can be low, as any combination of beginning residual nitrate levels and even the most conservative N rates may still result in higher protein barley. N rates applied at planting in a year with limited spring subsoil moisture should be split, with perhaps half the N rate applied by seeding, and then guessing on what rainfall might be received over the next 6 weeks another application of either the remaining half of the recommended N, or less than half up to even no additional N if the outlook for rainfall is bleak for the next 30 days post-application. No additional N should be applied after 5-leaf barley, as the majority of this applied N will go to producing more protein than grain. The economic optimal N rate for 2-row barley for the western, eastern and Langdon regions of ND are provided in Tables. Any residual soil nitrate-N levels in the soil up to a depth of 2 feet along with any previous crop N credits or long-term no-till credits (subtract 50 pounds N per acre) should be subtracted from the total value listed in Table 15.20.
Nitrogen application methods for barley
For Barley production, any amount of nitrogen can be applied along with the seed at planting as long as it does not exceed the limits recommended in Table 15.11.2.1. For more detailed charts that include variation in soil texture and soil moisture, please refer to NDSU Extension Circular SF1751. Some growers also use a mid-row band application of anhydrous ammonia, urea, or other nitrogen solutions successfully. Again, seed safety is the major concern. As long as seed and fertilizer are separated by at least 1 ½ inches for any urea and nitrogen solutions, and separated laterally by at least 3 inches for anhydrous ammonia, application of reasonable rates of nitrogen can be safely applied.
Fall application has been shown to be successful when the application is made after October 1, and only when soil temperatures have declined below 50oF in the morning to a soil depth of at least 4-inch. Fall application of nitrogen should not be made to sandy soils, nor should it be made to heavier soils that are prone to early spring saturation. Nitrapyrin and DCD are the two chemistries that have nitrification inhibiting properties in NDSU research. A full description of the chemistry and properties of nitrification inhibitors (see NDSU Extension Circular 1581).
Surface application of urea is possible if an NBPT-based urease inhibitor is impregnated onto the urea before application. Under no-till, subsurface application of urea or UAN (28-0-0) to a depth of at least 2-inches is considered the most efficient application method, as the conversion from urea to free ammonia by the urease enzyme found in the soil is very fast when any crop residues are present. Also, N is at risk for ammonia volatilization if soil pH under conventional tillage is greater than 7 when urea is surface applied or subjected to shallow tillage. There is even evidence that a shallow (less than 2 inches in depth) incorporation of urea may be worse than no incorporation at all. A urease inhibitor containing an effective rate of NBPT or NBPT/NPPT will inhibit ammonia volatility almost completely for about 10 days. For more information regarding urease inhibitors (refer to NDSU Extension Circular 1581).
Table 15.23 Maximum N + K2O recommended for application with the seed, based on planter row-spacing, planter type, and seed spread. This table assumes a coarse textured soil for the lower end of each range, and a heavier texture for the upper end of the range. For more detail, see NDSU Extension Circular SF1751 https://www.ag.ndsu.edu/pubs/plantsci/soilfert/sf1751.pdf.
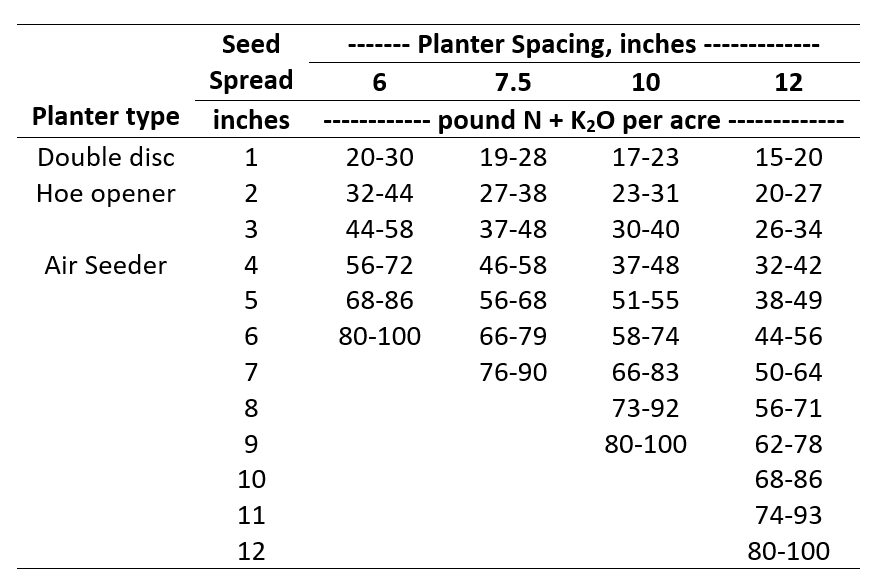
Nitrogen rates for 6-row feed barley
Recommended N rates for 6-row feed barley can be found in the left column of Tables 15.24 and 15.25. These values include any previous crop N credits and residual soil nitrate-N values to 2 feet in depth. A 30 pound per acre long-term no-till credit is deducted from the Gross N rate value in Table 15.25.
Table 15.24
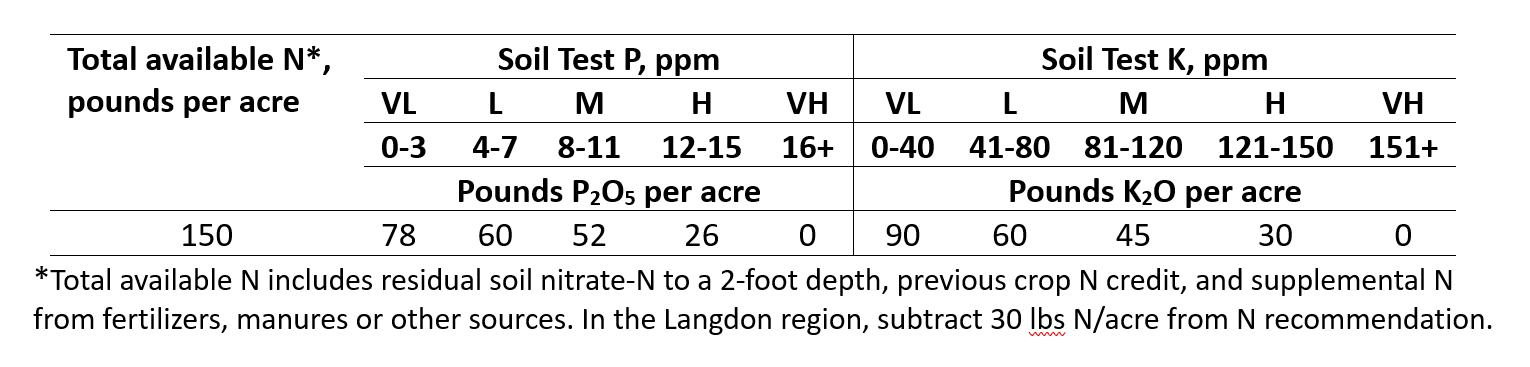
Table 15.25
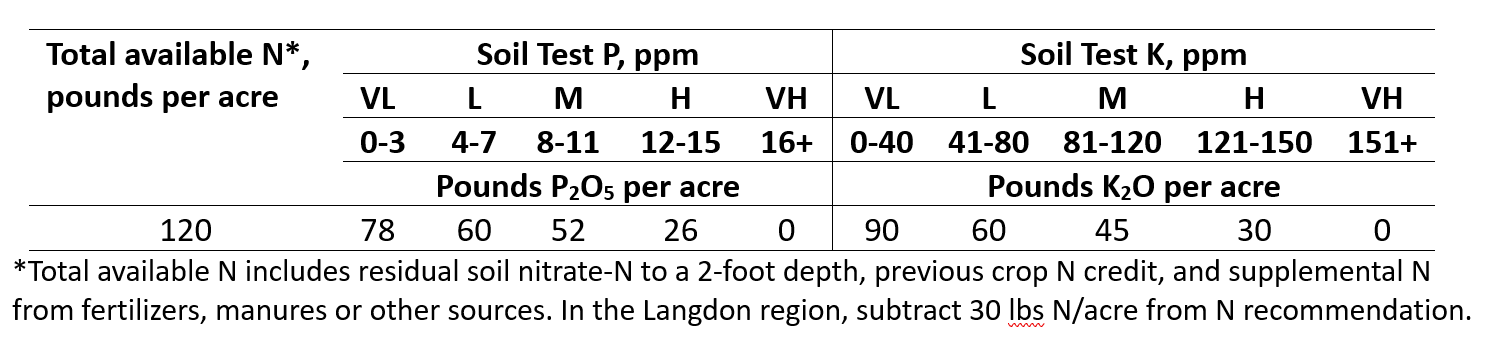
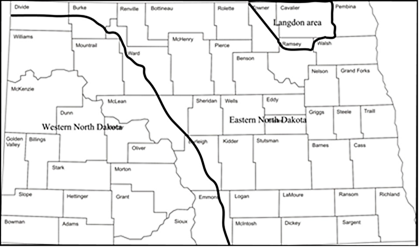
Table 15.26
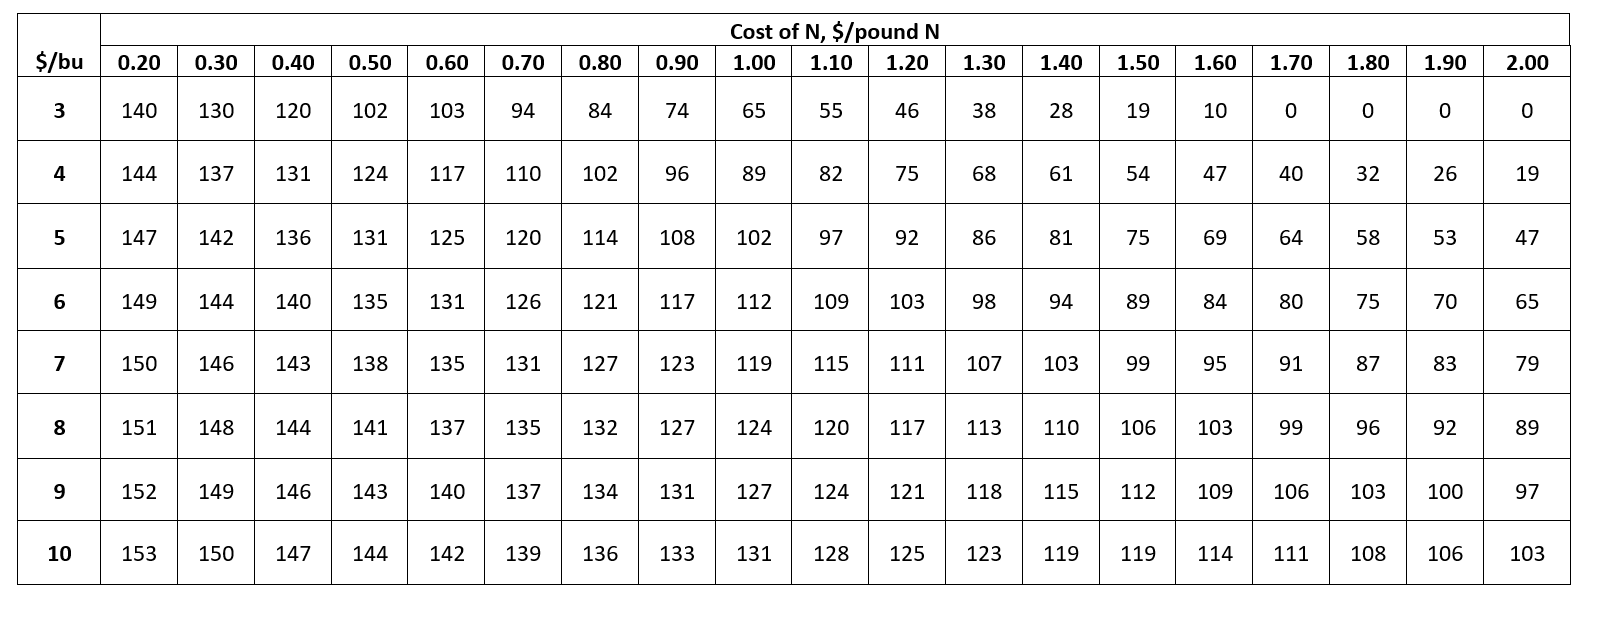
Table 15.27
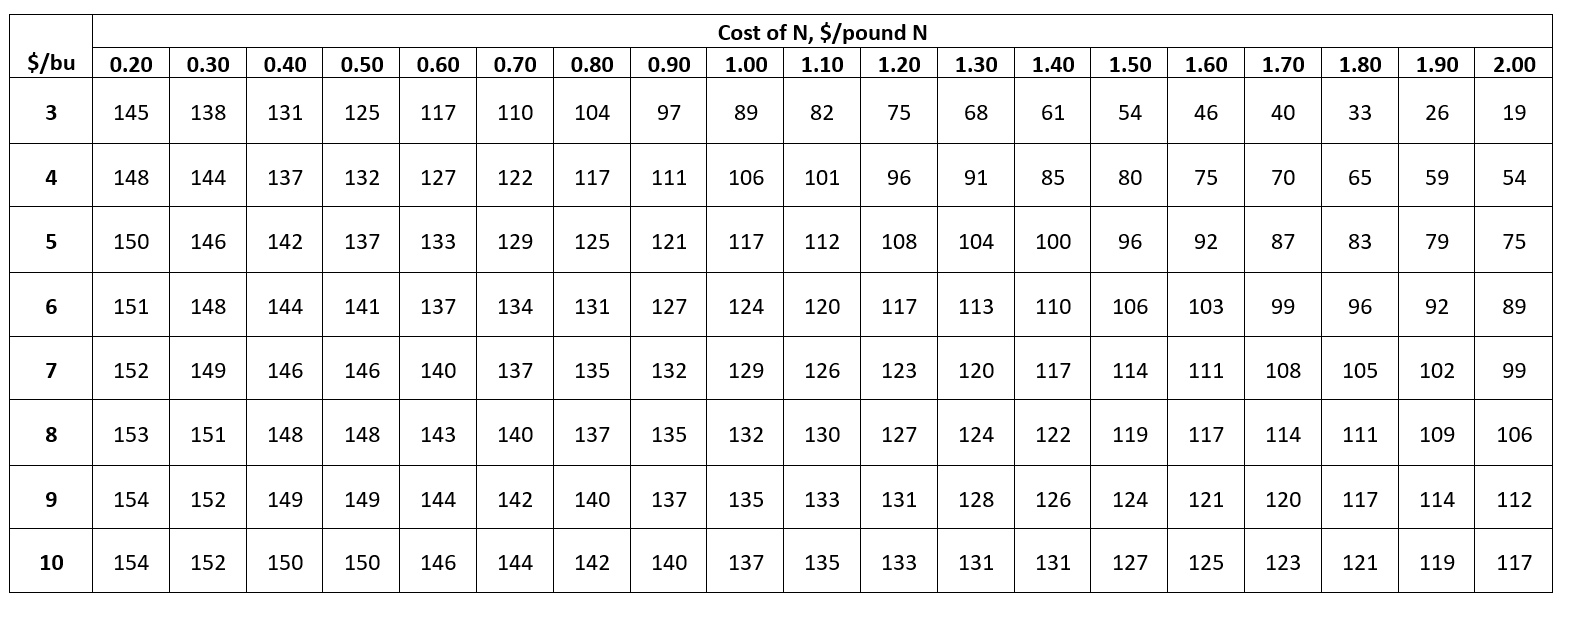 ##### Table 15.28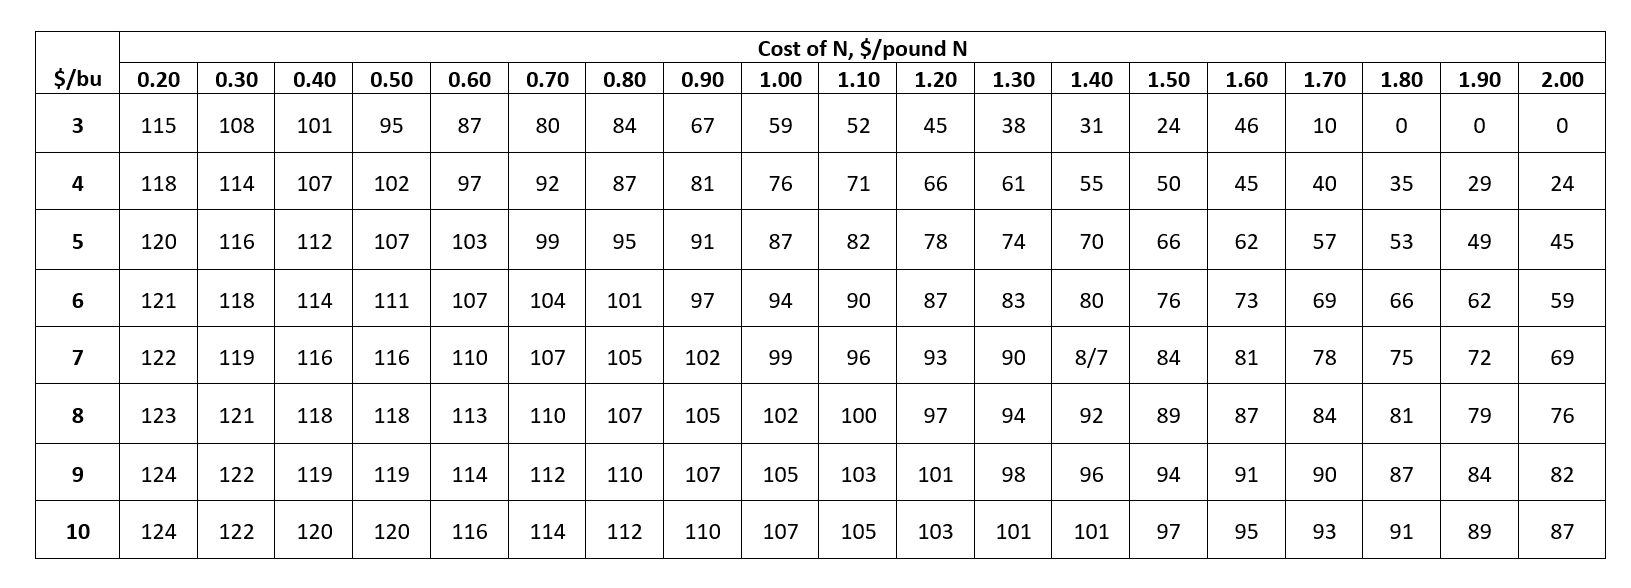
15.10.3 Nitrogen for Buckwheat
Buckwheat yields across North Dakota fall into a narrow range. The recommended N rate for buckwheat is 80 pounds N per acre, less soil test N to 2 feet in depth or any previous crop N credit. Buckwheat N rates for the Langdon area are about 30 pounds N per acre less than the rest of the state of ND. The long-term no-till N credit for buckwheat (6 years or more continuous no-till, shank strip-till and/or shallow one-pass seeding) should be 30 pounds N per acre.
15.10.4 Nitrogen for Canola
Canola nitrogen calibration studies have been conducted at the NDSU Langdon, North Central, Williston, Carrington and Hettinger Research Extension Centers, with additional sites near Valley City and Wishek providing data to support these recommendations (Figure 15.56). The data shows that the optimum N rate is similar regardless of the productivity or N-efficiency of the variety. It also indicates that the optimum N rate for lower-productivity sites is similar to the optimum N rate at higher-productivity sites for the same variety type. Therefore, producers do not need to adjust rates for different yield goals. The same N rate to support yield in high-yielding environments is the same N rate needed to support yield in lower-yielding environments. Due to yield-limiting environments in both the drier and warmer areas of North Dakota and the economics of N application across these two environments, the recommended N rate for canola production is less than the N rate in moister and cooler areas of North Dakota. Overapplication of N to canola resulted in drastic profit reduction at all of the experiment sites.
Total nitrogen for canola production
For the cooler and more moist parts of the state the recommended N rate for canola is 150 pounds per acre (Figure 15.58). For the warmer and drier parts of the state, the recommended N rate is 120 pounds per acre. These regional N rate recommendations should take into account the soil test nitrate-N level to 2 feet in depth, and any previous crop N credits Table 15.20 or N fertilizer already applied. If the canola is being grown in a continuous (6+ years) classic no-till or shallow one-pass-seeding production system, subtract 30 pounds N per acre from the recommended N rate. Seed-placed N rate is restricted to the values in Table 15.11.4.1.
Nitrogen application timing and N-transformation inhibitor use for canola
In canola production, nitrogen may be fall-applied on most North Dakota soils, except on sandy loam or coarser textures, or where flooding is expected in the spring. Ammonium-N sources, including anhydrous ammonia and urea, should be used for fall application, but not fertilizers that contain nitrate. No fertilizer N application is recommended before Oct. 1, with application of ammonia delayed until the soil temperature at a depth of 4-inches, measured between 6 and 8 a.m., is less than 50oF. Banded urea should be delayed at least a week after the ammonia application date, and broadcast urea should be delayed two weeks later than the ammonia application date.
A nitrapyrin or DCD nitrification inhibitor, applied at a proper rate, will help slow the nitrification process, but the use of these materials does not allow for an earlier than recommended application date. Instead, these additives can be used to protect the ammonium-N from being transformed to nitrate in the case freeze-up of the soil in the fall is delayed.
Spring application of N in canola may be made preplant or at planting. Canola is very sensitive to fertilizer salts, meaning no more than 5 pounds per acre of N + K2O should be placed with the seed in a 12-inch row spacing on medium-textured soils; however, the rate can be increased proportionally with a more narrow row spacing or an increase in seed spread (Table 15.11.4.1). If urea is applied to the soil surface, in a conventional tillage system, it should be incorporated within a few days. If the urea ends up within 2 inches of the soil surface, it should be treated with an NBPT urease inhibitor to avoid any ammonia volatilization from the urea. If the urea is applied on the surface in a no-till system, a vertical tillage pass is not enough to incorporate it to a sufficient depth in order to prevent ammonia volatilization. Instead in this situation the urea should also be treated with an NBPT urease inhibitor. If urea is placed 2 inches deep, or deeper, using an application knife, such as with a strip-till shank applicator, no NBPT is necessary.
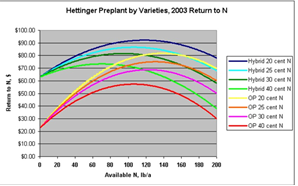
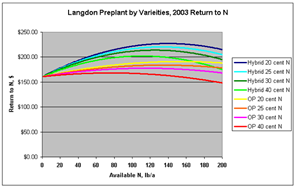
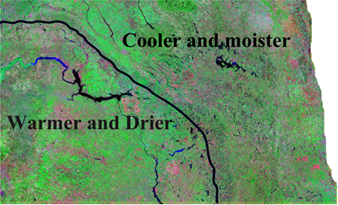
Table 15.29 Maximum rates of seed-placed N + K2O for canola and mustard.
| Maximum rates of seed-placed N + K₂O for canola and mustard | |||||||||
|---|---|---|---|---|---|---|---|---|---|
| Soil Texture |
Disc or Knife (1-inch spread)
|
Spoon or Hoe (2-inch spread)
|
Sweep (4–5-inch spread)
|
||||||
| 6 in. | 9 in. | 12 in. | 6 in. | 9 in. | 12 in. | 6 in. | 9 in. | 12 in. | |
| Light | 5 | 0 | 0 | 20 | 15 | 10 | 30 | 20 | 15 |
| Medium | 10 | 5 | 5 | 25 | 20 | 15 | 35 | 25 | 20 |
| Heavy | 15 | 10 | 5 | 35 | 25 | 20 | 45 | 30 | 25 |
| Rates shown are pounds N + K₂O per acre. | |||||||||
15.10.5 Nitrogen for corn
Nitrogen rate construction for corn
For corn, a fall soil test down to 2-feet in depth for residual nitrate-N is a very important component of the N rate recommendations. If the soil test nitrate-N and previous crop N credits are not included in the analysis there is a very poor relationship between N rate and relative corn yield. The inclusion of the soil test nitrate-N value down to 2-feet and any previous crop N credits produces the ‘total known available N’ which is used in relating the plant available N to the relative corn yield, and the resulting supplemental N rate recommendations.
Nitrogen recommendations are based on an economic production function which includes the yield response of corn to any added N, subtracting the total cost of the N fertilizer. This recommendation system is called the “Return to N” approach, as defined by Sawyer and Nafziger (2005). The relationship between total available N to yield for each recommendation category (region, soil texture, tillage management) is considered. As total known available N increases, yield increases up until the cost of any additional pound of N is equal to the income benefit for the fraction of a bushel of corn produced by that additional N.
At very high rates of N, yield can actually decrease as a result of the additional N. The yield decrease is related to greater lodging, “green snap,” or stalk breakage during a high wind event caused by unusually rapid stalk elongation and poor stalk structure in addition to other physiological factors.
Nitrogen recommendation regional categories for corn
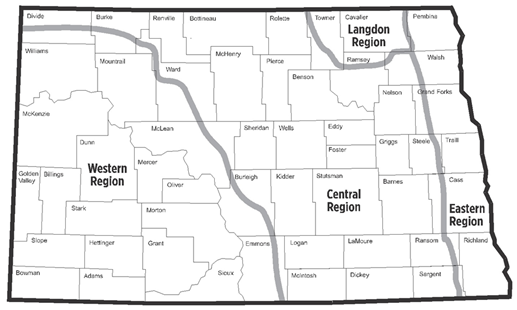
Nitrogen rates for the Western Region for corn
The response of corn to N is different between Western Region soils and soils east of the Missouri River. Part of this difference may be due to the tendency for productive corn acres west of the Missouri River to be in long-term no-till systems. Another potential reason for this difference is both the soil types, and the warmer and drier climate of the west-river region (Table 15.11.5.1). The N guidelines for fields under continuous classic no-till, shank strip-till or shallow one-pass-seeding management systems for 6 years or more are 50 pounds less than the recommendation table values (for these same fields, NDSU N calculator https://www.ndsu.edu/pubweb/soils/N_calculators/# automatically subtracts 50 pounds of N per acre).
Table 15.30. Corn N recommendation table for Western Region soils, considering maximum return to N using corn N price and N cost.
Nitrogen rates for the Central Region and Eastern Region for corn
The Central region has similar characteristics compared to the Eastern region, but the yield potential for the region is not as great, nor is the potential for N loss from denitrification and leaching as high as it is in the Eastern region. In the Eastern region, fields with a history of lower yields should have the practice of side dressing a portion of their applied N applied incorporated into their fertility management program. In the Central region, N loss is not as big of a yield limiting factor for the region, as is soil type or climate; Side-dressing is neither encouraged nor discouraged across this region. Nitrogen recommendations for the Central Region of North Dakota under conventional till are provided in Table 15.11.5.2 and are imbedded into the North Dakota Nitrogen Calculator https://www.ndsu.edu/pubweb/soils/N_calculators/# .
Nitrogen recommendations for the Central and Eastern Regions under continuous long-term no-till can be found in Table 15.11.5.3 and in the North Dakota Nitrogen Calculator. In eastern North Dakota and central North Dakota, long-term no-till production systems are, segregated from conventional-tillage sites. The North Dakota sunflower, and spring and durum wheat N recommendations include a separate category for long-term no-till. This category was created based on data collected from multiple N rate studies showing a difference of up to 40 - 50 pounds less N required per acre for long-term no-till soils, compared to conventional-till; to improve usability and versatility rather than creating another N credit, a separate return-to-N analysis was prepared.
Table 15.31 Corn N recommendation table for the Central Region of North Dakota, considering maximum return to N using corn N price and N cost.
Table 15.32. Corn N recommendation table for eastern and central long-term no-till soils, considering maximum return to N using corn N price and N cost.
Eastern Region special conditions requiring consideration of side-dress nitrogen for corn
Soils in eastern North Dakota are most commonly managed using conventional tillage, and are divided into two soil categories: high-clay and medium textured. High clays include soils classified based on their texture as clay, clay loam and silty clay loam. A few of the soils in eastern North Dakota that would fall into the high-clay category include Bearden, Fargo, Hegne and Viking soils; all of which have a clay greater than 35% by weight of total soil mineral material. These soils are highly susceptible to denitrification, which is a soil bacteria-led process in which nitrate is converted to nitrous oxide and nitrogen gas where it can be lost from the soil into the atmosphere.
The Denitrification process proceeds when the soil pores are filled with water and the soil oxygen levels are low. In general, denitrification can occur anytime the soil is flooded. Contrastingly in high-clay soil, denitrification can occur even when the soil is only muddy or saturated but not flooded. The type of tillage management systems (conventional or no-till) had little effect on the N efficiency of the high-clay soils, as shown in various N rate studies. Water moves downward very slowly through high-clay soils, with some estimates ranging from 0.015 inch per hour, or about 1/3 of an inch per day, in a Fargo series soil.
High-clay soils in eastern North Dakota are further divided by their risk of early season N loss: high or low. For high-clay soils with a lower risk for N-loss, side-dress N is encouraged due to their susceptibility to denitrification; however, these soils have better internal drainage than those with higher risk, and growers might be able to achieve maximum economic yield with a larger portion of their total N applied preplant. high-clay soils with a higher risk for N-loss are likely to benefit from a side-dress N application before V8 most years. A table of recommended N rates for high clay soils in the low-risk category are provided in Table 15.33 and are imbedded into the North Dakota Nitrogen Calculator https://www.ndsu.edu/pubweb/soils/N_calculators/#.
The N rates specified in the high-risk recommendation tables for high-clay soils are the maximum rate that can be practically applied preplant and are based on a certain N cost and corn price. To apply enough preplant N in wet years in an effort to achieve similar yields to soils with a low loss risk for N-loss, would result in impractically high N rates, potentially greater than 400 pounds N per acre, which is not economically or environmentally responsible. The answer to achieving higher yields in high-risk N-loss loss soil is not to simply increase in rate, but instead, improve application timing. Application of up to half or more of the recommended N between the V6 to V8 growth stages of corn can greatly increase yield and N efficiency in wetter years. Considering the tendency of high-clay soil in wet conditions to have sticky or mucky characteristics beneath, the use of applying UAN (solution of urea and ammonium nitrate in water) using a coulter side-dress applicator is strongly encouraged. The recommended N rates for high-risk, high clay soils are in Table 15.34 and are imbedded into the North Dakota Nitrogen Calculator https://www.ndsu.edu/pubweb/soils/N_calculators/# .
Medium-textured in Eastern North Dakota include fine sandy loams, silt loams, loams, sandy loams, loamy sands and sands. Medium-textured soils with a low risk to early-season N losses are the most productive and N-efficient soils in the Eastern North Dakota conventional tillage category. Soils with a low risk for N loss do not warrant a side-dress application of N. However, medium-textured soils with a high risk for N-loss are considered the most N-inefficient soils in North Dakota studies. These soils are highly susceptible to N-loss by leaching and can benefit greatly from a side-dress application of at least part of their N. Soils in this category can be side-dressed using either an anhydrous ammonia applicator or coulter UAN side-dress applicator. Subsurface side-dress applicators allow for fertilizer to be applied in every other row, rather than every row. An alternative side-dress application can be made streaming UAN between each row; this method is very efficient the efficiency of this alternative is high except in drier years, where surface dryness leads to greater N inefficiency.
A riskier method of applying N to corn post-emergence is applying up to 100 pounds of urea (46 pounds of N per acre) broadcast over the whorl using either a granular ground or air applicator. The urea used in an over-the-top application should include NBPT impregnated onto the urea. The N rate recommendations for eastern medium-textured soils with low risk of early-season loss can be found in Table 15.35. The N rate recommendations for eastern medium-textured soils with a high risk of loss can be found in Table 15.36 and are embedded in the North Dakota Nitrogen Calculator https://www.ndsu.edu/pubweb/soils/N_calculators/#
Table 15.33 Corn N recommendation table for eastern high-clay soils with low risk of early-season N loss, considering maximum return to N using corn N price and N cost.
Table 15.34 Corn N recommendation table for eastern high-clay soils with high risk of early-season N loss, considering maximum return to N using corn N price and N cost.
Table 15.35 Corn N recommendation table for eastern medium-textured soils with low risk of early season N loss, considering maximum return to N using corn N price and N cost.
Table 15.36 Corn N recommendation table for eastern medium-textured soils with high risk for early season N loss, considering maximum return to N using corn N price and N cost.
Nitrogen recommendations for corn in the Langdon Region
There are separate N recommendations for the Langdon region of North Dakota for both long-term no-till and conventional-till fields (Table 15.37 and Table 15.38). The soils in the Langdon Region have a higher capacity to supply N to the corn compared to the rest of Central/Eastern North Dakota; this is attributed to the higher abundance of ammonium-rich shale in this region. The natural release of ancient non-exchangeable ammonium from the shale, results in the soils in the Langdon Region behaving as a kind of a “slow-release fertilizer” to the crops grown thereon.
Table 15.37 Corn N recommendation table for conventional-till fields in the Langdon Region of North Dakota, considering maximum return to N using corn N price and N cost.
Table 15.38 Corn N recommendation table for long-term no-till fields in the Langdon Region of North Dakota, considering maximum return to N using corn N price and N cost.
Nitrogen recommendations for irrigated corn
N recommendations are also provided for irrigated corn fields in North Dakota. These N rates are based on irrigated corn research conducted at Oakes, ND. The total N recommended for irrigated corn should be divided between the preplant, side-dress and any /all remaining applied N; all of which should be applied through the irrigation pivot (fertigation) up until tassel initiation. An additional 20 to 30 pounds of N can be applied if the yield conditions are exceptional after pollination; although no N is recommended through the pivot during pollination.
Table 15.39 Corn N recommendation table for irrigated soils, considering maximum return to N using corn N price and N cost. This is the total N rate for the season, which includes several split-N applications.
Use of active-optical sensors to help determine corn side-dress need and nitrogen rate
Fundamentals for active-optical sensor use
Various active-optical light sensors have been used in agriculture for about thirty years. For most people, of all the many active-optical light sensors, the data and imagery provided by passive light sensors are generally the most recognizable and familiar. A passive light sensor detects the reflection of visible light, and/or other potential kinds of electro-magnetic radiation, emitted by the sun or an artificial light source. Examples of passive light sensors include both aerial photographs/images and satellite imagery. By definition, an active-optical light sensor emits its own light in specific wavelengths, and measures the difference in intensity of the light reflected into the instrument compared to the light emitted. The type of active-optical sensors mentioned in this publication have the ability through modulated light pulses (similar to light-based UPC code scanners, such as the ones that scan product packages at the grocery store) that vary the length of on-off light emission. The function of the modulation pulses is to filter out any light that does not conform to the same modulation sequence as the emitter. Therefore, the measurements collected by the sensor are not influenced by any changes in sunlight intensity, cloud cover, passing clouds or nighttime, all of which could result in similar readings regardless of ambient light conditions. The only conditions that may result in inaccuracy or inconsistency in the sensors readings are leaf wetness from rain, recent irrigation or early morning dew.
The two active-optical sensors utilized in the NDSU corn N rate trials were the GreenSeeker™ (Trimble, Sunnyvale, California) and the Holland Scientific Crop Circle™ (Holland Scientific, Lincoln, Nebraska). The GreenSeeker and Crop Circle both have red and near-infrared light sources and sensors, with the Crop Circle also having an additional red edge light sources and sensors. Because the red, near infrared and red edge light sources all differed in wavelength between the GreenSeeker and Crop Circle sensors, the algorithms developed for each sensor were independent and non-interchangeable. The GreenSeeker uses a red 660nm wavelength sensor and a near infrared 770nm wavelength sensor. The Crop Circle red sensor has a red 670nm wavelength sensor, a near infrared 760nm wavelength sensor, and a. red edge760 nm wavelength sensor (the same as the near infrared) and a red edge band set at a wavelength of 730nm.
The side-dress N application algorithms were developed using N rate corn trial data collected across North Dakota from 2011 through 2021. These algorithms assumed that differences in N availability were the only factors that resulted in differences in corn yield in the studies.
Selecting the right algorithm will depend on the region of the state, the tillage practice, and soil texture category. North Dakota is divided up into the West River (everything west of the Missouri River) and Eastern North Dakota (everything east of the Missouri River) regions. Long-term no-till is defined in eastern North Dakota as a field under six continuous years of either no-till, strip tillage using a coulter (not discs), or shallow one-pass seeding. Any tillage deeper than two inches with an implement is considered conventional till, with the exceptions being strip-till or an anhydrous ammonia shank. A field under no-till immediately after conventional till is still considered conventional till until the field is under continuous no-till for at least six years. As mentioned previously, a high clay soil is a soil with more than 30% clay, and includes soils with a Bearden texture or greater clay concentration. Soils including: Fargo, Hegne, Viking, Bearden fall into this category. A medium-textured soil includes silt loams, fine sandy loams, loams, sandy loams and loamy sands.
To use an active-optical sensor for the purposes of site-specific N side-dress N application, an N-rich or N-sufficient area in the field must be established. If the soil test N within the field is less than 100 pounds N per acre down to a 2-foot depth, a variable rate base N rate should be applied so that the preplant N total is at least 100 pounds per acre. Adequate N applied preplant or at-planting is important because any supplemental application of N to healthy corn and sufficient in N will yield higher than supplementing N-deficient corn.
Zone soil testing in the field is strongly recommended prior to the base preplant/planting N application, unless the field has a recent history of manure application, at which point grid sampling is more practical. To use the sensor, a small area the width of the applicator and about 100 feet long should be selected. The area should represent the soil of zone, and the hybrid used in the zone. Splitting a planter with 2 hybrids is not recommended when using the sensor because different hybrids have different spectral signatures.
For the N-rich area, rainfall patterns between preplant N application and side-dress application should be noted; as they can result in significant N loss. If the N-rich area is on sandier soil, if a single rainfall event is more than 2 inches, some leaching of the preplant application may have occurred. Similarly, if the N-rich area is in a high clay soil, any rainfall that results in sustained moisture saturation of the soil between the preplant and sidedress applications, can lead to significant denitrification and gaseous N loss. In either case, supplementing the additional N to the N-rich/N-sufficient area may be required. At the time of sidedress, the accumulated growing degree days should be entered into the controlling computer unit. The growing degree days from planting can easily be found using the NDAWN corn growing degree tool, although the planting date is required https://ndawn.ndsu.nodak.edu/corn-growing-degree-days.html. This is necessary to standardize the data through the calculation of INSEY (in-season estimated yield). The INSEY is a standardizing number that allows the application date to be calculated by the algorithm within plus or minus two corn leaf stages.
$$
=
$$
Algorithms are available for the V6 growth stage; however, their use is valid from the V4 to V8 stage. When the applicator enters the field with the sensor or sensor array attached in front of the applicator unit, it first senses the N-rich, N-sufficient area. Then the average reading from the N-rich/N-sufficient area is entered into the spray controller. If the readings in the rest of the field are within 5% of the N-rich/N-sufficient area, then no supplemental N is required. If the reading is more than 5% less than the N-rich/N-sufficient area, the algorithm predicts the probable lower yield if no additional N is applied. The difference between yield predicted in the N non-limiting area and the yield predicted outside the N non-limiting area is used to calculate the N required to make up the yield difference, also referred to as the N rate, measured in bushels per acre.
$$ = × 56 × 1.25%
$$ The efficiency factor usually used for an in-soil application, such as anhydrous ammonia or coulter-applied UAN, is 0.6
The efficiency factor recognizes that supplemental N is never 100% effective. A post-emergence application is the most efficient application at an estimated 60% efficiency (as long as there is rainfall within a few days of application if the N is surface applied, or if the N was subsurface-applied with a coulter or shank). If the surface application was followed by a considerable stretch of dry weather, an efficiency value of 0.2 would be a better estimate of its efficiency.
Additional considerations when using an active-optical sensor for corn or other crops
###### Poor sensor values unrelated to N nutrition and not fixable with supplement N It is possible for some field areas to have a poorer plant stand, are bare, or have poor growth due to high salts or other nutrient problems. In each algorithm table, there is a column titled “minimum INSEY for N rate.” The controller should be programmed so that if the INSEY is below the suggested minimum value, then no N is applied. ###### Sulfur deficiency interference If the INSEY value is lower in the N-rich/N-sufficient area than in other field areas, the reason is likely due to sulfur deficiency. Application of a soluble sulfate or thiosulfate fertilizer should be applied as soon as this condition is evident. Once the sulfur is taken up by the corn, the N-rich/N-sufficient area will exhibit similar greenness or be greener than the rest of the field, depending on field N availability status.
Programming a minimum nitrogen rate
Some growers may choose to program a minimum rate of side-dress N into the algorithm even if there is less than 5% difference between the field reading and the N non-limiting area. A value of 30 to 50 pounds N per acre would be a reasonable value for a minimum N rate, considering the inherent variability across most fields. A minimum INSEY for N rate is required because any INSEY values below this minimum at the growth stage indicated only appear if the stand is poor or the corn is suffering from another non-N related issue.
Table 15.40 Algorithm inputs for the use of GreenSeeker and Holland Scientific Crop Circle sensors in North Dakota corn yield prediction and for use in directing N rates for side-dress N application
Example of corn side-dress N algorithm calculation in conventional-till fields:
Yield predicted in N non-limiting strip = 120 bushels per acre In-field yield estimated = 60 bushels per acre Difference between N non-limiting yield prediction and the in-field yield prediction 60 bushels per acre X 56 pounds per acre = 3,360 pounds corn per acre difference if no N is applied 3,360 pounds corn per acre X 0.0125 pounds N per pound of corn = 42 pounds N per acre 42 pounds of N deficiency divided by 0.6 efficiency factor = 70 of N per acre required at that location
Example of corn side-dress N algorithm in long-term no-till fields
The algorithm formulas for long-term no-till relate relative sensor INSEY to relative yield, not to the actual values. You calculate the INSEY using the value from the N-rich/N-sufficient area as the denominator and the real-time-field INSEY values as the numerators, and then multiplying by 100 to get percent. The resulting values can range anywhere from zero to 100%. The relative yield is the percent yield. This value is up to the user depending on their yield history and any other factor that they think might influence the yield that current season.
Example Algorithm: - Relative yield of N-sufficient area = 100% - Relative yield of example field area = 80% - Relative yield difference 100% - 80% = 20% - Estimate of yield based on the season and past field history: 180 bushels per acre $$
$$
\[ \begin{aligned} \text{Yield difference is } 180 \text{ }x \text{ }0.2 = 36 \text{ bushels per acre} \\ 36\text{ bushels/acre} \times 56\text{ lb/bushel} &= 2,016\text{ lb grain yet to achieve} \\ 2,016\text{ lb grain} \times 0.0125\text{ N in grain} &= 25\text{ lb N in achievable yield} \\ \frac{25\text{ lb N}}{0.6\text{ efficiency factor}} &= 42\text{ lb supplemental N needed for the area} \end{aligned} \]
15.10.6 Nitrogen for Dry Bean (pinto, navy, pinks, blacks, other)
![Figure 15.59] (Pics_and_Figs/Chp_15_figs/59.png)
Nitrogen nutrition is important to dry bean production, to both sustain high yields, and due to quality concerns. Excessive N can delay maturity and encourage excessive leaf canopy growth, leading to increased disease incidence and severity depending on the year. Both maturity delays and increased disease risk may lead to a reduction in overall quality and consequently a reduced market price for growers.
Dry bean growers across the state of Nork Dakota are typically are not novices, and have most likely have been growing dry beans in their rotation for a long time. For that reason, most dry bean growers understand which N fertilization strategy works best for them in their area and their soils.
Dry bean growers in North Dakota have used four N fertilization strategies effectively in the past, depending on their soils and their experiences:
- No inoculation or supplemental N required
- Seed inoculation using an N-fixing bacteria inoculant at seeding
- Seed inoculation with an N-fixing bacteria and supplemental N
- Supplemental N only
Soils with coarse to medium textures, organic matter levels greater than three percent, and have been in a dry bean rotation for many years typically do not require additional inoculation, nor supplemental N fertilization. These soils encourage natural inoculation from legacy N-fixing bacteria, present in the soil from the many previous years’ bean crops. The efficiency of this bacterium is so great that they will provide all the N requirements of the dry bean without additional assistance. These dry bean acres make up a minority of the total dry bean acreage across the state, however, for individual growers, they are important. Inoculation is inexpensive compared with supplemental N fertilizer. The N-fixing bacteria for dry beans of any kind is Rhizobium leguminosarum biovar phaseoli. However, some soil and environmental conditions can limit the effectiveness of the inoculants. For example, a combination of hot weather and wet soils can result in almost total nodule abortion. Consequently, in areas that tend to be hot in June, such as west of Jamestown and along the Missouri River, inoculation may not result in consistently high yields compared with applying supplemental N. Likewise, if fields contain significant areas of fine-textured/clay soils, inoculation may also not result in adequate yields in wet years. Overall, inoculation is more effective in medium- to coarse-textured soils that are well-drained and under cooler conditions typical to the northern half of the state. Seed purchased for planting in a first-year dry bean field should always be inoculated.
Since the mid-1990’s, more than 30 site-years of dry bean trials have been conducted by various researchers across North Dakota and northwestern Minnesota. the return to N in inoculated and non-inoculated trials was determined using an N cost of 30 cents per pound of N and a dry bean price of 20 cents per pound (or a cost price ratio of 1.5), (Figure 15.60).
However, some soil and environmental conditions can limit the effectiveness of the inoculants. For example, a combination of hot weather and wet soils can result in almost total nodule abortion. Consequently, in areas that tend to be hot in June, such as west of Jamestown and along the Missouri River, inoculation may not result in consistently high yields compared with applying supplemental N. Likewise, if fields contain significant areas of fine-textured/clay soils, inoculation may also not result in adequate yields in wet years. Overall, inoculation is more effective in medium- to coarse-textured soils that are well-drained and under cooler conditions typical to the northern half of the state. Seed purchased for planting in a first-year dry bean field should always be inoculated.
Since the mid-1990’s, more than 30 site-years of dry bean trials have been conducted by various researchers across North Dakota and northwestern Minnesota. the return to N in inoculated and non-inoculated trials was determined using an N cost of 30 cents per pound of N and a dry bean price of 20 cents per pound (or a cost price ratio of 1.5), (Figure 15.60).
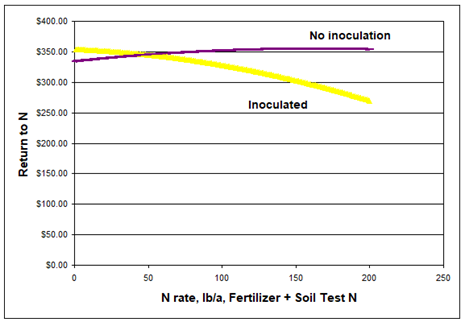
None of the inoculation trials showed any benefit for N rates greater than 40 pounds N per acre, including residual soil nitrate from soil testing. Non-inoculated trials peaked at about 100 pounds N per acre; however, any N fertilization rates in excess of 70 pounds N per acre provided little additional economic advantage. To prevent an increase in the risk of delayed maturity and an increased incidence and severity of white mold disease an application of 70 pounds N per acre rate would be more effective than the 100 pounds per acre rate. The most economic rate was calculated based on relative yield; meaning the yield goal is not scaled when calculating the optimal N rate in dryland production of dry bean. In the years where the environmental conditions favor higher yields, the same conditions also stimulate greater N mineralization from the organic matter and crop residues (and perhaps from release of non-exchangeable ammonium from soils rich in smectitic clays) resulting in higher overall N availability to support higher yields.
N recommendations for dryland dry bean
Inoculated
Up to 40 pounds N per acre less soil test nitrate-N to 2 feet in depth and previous crop N credits
Non-inoculated
Up to 70 pounds N per acre less soil test nitrate-N to 2 feet in depth and previous crop N credits
In the Langdon area, reduce N rates by 20 pounds N per acre. In any long-term no-till soils (6 years or more of continuous no-till, shank strip-till, and/or shallow one-pass seeding) reduce N rates by 20 pounds N per acre.
Irrigated dry bean production
Most irrigated dry beans are grown on well-drained, coarser-textured soils. Inoculation has not been found to be adequate to support the very high yield potentials of these fields, especially high-yielding cultivars such as navy bean. Therefore, supplemental N is critical to achieve the high yield potential of these irrigated fields. Not only is supplemental N encouraged, but splitting applications to increase efficiency and prevent nitrate leaching also is strongly recommended. The rate of N for irrigated dry beans is 150 pounds N per acre, with any supplemental N beyond the 150 pounds N per acre rate directed by leaf analysis. The 150 pounds of N per acre rate includes preplant soil test nitrate-N and any previous crop credits. A small preplant application, of up to 40 pounds N per acre, is also advised. The first supplemental N application can be side-dressed before vining, with any subsequent applications being applied through the irrigation system and completed before top pod fill begins.
15.10.7 Nitrogen for Flax
Flax does not require the same aggressive fertilizer N strategy such as the one used for both wheat and corn production. Although flax yield increases are possible in response to applied N, other factors are often more important than the N rate. Excessive N rates can actually reduce yield by stimulating more vegetative growth, resulting in a greater susceptibility to both disease and lodging. Yield and N rate are also typically not related across locations, so the rate of 80 pounds of N per acre is valid for both high-yielding and lower productivity fields. The N rate should be reduced by another 30 pounds N per acre if the field has been in a continuous no-till production system for six years or more. If the flax is being grown in the Langdon area, the N rate should be further reduced by another 30 pounds N per acre.
Table 15.41 Summary of N rate studies at Carrington and Langdon, 2001-2003.
15.10.8 Nitrogen for Grass Hay and Forage, Tame Grasses, Established Grasses, Irrigated Grass Hay, but not Native Range
The recommended N rate for tame grass forage and hay is 50 pounds of N per acre. This assumes that the soil test nitrate-N values down to a two-foot depth, are no more than 20 pounds per acre. All the recommended N should be applied in the early spring, and if the N fertilizer is urea, it should be treated with NBPT (effective urease inhibitor) at the proper rate. UAN applied using a stream-bar does not need to be treated with NBPT.
15.10.9 Nitrogen for Legumes: Field Pea, Soybean, Chickpea and Lentil
If field pea, chickpea, lentil and soybean are properly inoculated, there will be no need for supplemental N application. The inoculant requirements are legume specific: - Field pea and lentil inoculant – Rhizobium leguminosarum - Chickpea inoculant – Mesorhizobium cicer - Soybean inoculant – Bradyrhizobium japonicum
Soybean planted into a soil with no previous history of soybean, often requires a ‘double inoculation’. This means that the grower should apply a granular inoculant into the seed furrow along with also treating the seed with a peat-based inoculant formulation or a liquid inoculant formulation. Double inoculation can greatly reduce the chance of equipment or calibration problems that might result from poor seed inoculation and as a consequence result in reduced yield. Also in soybean, once a soybean crop shows inoculation success, there is no need to perform any subsequent inoculations, as long as the next soybean crop is planted within 4 years of the initial successful inoculation. Yearly inoculation does not harm the soybean, but there is no economic advantage in doing so. Using ‘enhanced inoculant strains’ has shown no consistent economic gains in any NDSU research. The new strains have to compete in an already bacteria-filled environment, and may not have gained dominance in the NDSU studies.
Table 15.42 Carrington enhanced inoculant study on soybean (Henson, 2003)
15.10.10 Nitrogen for Millet
The N recommendation for millet is 80 pounds N per acre. Subtract soil test nitrate-N from 2 feet in depth along with any previous crop credits from the 80 pounds N per acre gross N recommendation. If the millet is being grown in the Langdon area, subtract 30 pounds N per acre. If millet is grown on a field under long-term no-till management (6 years or more continuous no-till, shank strip-till, and/or shallow one-pass seeding), subtract 30 pounds N per acre.
15.10.11 Nitrogen for Mustard
Nitrogen recommendations for mustard are similar to canola. - For the cooler and more moist parts of the state the N rate recommendation is 150 pounds per acre. - For the warmer and drier parts of the state, the N rate recommendation is 120 pounds per acre.
15.10.12 Nitrogen for Native Range
No supplemental N is recommended for native range.
15.10.13 Nitrogen for Oat
The N recommendation for oats in North Dakota is 120 pounds N per acre, which includes residual nitrate-N to 2 feet in depth, previous crop credits, no-till credits and any other credit. From the gross N recommendation, subtract the nitrate-N from 2 feet in depth and along with any previous crop N credit. If the oats are being grown in the Langdon area, subtract another 30 pounds N per acre. If the oats are being grown under long-term no-till management (6 years or more continuous no-till, shank strip-till, and/or shallow one-pass seeding), subtract 30 pounds N per acre.
15.10.14 Nitrogen for Potato
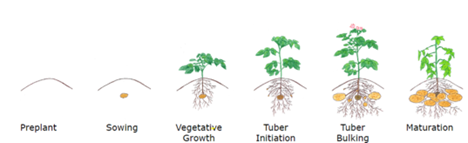
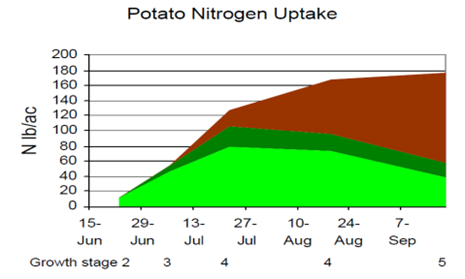
Table 15.43 Nutrients contained in potato vines and total tuber yield. (Franzen et al., 2021)
Nitrogen recommendations for potato
North Dakota N recommendations are based partly on soil testing to a depth of 2 feet in the fall (or spring) prior to potato production. Potatoes are produced on a wide variety of soils across the state. Soil sampling on sandy loam or coarser soils is best conducted in early spring because snowmelt or early spring rains can result in the leaching of any residual nitrate below the potato rooting zone. Potato is overall a relatively shallow-rooted crop, with few roots below a depth of 2 feet. In loam- and finer-textured soils, fall soil sampling provides the most benefits. In addition, any previous crops should be considered. An exception to this is any annual legumes or sugar beet leaf color credits, as they do not contribute N to the potato crop directly or indirectly. The N credit values in Tables 15.18, 15.19 and 15.20 should be considered when determining fertilizer N rates. The previous crop credit is necessary because the N expected to be available after these crops will not yet be seen in a fall or early spring soil test analysis. Potato production is further complicated due to the artificial vine kill methods used in potato production destined for any of the various fresh markets; This is due to the unique nutrient requirements of the different potato varieties commonly used across the region. The following recommendations (Table 15.44 and Table 15.45) are split-up between irrigated (with different vine-killing dates and varieties) and dryland potato production. Any N-rates applied in excess of those recommended may result in excessive amounts of vine growth at the expense of tuber production, delayed maturity, increased brown center, and an increased incidence of knobby, misshapen and hollow tubers. Inadequate N can result in the plants being more susceptible to early blight, verticillium and other diseases. Petiole analysis is a practice that will help make sure that N is adequate through the season so that any “insurance N’” application is not necessary.
Nitrogen application timing in potato
- Early season varieties -Apply a banded starter at planting. -Apply one-third to one-half of the recommended N near the time of emergence. -Apply the remainder of N at final hilling. -Apply additional N if fertigation is possible, based on petiole testing and harvest date.
- Mid- to late-season varieties -Apply a banded starter at planting. -Apply one-third to one-half of the recommended N near the time of emergence. If fertigation is not available: -Apply the remainder of N at final hilling. If fertigation is available: -If final hilling is performed 10 to 14 days after emergence, apply one-third of the recommended N at final hilling and fertigate the remainder based on petiole analysis. -If final hilling is performed at emergence, begin fertigation 14 to 21 days later and apply the remainder of recommended N based on petiole analysis.
Additional considerations for nitrogen application to potato
- Avoid the use of nitrate-containing fertilizers in sandy soils at planting due to leaching hazard.
- Do not apply high amounts of ammonium-containing fertilizers close to the seed piece, especially in soils with a pH greater than 7, due to the potential for ammonia toxicity.
- N leaching may be reduced by using a poly-coated urea such as ESN.
Table 15.44 Nitrogen rates in full-season harvest potato under dryland conditions.
Table 15.45 Nitrogen rates for Irrigated potato based on variety and date of vine-kill.
15.10.15 Nitrogen for Rye: winter rye, grain or seed
Areas of low productivity $$ - = 100
$$
Areas of medium productivity \[ \text{(Yields 40 to 60 bushels per acre)} - \text{Total available N} = 150 \text{ pounds per acre}\]
Areas of high productivity \[ \text{Yields greater than 60 bushels per acre - Total available N} = 200 \text{ pounds per acre} \] \[ \text{Total available N = Soil test nitrate 2 feet + Previous crop credit + Fertilizer N }\]
In Langdon area, subtract 30 pounds N per acre. For long-term no-till fields, subtract 50 pounds N per acre.
15.10.16 Nitrogen for safflower
Safflower is grown for oil, and as such the oil concentration decreases with an increasing N rate. Safflower is also susceptible to diseases whose severity may increase with N rate. Safflower seed yield may also suffer from excessive N due to the tendency for N to stimulate vegetative growth instead of seed yield in Safflower. The gross recommended N rate for safflower in North Dakota is based on research in western North Dakota and Montana, and is set at 80 pounds N per acre. From the gross recommended N rate, the nitrate-N to 2 feet in depth is subtracted, along with any previous crop credits. It is unlikely that safflower would be grown in the Langdon area, but if it is, the N rate should also be reduced by 30 pounds N per acre. If safflower is grown in a long-term no-till managed field (6 years or more continuous no-till, shank strip-till and/or shallow one-pass seeding), the N rate should be reduced by 30 pounds N per acre.
15.10.17 Nitrogen for Silage Corn
The nitrogen rate for silage corn is around 180 pounds N per acre, less soil test N to 2 feet in depth, less previous crop credits. If the silage corn is being grown in the Langdon area, the rate should be 30 pounds N per acre less. If the silage corn is being grown in a long-term no-till management system (6 years or more continuous no-till, shank strip-till, or shallow one-pass seeding) apply an N credit of 50 pounds per acre.
15.10.18 Nitrogen for Grain Sorghum, and Sudangrass
Grain sorghum is a minor crop in North Dakota and is also grown in areas of the state that tend to be both prone to drought, and areas where corn may struggle in some years. The N rate recommendation is 80 pounds of N per acre less soil test nitrate to 2 feet in depth and any previous crop N credit (the N rate recommendation already assumes that the sorghum is grown under long-term no-till management). If the sorghum is in fact being grown under conventional tillage, then 40 pounds of N should be added to the gross N recommendation in order to provide a total gross N rate of 120 pounds N per acre.
15.10.19 Nitrogen for Sugarbeet
Importance of nitrogen for tonnage and sugar concentration
Sugarbeet growers across the region are paid based on the tons of recoverable sucrose that is extracted from their crop. Sugar beet profitability therefore depends on producing a high tonnage crop that is also high in sucrose percentage. Nitrogen (N) management is an important key to accomplishing this goal. Nitrogen deficiency leads to poor leaf canopies, premature yellowing and low tonnage yield. Grower payments are based on tons of sucrose delivered to the processor less impurities, such as nitrate grade, amino-N content and excess potassium. Excessive nitrogen can result in both a reduced sucrose percentage and a higher nitrate grade and amino-N impurities (Table 15.11.20.1). Good nitrogen management is necessary not only in the year in which sugar beets are grown, but also during the rest of the rotation, so that soil N values are not excessively high going into the sugar beet growing year.
Table 15.46 Reduction in sugar content of sugar beet with increasing N availability. (Adapted from Smith, 1984). Studies conducted more recently using modern sugar beet cultivars support this relationship.
Nitrogen (N), as well as phosphorus (P) and potassium (K) recommendations are not based on yield goals. Since the time the recommendations were published in 2003, sugarbeet yields in certain fields have now exceeded 30 tons/acre, with some fields even exceeding 40 tons per acre using the above N recommendations. Recent studies have reexamined the N recommendations using modern cultivars and farming methods and found that the recommended rates are still sufficient for high yield and high sugar concentration (Tarkalson et al., 2023). Historically, soil sampling depth has been recommended to 4 feet in depth; however, in fields where sugar beet has previously been grown and sugar beet quality is high, the chance of high nitrate at depths below 2 feet is low. Therefore, except in fields new to sugar beet or in fields with a recent history of low sugar beet sucrose concentration, soil sampling depth can be 2 feet in depth instead of the previously recommended 4-foot depth. Soil sampling may be conducted immediately following small grain harvest. If taking a 4-foot-deep core, and the 0–2-foot nitrate-N is less than 65 pounds N per acre, enough N should be applied regardless of the total nitrate-N value in the entire depth to achieve a 65 pounds N per acre value.
Any organic matter N that may be released via mineralization is already factored into this recommendation. Previous manure applications will decrease the amount of N required as supplemental fertilizer. To do this, determine the N content of manure and an estimated rate of release found in various University of Minnesota or NDSU circulars. Given the unpredictability of N release from manure, it is best if the manure is not applied immediately prior to sugar beet production. If the manure was applied in the sugar beet production year, a strip of enhanced N rate should be applied for a comparison in case the N released is less than anticipated due to either excessive rainfall or drought. N recommendations should also be adjusted based on any and all previous crop credits, shown in Tables 15.18, 15.19 and 15.20. However, seeding sugar beet after alfalfa or sweet clover is not recommended due to the uncertainty of the N that can be released from these residues.
For sugar beet, a fall N application can be effective, except when they are being grown on either sandy loam/coarser textured soils, or soils near river floodplains with a high-water table soil. Application of fall anhydrous ammonia should be delayed until October 1 at the earliest, and then only when the soil temperature measured at the 4-inch soil depth between 6AM and 8AM reaches 50 F. This date/temperature recommendation is still not a guarantee that no nitrification will occur, but based on the historical data, it can greatly reduce the risk. Any application of N too early can greatly increase the risk of the N being converted to nitrate before winter, which consequently can increase the early spring losses of N due to leaching, runoff and denitrification.
Any subsurface-banded applied urea should be delayed at least a week after the conditions become favorable for an anhydrous application. Broadcast and incorporated urea applications should be delayed a further two weeks following the acceptable anhydrous ammonia application date. Any of the previously mentioned applications can be split on acceptable soils between fall and spring.
Applying N via a side-dress N application has become more common in this sugar beet production area in recent years, mostly stemming from its increased use in corn production. In soils with little risk of in-season N loss, side-dress applied N is a greater risk to production than a preplant N application due to the risk reduction in sugar concentration. However, there are studies that have been conducted on high clay soils with high spring rainfall where a side-dress N application at V6, resulted in higher sugar beet tonnage and sugar production. Comparison of sugarbeet growth and leaf color in a strip with the planned side-dress rate of N applied in a strip with the preplant fertilizer compared to the rest of the field can be a good indicator of whether the side-dress N is required or not. Although the yellowing of the sugarbeet canopy during the growing season may be related to N, it could also be related to incidence/severity of disease, K deficiency, S deficiency, or excessively wet or dry conditions. The N-enhanced strip can help a grower determine their in-season N status, because the N-enhanced strip is also subjected to a similar environment as the rest of the field and any non-n related yellowing will be present there as well.
Nitrogen rate recommended for sugarbeet grown in the Red River Valley of Minnesota and North Dakota
See University of Minnesota N recommendations for sugar beet if grown in the Minnesota River Valley https://extension.umn.edu/crop-specific-needs/sugarbeet-fertilizer-guidelines
\[ \text{If soil samples are taken 0-2 feet in depth - Gross N recommended = 100 pounds N per acre}\] \[ \text{If soil samples are taken 0-4 feet in depth - Gross N recommended = 130 pounds N per acre.}\]
The N rate is the Gross N recommended less soil test N, less any previous crop credits (see Tables 15.18, 15.19 and 15.20). The N release following alfalfa and sweet clover are uncertain, so it would be unwise to follow these hay/forage crops with sugarbeet.
Site-specific nitrogen considerations for sugarbeet
Sugarbeet growers have been leaders in site-specific nutrient application for over twenty years. In 2016, 53.6% of American Crystal Sugar Company sugarbeet growers used site-specific nutrient application in their production. In addition, a sizable percentage of sugarbeet grower acres are screened for possible site-specific N application using a composite soil test. If the composite soil test is less than a certain value, the probability of an economic return from a site-specific N application is low, so zone sampling and site-specific N application is not pursued. If the composite soil test is greater than that value, zone sampling is then conducted, followed by site-specific N application. Sugarbeet growers who utilized site-specific realized an average of $48 per acre more (compared to their neighbors who did not), over the past 10 years.
Sugarbeet leaf color has also been used to adjust N rates site-specifically for the N-requirements of the subsequent crops in the rotation, such as spring wheat. At harvest, green sugar beet leaf color can result in up to 80 pounds N per acre being released to the next crop; yellow-green sugar beet leaf color can release up to 30 pounds N per acre, and yellow leaves will release 0 pounds N per acre.
Soil sampling for site-specific nutrient application is almost always best using a zone sampling approach. This approach is detailed in NDSU circular SF 1176-2 and SF 1176-3
A few consultants use a grid sample approach with a 1-sample per acre density when exploring a new field, but this sampling density is expensive to perform regularly, and once a zone pattern is found, there is no practical need for such a dense soil sampling grid. Exceptions to this would be any heavily manured fields or fields that have been subjected to high buildup P and K fertilizer. Considering the P and K values in these fields are mostly high, they would be better explained using a 2.5-acre grid, but the N soil test values should still be sampled using a zone strategy.
To sample within a zone:10-20 soil cores should be thoroughly mixed and enough soil subsampled from the container to ensure it adequately represents the soil in that zone. Soil cores in high clay soil fields might have to be dried and ground before subsampling due to the difficulty in mixing the muddy or resistant soil cores thoroughly enough to ensure that any subsample truly represents the soil across the entire zone.
Fertilizer N forms for use in sugarbeet
Most sources of fertilizer N are appropriate for use in sugar beet production. The exceptions to this being: any spring urea rates should not exceed 100 pounds N per acre or stand reductions are possible, and the use of poly-coated urea products, such as ESN™ (Agrium Ltd) is discouraged because the potential later release of the N may reduce sugar concentration.
15.10.20 Nitrogen for Sunflower: Confection Sunflower and Oil-Seed Sunflower
North Dakota sunflower recommendations are regionally-based and tillage-based.
If practical, any new fields intended for sunflower production should be sampled down to a 4-foot depth to determine if any deep N should be considered in N fertility recommendations. About 30 pounds of N from the 2 to 4-foot soil depth is assumed but not subtracted from the N recommendations. If the 2- to 4-foot soil nitrate test is greater than 30 pounds N per acre, then the extra N should be subtracted from the total N recommendation.
If deeper soil sampling is not practical, an N-rich area with the full rate of N based on the N calculator or the N recommendation tables applied should be established, and about half the calculated N rate should be applied to the rest of the field. An active-optical sensor or “best-guess” assessment of color and vigor differences between the N nonlimiting area and the rest of the field can be used to make the decision whether or not to apply additional in-season N. Any in-season N can be made between stage V-8 to R1 (approximately V12 to V14) using a side-dress applicator or a high-clearance applicator (Figure 1). In fields without a history of sunflower, sugarbeet or another deep-rooted crop such as safflower, no additional N needs to be applied.
In past studies, differences in soil texture, such as clay compared to sandy, had less of an effect on the yield of sunflowers compared to other crops like corn (Schultz et al., 2018); attributed in part to the deeper rooting nature of sunflowers. A study that was conducted focused on fields planted with sunflowers for the first time (ever or at least more than 30 years, revealed that if no deep-rooted crops such as sugar beets or sunflowers, had been grown within the past five years, there was a very slight, if any, yield response to additional N. The oil content also tended to be near or below 40 percent, even if zero N was added (Schultz et al., 2018). This would only be possible if these locations had some unaccounted-for deep N. The western North Dakota sites that were not planted to sunflower for at least five years, all experienced a major drought in 2012, followed by relatively wet seasons in 2013-2015, which may have moved any N downward in the soil. Hence the sunflower crop of 2015, could have tapped into this deeper N reserve, resulting in no yield increase even with higher N rates and relatively low oil content in the seed. Any sites in eastern North Dakota without a history of sugar beet or sunflower in recent memory likewise did not show an increase in yield with the application of higher N rates and had oil content that, even at the zero N rate, was below 40 percent.
For sunflower production, soil sampling to at least 2 feet in depth is very important for N recommendations across the region. When the soil test nitrate-N was included into the N rate vs sunflower yield trials, the relationship of total known available N compared to relative yield was greatly increased for all regions.
There are differences in the response of sunflower in Eastern North Dakota compared to those in Western North Dakota (Figure 15.63). In addition, the Langdon Region is segregated from the rest of Eastern North Dakota due to the small shale pieces the soil in this region contains. These shale pieces are a potential source of mineralizable, plant-available ammonium, causing these soils to act as a type of “natural slow-release N fertilizer”. The N recommended in the Langdon Region is therefore, less than in the rest of the Eastern Region.
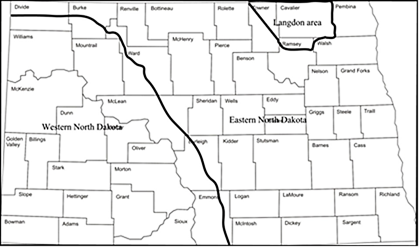
Long-term no-till sites, continuous no-till for at least 6 years, required less N to achieve the maximum economic yield compared to the sites under conventional tillage. Similar results have been recorded in spring/durum wheat and in corn, whose recommendations also contain reduced N rates for long-term no-till management.
Some harvest losses are likely with lodging, so the upper values of N rate were reduced to limit the risk of lodging. Although white mold and downy mildew seemed to also be related to N rate in experiment observations, only one site was rated for disease in each treatment. This site, north of Dickinson, N.D., was rated at harvest for sunflower rust, which is caused by the fungus Puccinia helianthi. The results of the rating are available in Table 15.47.
Table 15.47 Sunflower rust severity rating due to N rate, Dickinson, N.D., 2015.
Excessive wind resulting in sunflower root lodging or stalk breakage does not happen in every sunflower field every year, but lodging is ever present concern for most sunflower growers. Multiple research sites were affected by wind each year, and lodging severity was directly related to the N rate (Figure 15.64). Although in the N rate experiments all heads were included in yield, sunflower, growers suffer a decrease in harvest efficiency when the sunflowers are on or near the ground. Therefore, the N rate is capped, despite the possibility of there being small increases in yield and marginal profits with greater N rates in any nonwind-affected growing season.
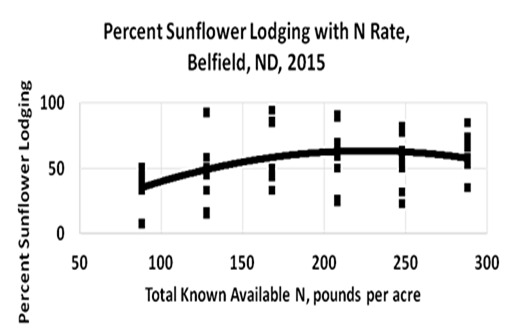
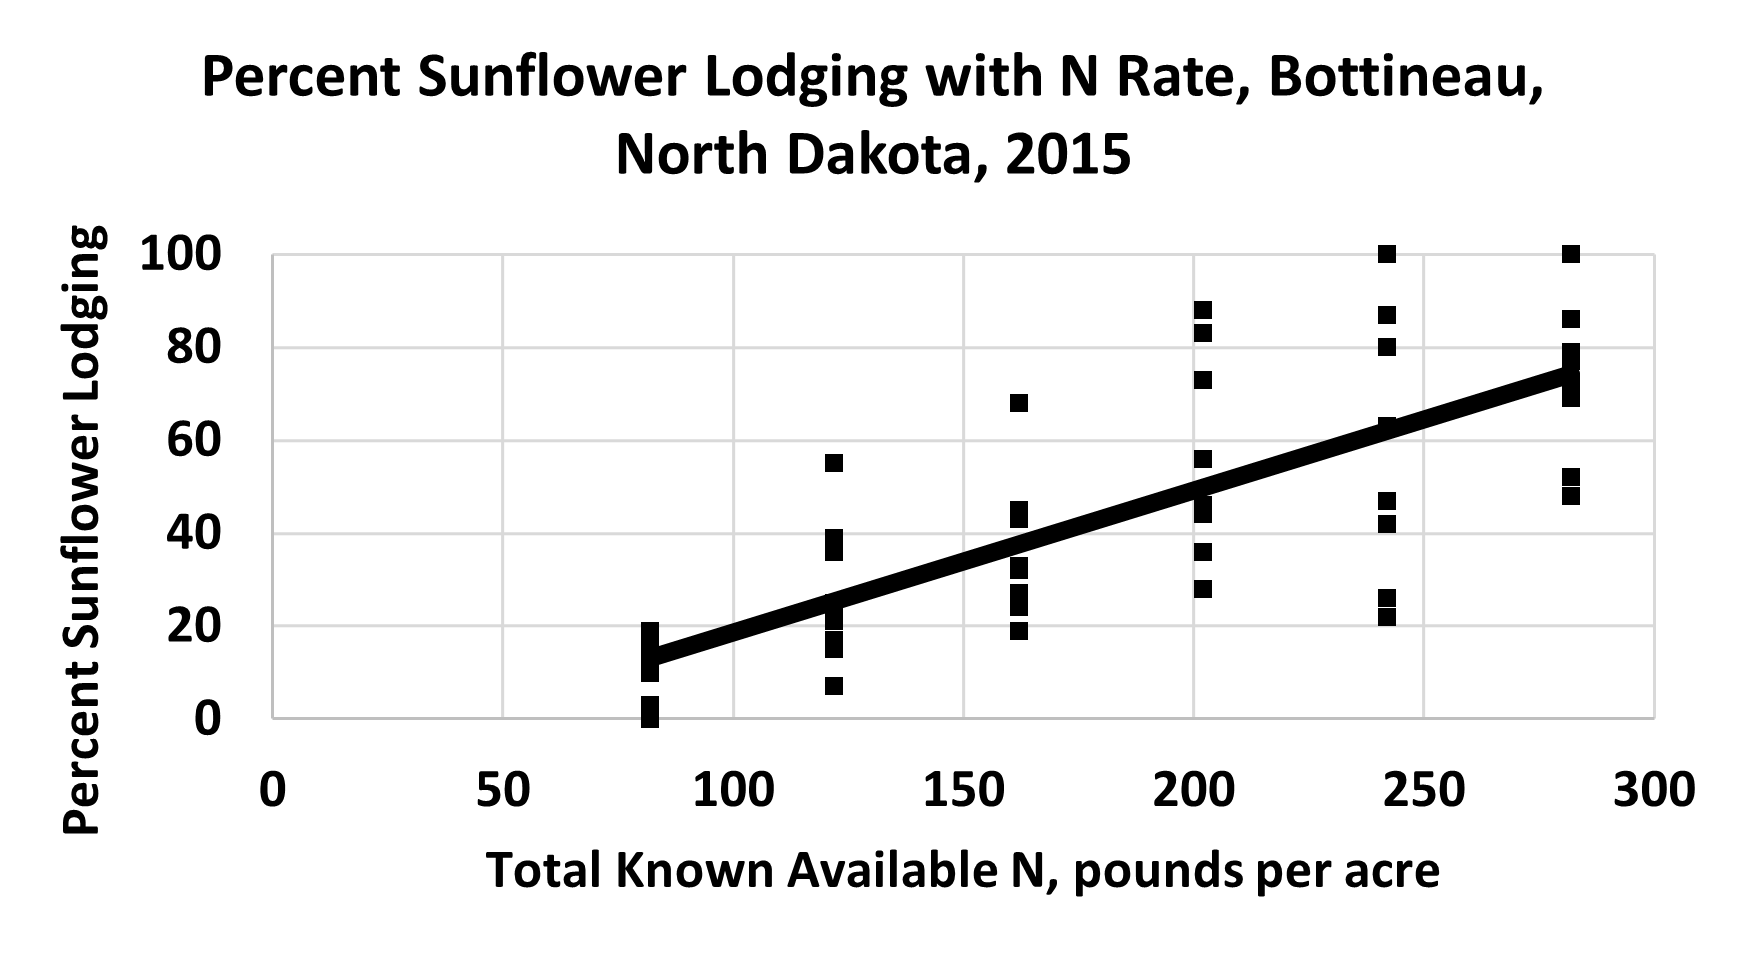
Seed oil content of oil-seed sunflowers always decreased as the N rate increased, regardless of the yield response. The economic impact of the total available soil N on yield and seed oil is factored into each N recommendation, along with the cost of N. Highest N rates are moderated due to possible harvestable yield reduction due to lodging. The N rate recommendations are available in Tables 15.48 – 15.59.
Table 15.48 Eastern Region conventional tillage confection sunflower N recommendations based on N cost and sunflower price.
Table 15.49 Eastern Region conventional tillage oilseed sunflower N recommendations based on N cost and sunflower price.
Table 15.50 Eastern Region long-term no-till oilseed sunflower N recommendations based on N cost and sunflower price.
Table 15.51 Eastern Region long-term no-till confection sunflower N recommendations based on N cost and sunflower price.
Table 15.52 Langdon Region conventional tillage, confection sunflower N recommendations based on N cost and sunflower price.
Table 15.53 Langdon Region conventional tillage, oilseed sunflower N recommendations based on N cost and sunflower price.
Table 15.54 Langdon Region, long-term no-till confection sunflower N recommendations based on N cost and sunflower price.
Table 15.55 Langdon Region, long-term no-till oilseed sunflower N recommendations based on N cost and sunflower price.
Table 15.56 Western Region long-term no-till confection sunflower N recommendations based on N cost and sunflower price.
Table 15.57 Western Region long-term no-till oilseed sunflower N recommendations based on N cost and sunflower price.
Table 15.58 Western Region conventional tillage, confection sunflower N recommendations based on N cost and sunflower price.
Table 15.59 Western Region conventional tillage, oilseed sunflower N recommendations based on N cost and sunflower price.
15.10.21 Nitrogen for Sweet Corn
The nitrogen rate for sweet corn should be 150 pounds N per acre, less soil test N to 2 feet in depth, and less previous crop credits. If the sweet corn is being grown in the Langdon area, the N rate should be reduced by 30 pounds N per acre. If the sweet corn is being grown under long-term no-till management system (6 years or more continuous no-till, shank strip-till, or shallow one-pass seeding) there is an additional N credit of 50 pounds per acre.
15.10.22 Nitrogen for Wheat: Hard Red Spring Wheat and Durum Wheat
Importance of nitrogen for wheat grain protein and yield
Growers of spring wheat and durum are paid based on both the total bushels of grain delivered and the overall quality. In spring wheat, quality is usually set at a market protein level of 14%. Both the premium for delivering greater than 14% protein and the dockage from delivering less than 14% is different every year. premiums are related to domestic wheat protein in the hard red winter wheat growing areas of the Great Plains and other domestic and world-wide factors. NDSU N recommendations calculated using the Nitrogen Calculator, consider both yield and protein into their economic production functions. Greater than 14% protein is calculated at 25 cents per % per bushel, while less than 14% protein is calculated at 50 cents per % per bushel. In durum wheat, factors of quality include protein concentration and percent vitreous kernels. Vitreous kernel percentage is largely related to protein content, so similar N calculator parameters are assumed for determining economic N rate for durum and spring wheat.
Economic considerations within the Nitrogen Calculator construction
For purely economic practicality, within each region, wheat/durum productivity categories are defined. The N recommendations for other crops do not include productivity categories. That is because wheat is grown almost everywhere in the region, regional farmers are more selective when growing crops that are more expensive to grow or have obvious barriers to yield based on their soil properties. It is common, for example, to grow wheat near Bowman, ND, where a 30 bushel per acre crop would be a good crop, whereas, if 30 bushels per acre were grown in northeast ND, the insurance company would be called in.
The spring wheat/durum productivity categories represent the achievable yield, N non-limiting, in most years: - Langdon Region - Low = less than or equal to 40 bushels per acre - Medium = 41-60 bushels per acre - High = greater than 60 bushels per acre
- Eastern Region
- Low = less than or equal to 40 bushels per acre
- Medium = 41-60 bushels per acre
- High = greater than 60 bushels per acre
- Western region
- Low = less than or equal to 30 bushels per acre
- Medium = 31-50 bushels
- High = greater than 50 bushels per acre
Negotiating the North Dakota Nitrogen Calculator for spring wheat and durum
For access to the North Dakota Nitrogen Calculator, which includes spring wheat and durum tabs, see https://www.ndsu.edu/pubweb/soils/N_calculators/#
- Find and click the region for the farm of interest.
- Enter soil test nitrate-N from the 0- to 2-foot depth.
- Enter the previous crop for possible N credits.
- If the field has been in no-till for less than five consecutive years, 20 pounds of N per acre are added.
- If the field has been in no-till for greater than five consecutive years, 50 pounds of N per acre are subtracted.
- Enter the soil organic matter percentage. An organic matter credit is available for soils with 6% or greater organic matter.
From 6-6.9%, 50 pounds N per acre are subtracted. For 7-7.9% organic matter, an additional 100 pounds N per acre is subtracted. > Note There are no soils known in North Dakota with 8% or greater organic matter.
From the recommended economic optimum N rate provided from the N calculator, the user has a suggested plus or minus 30 pounds N per acre range that might be appropriate based on grower practices, cultivars. This adjustment may be used to anticipate a host of issues, including the following:
- Subtract N for high protein varieties
- Add N for lower protein varieties
- Subtract N for areas with a history of early lodging
- Add N for soils with denitrification issues
- Add N for N application practices that are not ideal- For wheat after small grains, there is an assumption that about 2,000 pounds per acre of straw will be returned to the soil, which will tie up some residual N during decomposition. For every 2,000 pounds per acre of straw greater than this, 30 additional pounds of N per acre should be added to the recommendation to compensate for the additional N tie up from these low-N containing residues.
As N costs increase and wheat price decreases, the optimum N will not result in highest yield or protein; however, the rates will result in the greatest net income. The tables from which gross N recommendation values are derived for the NDSU N calculator for spring wheat/durum follow:
Table 15.60 Langdon region conventional till low productivity (less than 40 bushels per acre).
Table 15.61 Langdon region conventional till medium productivity (41-60 bushels per acre).
Table 15.62 Langdon Region, conventional tillage, high productivity (greater than 60 bushels per acre).
Table 15.63 Spring wheat/durum N recommendations, Eastern Region, conventional tillage, low productivity (less than 40 bushels per acre).
Table 15.64 Spring wheat/durum N recommendations, Eastern Region conventional tillage, high productivity (greater than 60 bushels per acre).
Table 15.65 Spring wheat/durum N recommendations, Western Region, conventional tillage, low productivity (less than 30 bushels per acre).
Table 15.66 Spring wheat/durum N recommendations, Western Region, conventional tillage medium productivity (31-50 bushels per acre).
Table 15.67 Spring wheat/durum N recommendations, Western Region conventional tillage high productivity (greater than 50 bushels per acre).
Active-optical sensors for in-season nitrogen applications directed at yield improvement
Fundamentals of active-optical sensor use in spring wheat production
To use an active-optical sensor for the purposes of site-specific N side-dress N application in wheat, an N-sufficient area in the field must be established. The area’s soil properties should reflect the soil properties of the rest of the field, is usually the width of the application and 100 feet long, and is typically located in an area close to the field entrance, but not in the end-rows. If all of the N calculators recommended N was applied preplant, at or near planting, then an additional 50 lb N/acre should be applied in the N-rich strip area. If only half of the recommended N was applied preplant or at planting, then 100 lb N/acre should be applied to the N-sufficient area. Since spring wheat is a fast-growing crop, at least half of the N should be provided through examination of the fall/spring residual nitrate-N soil test to 2 feet in depth, and factoring in any previous crop N credits from annual legumes or other contributions such as manure.
At the time of topdress, the growing degree days accumulated from planting date should be entered into the controlling computer unit. This is necessary to standardize the data through the calculation of INSEY (in-season-estimate of- yield). The INSEY is a standardization that allows the application to be made plus or minus one wheat leaf stage from the V5 leaf stage, for which the algorithm was developed. When the applicator enters the field with the sensor or sensor array attached in front of the applicator unit, it first senses the N-sufficient strip. Then the average reading from the area is entered into the spray controller. If the readings in the rest of the field are within 5% of the N-sufficient strip, then no rate of N would be expected to increase yield more than the yield in the N non-limiting area. If the readings in the field are generally greater than those in the N-sufficient strip, it is very likely that sulfur (S) deficiency is present in the field, and this has to be addressed before using the system to apply additional N fertilizer.
If the field readings are less than the N-sufficient strip by more than 5%, the algorithm will reasonably predict the yield for this area would most likely be lower than the N-sufficient strip if no N was applied. The difference between the predicted yield of the N-sufficient strip and the predicted yield outside of the N non-limiting area is then used to calculate the N rate as follows:
- Scan the N-sufficient strip
- Determine the INSEY of the strip (scan reading divided by the accumulated growing degree days from the planting date to the scan date)
- Scan the area outside of the N-sufficient strip (this can be done site-specifically, or as a field if that is not practical.
- Determine the INSEY average of the scan/s outside the N-sufficient strip.
- Apply the N-sufficient strip INSEY and the INSEY outside the strip to the yield equation provided in the table.
- Determine the N required to attain a yield near the predicted yield of the N-sufficient strip. \[\text{Yield difference (bu/acre) X 60 pounds per bushel X 2.25% N in the grain = N required for the additional yield}\]
- Divide the N required by the efficiency factor of 0.6 for a topdress application.
- The answer is the N rate for topdress.
Additional variables factored into the algorithm are areas in the field that have low plant density, bare areas, areas with poor growth due to high salts or non-N nutrient problems. If the INSEY falls below 0.00025 for a Red NDVI sensor, or 0.00012 for a RedEdge NDVI sensor, then the poor growth is not the result of low N, and the rate applied to the area should be zero supplemental N.
Table 15.68 Spring wheat algorithm inputs for the use of GreenSeeker™ and Holland Scientific Crop Circle™ sensors in North Dakota spring wheat yield prediction for use in directing top-dress N rates
Example of algorithm calculation for spring wheat yield improvement
A field near Carrington in 2020 was soil sampled in the fall of 2019, and using the N-Calculator for Spring Wheat and Durum https://www.ndsu.edu/pubweb/soils/wheat/ , the N recommendation was calculated to be about 100 pound N per acre. Spring wheat was then seeded on April 15, 2020 near Carrington, ND. Fifty pounds of N per acre was applied to the field before planting, with an additional 75 pounds of N per acre (125 pounds N per acre total) applied to the N-sufficient strip. The date of the 5-leaf-stage scanning to determine the N rate of a potential top-dress was May 30. NDAWN indicated that the Growing Degree Days (GDDs) accumulated up to this point in the season for wheat was 836 GDD.
- The scan of the N-sufficient area showed an average GreenSeeker red NDVI reading of 0.636 .
- The INSEY for the N-sufficient strip would be 0.636/836 = 0.0007608
- In another part of the field outside of the N-sufficient strip, GreenSeeker red NDVI reading was 0.56
- The INSEY for 0.56 is 0.56/836 = 0.0006699
- In the N-sufficient strip, the relationship of GreenSeeker red NDVI to yield is: Yield = 187853 X INSEY – 56
- For the N-sufficient strip, 0.0007608 X 187853 = 142.9
The amount of Busshels per acre predicted using the sufficient strip was: \[ \text{142.9 – 56 = ~87 Bushels of Wheat per acre }\]
Yield prediction outside the N-sufficient strip was:
\[\text{(0.0006699 X 187853) – 56 = ~70 bushels per acre}\]
- The difference in yield between the N-sufficient strip and outside the strip was 87-70 = 17 bushels per acre.
- The percent of N in 14% protein wheat is 2.24% N
- The N contained in 35 bushels of wheat at 14% protein is 17 X 60 X 0.0224 = 22.8 pounds N per acre.
- The efficiency of topdressed N is usually about 60%, so the N required for the wheat yield to be similar as the N-sufficient strip was 22.8/0.6 = 38 pounds N per acre.
- The N rate outside the N-sufficient strip was 38 pounds N per acre.
Protein enhancement in hard red spring wheat
The immediately post-anthesis nitrogen application for protein enhancement in hard red spring wheat
The spring wheat market standard for protein is 14 percent. In most years, if a farmer delivered grain protein less than 14 percent, the price the farmer receives for the grain is reduced, due to the discounts for low protein. In some years, there is a premium provided by the buyer for grain with more than 14 percent protein. There is rarely a premium provided on protein delivered greater than 15 percent, meaning typically there is only a premium for protein values from 14 to 14.9 percent.
The decision on whether to supplement the spring wheat crop with a late-season N application is clouded due to the uncertainty of whether a premium and/or dockage will be present when the grain is delivered and whether any supplemental N is even necessary to achieve market protein. Usually, grain buyer decisions on discounts and premiums are made during the spring wheat harvest period. Previously, there has been no scientific guidance through which growers could estimate whether a post anthesis N application would be helpful.
Once a spring wheat grower predicts that a significant dockage for lower protein or premium for higher protein might be available, the next step is to determine whether supplemental N might be required. The landmark work on in-season N application was performed by Finney et al. (1957). This work was done using a urea solution, applying rates at various times throughout the growing season up until final wheat kernel development. The study showed that any early season N applications up through early jointing resulted in a yield increase, but also low protein increases. The greatest increase in protein was achieved when the urea solution was applied immediately after flowering (anthesis), just when the anthers were withering. As the grain began to develop, the benefit gained from the urea solution was greatly reduced. Researchers further used the harvested grain from the trial to make bread loaves, and they concluded that the protein increases seen in their work were actual grain proteins, and not some relic of the fertilizer ammonia itself.
Considerable work has been conducted at NDSU through the experiments of Schatz and Endres at the Carrington REC, of McKay at North Central REC and others.
Table 15.69. Protein and yield with foliar N rates applied post-anthesis as UAN, Carrington 1990-91 dryland.
These studies indicate that 30 pounds of N per acre rate applied immediately post-anthesis is the most profitable N rate and timing to achieve the greatest spring wheat grain protein (Finney et al., 1957). In subsequent studies exploring N sources with ‘greater efficiency’ compared to that of UAN, the higher efficiency fertilizers applied as a foliar were no more effective than UAN, and still needed to be applied at the 30 pounds N per acre rate to increase grain protein (similar to the 30 pounds N per acre applied as UAN). The 1 to 3 gallon per acre recommendations associated with these products had no effect on grain protein. The rate of N was too low to have any effect https://www.ndsu.edu/fileadmin/snrs/2020_Website_Revamp/foliarNreport.pdf.
Use of an active-optical sensor to determine agronomic benefit of immediately post-anthesis N application in hard red spring wheat
Using an active-optical sensor for determining any potential benefit from a post-anthesis N application should be done during the flag leaf stage (starting when the flag collar is visible; Zadoks 39/Feekes 9). The flag leaf stage scan-values are related to spring wheat protein. For practical reasons, a flag leaf scan may be made during a flag leaf fungicide application, in order to save a trip across the field. Spring wheat in North Dakota is typically treated with a fungicide at early anthesis (Zadoks 61 or Feekes 10.5.1). Fungicide and N fertilizer should not be applied at the same time. If fungicide and N fertilizer are applied at the same time, it could result in: the fungicide activity being reduced, the flag leaf being damaged leading to lower yields, the effect of the N fertilizer on the grain protein being reduced; all of this can occur even if a urea solution is instead of UAN in an attempt to minimize leaf damage
Considerations following scanning
A scan of the field at about the V5 growth stage (5 true leaves present; Zadoks 15) can be conducted to help determine the need for protein enhancement. If the scanner value is less at flag leaf stage than at the V5 stage, there will be no profitable gain from any supplemental N application. The lower value at flag leaf is almost always the result of drought and the subsequent reduction in both canopy and greenness caused by the drought. If the scanned red edge NDVI is greater at flag leaf than at V5, then the red edge NDVI value can be used to predict whether or not an immediate post-anthesis N application would result in any increase in grain protein.
There are two values to consider depending on the general protein content trait of the cultivar being grown. If the cultivar tends to yield grain with high protein regardless of conditions, then the high protein value should be used. If the cultivar tends to be a low to medium protein type, then the low to medium value of red edge NDVI should be used. The decision really comes down to ‘yes/no’ . If the reading is greater than the table value, then the probability of any profitable gain from supplemental N is low. If the reading is less than the table value, the probability of a profitable gain from supplemental N is high, only if premiums for higher protein and/or dockage for low protein are great enough. There are, and will be, differences in wheat tint between varieties. The recommendations in the table below are based on experiments over several cultivars. Using a N-sufficient area within the field, and comparing the red edge NDVI of the strip with values in the rest of the field will provide confidence to the grower that their decision to fertilize, or not, was justified.
Table 15.70 Red edge NDVI values at flag-leaf to determine likelihood of protein increase with immediate-post-anthesis N application
15.10.23 Nitrogen for Wheat: Winter Wheat
Nitrogen timing for North Dakota winter wheat production
Winter wheat can be fertilized with the entire nitrogen amount in the fall, but studies in many winter wheat-growing areas show a consistently better yield response, and greater N use efficiency, when the bulk of the Ns applied is made during the spring at green-up period. In addition, regardless of whether the soils are frozen with or without snow during the winter, fertilizing on top of frozen soils is a very poor nutrient management strategy. Frozen soils do not allow the N to move down into the soil, so the N is free to move during snowmelt. In addition, research at Montana State University has shown that large N losses are common due to denitrification during the winter (Engel et al., 2011).
A spring application may be difficult due to uneven snowmelt and potentially wet soil conditions; however, taking advantage of early morning frosts once snow melts enables a more timely application.
The use of UAN (28-0-0) liquid fertilizer with stream-bars is the preferred application method. Broadcast UAN applications should not be done due to the leaf burn that will result. Stream-bars should be monitored during application so that the stream pattern is not broken apart by the wind. If the pattern is broken by wind, the stream-bar application will result in a broadcast-like application and severe leaf burning will result.
Urea granules may be used, but potential ammonia volatility is a concern if rain does not fall within a couple of days. Urea surface-applied on a no-till field is particularly at risk for volatility due to the high concentration of urease enzyme in residue, compared to bare soil. Ammonia loss from urea breakdown due to urease activity is greatest when the soil/residue is moist, temperatures are above freezing, and a wind is blowing. Urea should be treated with NBPT at the proper rate when urea is surface applied. See the previous section on the subject or the following circular for more details https://www.ndsu.edu/fileadmin/soils/pdfs/Nitrogen_Extenders_and_Additive_for_Field_Crops_2017.pdf
Nitrogen rates for winter wheat
Different nitrogen rates are used to supplement what the soil will provide in a poor or superior yield-supporting environment. There is no causal relationship between yield and N rate across all environments. North Dakota research indicates that the following productivity ranges are appropriate when considering the optimum economic N rate for winter wheat (Franzen, 2022):
-Low productivity - yields below 40 bushel per acre -Medium productivity - yields between 40 and 70 bushels per acre -High productivity- yields greater than 70 bushels per acre
For areas of low productivity: \[\text{Total available N ( Fertilizer + Soil test nitrate 2 feet ) = 100 pounds of N per acre.}\]
For areas of medium productivity: \[\text{Total available N ( Fertilizer + Soil test nitrate 2 feet) = 150 pounds of N per acre.}\]
For areas of high productivity: \[\text{Total available N ( Fertilizer + Soil test nitrate 2 feet) = 200 pounds of N per acre.}\]
In long-term no-till soils (6 years or more continuous no-till, strip-till or shallow one-pass seeding), an N credit of 50 pounds N per acre may be subtracted from the N recommendation. This no-till credit may come from a combination of increased native asymbiotic N-fixing activity by microorganisms and the greater uptake of ammonium N by the greater mass of microorganisms and its subsequent release back to the soil.
See Figure 15.66 for the agroclimatology zone referred to as the Langdon region. If growing winter wheat in this region, reduce N rates by 40 pounds/acre. This reduction is due to the unique climatic and soil conditions in this area that promote increased soil and residue mineralization and release of N to growing crops. The soils in the Langdon region contain small pieces of shale bedrock, which contain large amounts of mineralizable ammonium in the shale. This is probably the reason why the N rate studies in this region resulted in a lower optimum N rate, compared with the rest of eastern North Dakota.