Title

Determining Carrying Capacity and Stocking Rates for Range and Pasture in North Dakota

(R1810, Reviewed April 2024)
Summary

Establishing the correct stocking rate is critical in optimizing forage performance and maintaining animal performance while ensuring the sustained health and production of the grassland resources.

Lead Author
Lead Author:
Miranda Meehan, Extension Livestock Environmental Stewardship Specialist
Other Authors

Kevin K. Sedivec, Extension Rangeland Management Specialist; Jeff Printz, Natural Resources Conservation Service Rangeland Management Specialist (Retired); Fara Brummer, Area Extension Livestock Systems Specialist (Former)

Availability
Availability:
Available in print from the NDSU Distribution Center.

Contact your county NDSU Extension office to request a printed copy.
NDSU staff can order copies online (login required).

Publication Sections
Livestock  Grazing
Photo Credit:
Miranda Meehan


Many factors affect stocking rate, such as:

  • Owner’s/operator’s management goals
  • Animal species (cattle, sheep, horses, etc.)
  • Class of livestock (dry cow, lactating cow, bull, steer, etc.)
  • Acres available for the grazing season
  • Rainfall (dependability, amount and timing)
  • Topography
  • Soils/ecological sites
  • Health of grassland resources (infiltration rates, species composition, annual production)
  • Livestock water (quantity, quality and distribution)
  • Forage species composition
  • Forage quality and palatability
  • Forage productivity
  • Management practices (prescribed grazing systems, animal densities, cross-fencing, etc.)

Effective managers will balance forage production and animal performance for the long term by incorporating flexibility and contingency plans into their grazing operations to account for changing weather conditions, natural events such as wildfire, and variable livestock markets. Stocking rates may be set appropriately by being mindful of these variables. Stocking rates can be planned by determining the following:

  • Forage demand: How much forage is required by the type and class of animals grazing the range or pasture unit
  • Available forage: How much forage is produced during the year and how much is available for livestock consumption
  • Duration: How long the animals will be using the area

The information provided in this publication is designed to help the grassland manager/owner estimate the initial stocking rate for his/her grazing pasture(s). The accuracy of this estimate will depend greatly on the quality and accuracy of information prior to calculating the stocking rate. For example, are your forage production figures based on estimates or actual field-collected data?

Monitoring forage utilization levels during and at the end of the grazing season is important for valuable feedback on the accuracy of the stocking rate estimation. That will allow the owners/operators to make adjustments on the stocking rates if they need to do so to meet their management goals.

Stocking Rate: the number of specific kinds and classes of animals grazing or using a unit of land for a specific time period. Stocking rate is a management decision and one of the most important grazing management decisions a rancher or land manager makes. Regardless of which grazing management system is employed, vegetation type grazed or kind and class of livestock involved, stocking rate has the largest impact on the health of the grassland resource and on animal performance of all management tools available.

Carrying Capacity: a “measurement” (actual or estimated) of how much forage a unit or piece of ground is able to produce on an average year. The carrying capacity is the maximum stocking rate possible that is consistent with maintaining or improving forage and other vegetation and related resources. It can vary from year to year on the same area due to changes in forage production. Carrying capacity is expressed as the number of animal units that can be grazed for a specific time period. In short, carrying capacity is the amount of forage available for grazing animals. It is expressed as the number of available animal unit months (AUMs), or number of animal units grazed for one month.

Animal unit month

An animal unit month (AUM) is based on the age, class and size of livestock, and the amount of forage they will consume in one month. An AUM also is a common way of expressing stocking rates, such as “my pasture can support 125 AUM in an average year of growth.”

The standard animal unit is a 1,000-pound cow with a 6-month-old or younger calf by her side. The kind, class and size of livestock will need to be adjusted based on this standard. Use Table 1 to find the correct animal unit equivalent (AUE) for your livestock.

Table 1. Animal units equivalents (AUE) guide(1).
Kinds/Classes of Animals Animal Unit Equivalent (AUE) Forage Consumed in Pounds (air-dried2)
    Day Month
1,000 lb. cow, dry 0.92 28 851
1,000 lb. cow, with calf 1.00 30 913
1,100 lb. cow, with calf 1.07 32.5 988
1,200 lb. cow, with calf 1.15 35 1,064
1,300 lb. cow, with calf 1.22 39 1,125
1,400 lb. cow, with calf 1.29 39 1,186
1,500 lb. cow, with calf 1.35 41 1,247
Cattle bull, mature 1.40 42.5 1,295
Weaned calves to yearling 0.60 18 547
Yearling cattle (600-800 lb.) 0.70 21 638
Two-year-old cattle (800-1,000 lb.) 0.90 27 832
Bison cow, mature 1.00 30 913
Bison bull, mature 1.50 45 1,368
Horse, mature 1.25 38 1,155
Sheep, dry 0.15 4.5 135
Sheep, mature with lamb 0.20 6 182
Sheep, ram 0.25 7.5 228
Goat, mature 0.15 5 152
Deer, white-tailed, mature 0.15 5 152
Deer, mule, mature 0.20 6 182
Elk, mature 0.60 18 547
Antelope, mature 0.20 6 182
Sheep, bighorn, mature 0.20 6 182
Jackrabbit, white-tailed 0.02 0.6 18
Prairie dog 0.004 0.1 3

1. Adapted from Natural Resources Conservation Service National Range and Pasture Handbook (1997) and Montana State University Range and Pasture Records (1993).

2. Air-dry weight refers to forage that is allowed to dry under natural environmental conditions during an extended period of time, such as plants harvested for hay production.  This value is approximately 87 percent dry matter versus oven-dry weight, which depicts 100 percent dry matter.  

Harvest efficiency

This is the amount of the plant that livestock will impact during the time they are grazing the pasture. This includes the amount of the plant eaten by the animal, as well as the spoilage from waste and trampling. Several factors influence harvest efficiency, including: forage type, forage maturity, forage distribution, topography, livestock distribution and stocking density.

Harvest efficiency includes the “take half, leave half” concept of forage disappearance within the pasture. This concept allows for plants to continue to maintain production while adjusting for lost consumable forage that is senesced, trampled or consumed by wildlife and invertebrates.

Harvest efficiency is expressed as a percent and should be multiplied by the total amount of forage on your pasture to give you the actual amount of forage for use by grazing animals while continuing to maintain proper use of the resource.

We recommend using a harvest efficiency of 25 percent for most plant communities on native pastures grazed seasonlong and when determining your initial carrying capacity. The recommended harvest efficiency for wet meadow plant communities is 12.5 percent; the plants in these communities tend to receive lower use due to their palatability.

On tame grass/legume pastures with introduced species, we recommend using a harvest efficiency of 30 percent. The harvest efficiency is higher on tame grass pastures because they are relatively uniform in plant species composition, forage production and topography, and have reduced grazing selectivity by animals and reduced patch grazing.

When utilizing a properly managed grazing system, harvest efficiency may be increased through time. Use harvest efficiency values (percentage) when calculating carrying capacity using the estimated relative production values method.

A multiplier may be used as a general guideline for goal setting when increasing carrying capacity with a properly functioning grazing management plan when using the AUM/acre method. For every 1 percent increase in harvest efficiency, you receive a 4 percent increase (multiplier) in carrying capacity. See Table 2 to determine your harvest efficiency value (percentage) or multiplier value when adjusting for properly managed rotational grazing systems.

Table 2. Multiplier for harvest efficiency values on rangeland and tame grass pastures ranging from 12.5 to 50 percent. Use these numbers when calculating carrying capacity using the AUM/acre method.
Harvest Efficiency1 Multiplier2 Harvest Efficiency1 Multiplier2
(%)   (%)  
12.53 0.50 33 1.32
254 1.00 34 1.36
26 1.04 35 1.40
27 1.08 36 1.44
28 1.12 37 1.48
29 1.16 38 1.52
305 1.20 39 1.56
31 1.24 40 1.60
32 1.28 50 2.00
  1. Use the harvest efficiency percentage when adjusting carrying capacity using the estimated relative production values method.
  2. Use the multiplier when adjusting carrying capacity using the AUM/acre method.
  3. Use a harvest efficiency of 12.5 percent on wet meadow acres.
  4. Use a harvest efficiency of 25 percent on rangeland pastures as a starting point of if grazing seasonlong. 
  5.  Use a harvest efficiency of 30 percent on tame grass/legume pastures with introduced species as a starting point or if grazing seasonlong.

If you have not calculated your carrying capacity previously, start with the 25 percent harvest efficiency. Adjustments can be made during the grazing season by monitoring utilization.

Harvest efficiency is the portion of the current year’s forage production that is consumed by the grazing animals. It includes a 50 percent leave rate for plant health and forage production.

Rangeland pastures

Land on which the native vegetation (climax or natural potential) is predominantly grasses, grasslike plants, forbs or shrubs; includes lands revegetated naturally or artificially when routine management of that vegetation is accomplished mainly through manipulation of grazing. Rangelands include natural grasslands, savannas, shrub lands, most deserts, tundra, alpine communities, coastal marshes and wet meadows.

Tame grass pastures

Grazing lands, planted primarily to introduced or domesticated native forage species, that receive periodic renovation and/or cultural treatments, such as tillage, fertilization, mowing, weed control and irrigation; not in rotation with crops.

Calculating Stocking Rate

The NDSU Grazing Calculator app may be used in conjunction with this section.

There is also an iOS version that can be downloaded.

Animal units (AU) are used to calculate the relative grazing impact of different kinds and classes of domestic livestock and common grazing wildlife species for one month (AUM = animal unit months).

To determine the number of AUM needed to support your livestock:

1) multiply the number of animals to be grazed on the pasture by the AUE found in Table 1 to determine total AU, then

2) multiply the total AU by the number of months planned to graze (see formula below or Worksheet A of the Range Calculator).

Formula

# Animals

x

AUE
(table 1)

=

Animal Units
(AU)

x

Months
(M)

=

AUM
Example 1

100 1,200-lb. cows with calves with a planned grazing schedule from May 15 - Nov. 1 (5.5 months)

4 mature bulls grazing from July 1 - Sep. 15 (2.5 months)

100

x

1.15

=

115 AU

x

5.5 M

=

632.5 AUM

4

x

1.50

=

6 AU

x

2.5 M

=

15.0 AUM

Total              

647.5 AUM

Example 2

250 ewes with lambs with a planning grazing schedule from June 1 - Nov 1 (5 months)

5 rams from Sept. 1 - Nov. 1 (2 months)

250

x

0.20

=

50 AU

x

5.0 M

=

250.0 AUM

5

x

0.25

=

1.25 AU

x

2.0 M

=

2.5 AUM

Total              

252.5 AUM

Calculating Carrying Capacity

Carrying capacity, or estimated forage quantity in the pasture, can be calculated using different techniques. Two common methods to calculate carrying capacity are: 1) field-based methods or 2) stocking rate estimates based on regional production data provided by the U.S Department of Agriculture’s Natural Resources Conservation Service (NRCS; Sedivec and Printz 2012, USDA Natural Resource Conservation Service, 2014).

1) Field-based methods are a more accurate measurement of carrying capacity. Refer to the publication “Ranchers Guide to Grassland Management IV” by Sedivec and Printz (2014) for more detail on field-based methods.

2) When forage production samples are not available to calculate carrying capacity, estimated values can be used to determine initial rates based on: I) AUM/acre and II) relative production values (RV; lb/ac).

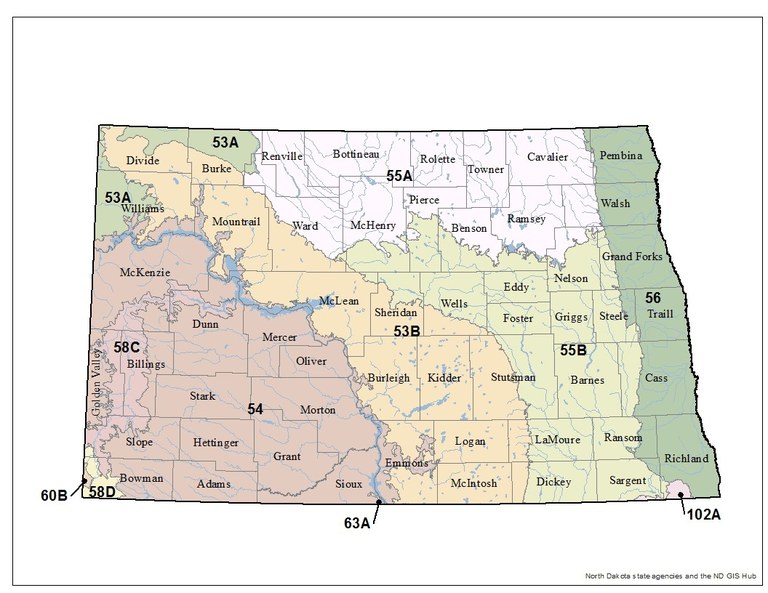
Before estimating carrying capacity of the pasture, the landowner must determine in which Major Land Resource Area (MLRA, Figure 1) the pasture is located. Then the landowner needs to categorize all acres within the pasture by upland and lowland vegetation types (also includes ecological site and soil type). The vegetation type can be determining using 1) Web Soil Survey (USDA Natural Resources Conservation Service 2013), 2) utilizing Geographic Information System (GIS)-generated maps or 3) visual estimates.

Web Soil Survey can be assessed  or by downloading the SoilWeb application on your mobile device. For assistance, contact your local county Extension agent or NRCS office.

Figure 1. Major Land Resource Areas of North Dakota.
Photo Credit:
North Dakota state agencies and the ND GIS Hub
Figure 1. Major Land Resource Areas of North Dakota.

Carrying Capacity Using Estimated AUM/acre Method

(for rangeland pastures only)

To determine carrying capacity using estimated AUM/acre, multiply the acres of vegetation type by the recommended estimated stocking rate from Table 3 to determine AUM available (see formula below or Worksheet B of the Range Calculator). Repeat for each vegetation type found in the pasture. Total the results of each vegetation type to determine the total AUM available for the pasture.

Table 3. Estimated stocking rate guide in animal unit months per acre (AUM/ac) by site and multiple land resource areas (MLRA) for the reference plant community associated with each vegetation type/ecological site (modified from Sedivec and Printz (2012) – Ecological Sites of North Dakota).

(Use for rangeland pastures only)

Vegetation Type/Ecological Site 53A&B 54 55A&B 56 58 C&D
Upland          
-- Loamy 0.66 0.66 0.71 0.85 0.57
-- Sandy .068 0.66 0.77 0.85 0.55
-- Clayey 0.63 0.57 0.66 0.82 0.52
Shallow 0.60 0.38 0.52 0.60 0.36
Very Shallow/Thin claypan 0.30 0.24 0.37 0.43 0.22
Lowland          
-- Overflow 0.96 0.87 1.01 1.15 0.57
-- Wet meadow 0.60 0.60 0.60 0.70 0.60

Finally, the landowner can determine the carrying capacity for the planned class or type of livestock. Once the carrying capacity is determined using the estimated stocking rate guide from Table 3, divide total AUMs by total acres and then divide by AUE to calculate your animal unit equivalent months per acre (AUEM/ac). The AUEM per acre is an estimate of how many acres are required to support the kind and class of livestock you are grazing for a period of one month.

If harvest efficiency has been improved through the implementation of a properly managed grazing system, multiply total AUM by the guideline multiplier value found in Table 2 (multiplier column).

Formula:

Acres if Vegetation Type

x

AUM/acre1

=

AUM2

Expressed Carrying Capacity:

AUM

÷

total acres

÷

AUE3

=

AUEM/ac

1 AUM/acre (Table 3) for vegetation type based on a 0.25 harvest efficiency.

2 AUM must be calculated for each vegetation type.

3 AUE for your livestock class or type found in Table 1.

Example 3

1,000-acre rangeland pasture grazed seasonlong containing 790 acres of loamy upland, 150 acres of shallow, 50 acres of overflow and 10 acres of wet meadow near Steele, N.D. (MLRA 53B1). Range unit is grazed by 1,300-lb. cow with calf.

Site Type

Acres

x

AUM/ac2

=

AUM

Loamy

790

x

0.66

=

521.4

Shallow

150

x

0.60

=

90.0

Overflow

50

x

0.96

=

48.0

Wet meadow

10

x

0.60

=

6.0

Total 1,000    

=

665.4
AUM for total pasture

1 Figure 1.

2 The animal unit months/acre found in Table 3 is based on a 0.25 harvest efficiency under seasonlong grazing and the 0.125 harvest efficiency for wet meadow communities.

Expressed Carrying Capacity:

665.4 AUM

÷

1,000 acres

÷

1.22 AUE

=

 0.55 AUEM/ac

or

1 ÷ 0.55 AUEM/ac = 1.82 acres per month for each 1,300-lb. cow with calf. 

Example 4

Same as Example 1 but managed using an approved grazing system with mature sheep with lambs.

With an approved grazing system and using a 35 percent harvest efficiency, multiplier value is 1.4 (Table 2). 

So, 671.7 AUM x 1.4 = 940.4 AUM.

1 from Example 1

Expressed Carrying Capacity:

940.4 AUM

÷

1,000 acres

÷

0.20 AUE

=

 4.7 AUEM/ac

or

1 ÷ 4.7 AUEM/ac = 0.21 acre per month for each sheep with lamb.


To convert AUM/ac to ac/AUM, divide 1 by AUM/acre. For example, 0.66 AUM/ac would be 1 ÷ 0.67 = 1.49 ac/AUM.

Carrying Capacity Using Estimated Relative Production Values Method

(for rangeland and tame grass pastures)

To determine carrying capacity using estimated relative production values methods, 1) multiply acres of vegetation type by the recommended relative production values from Table 4 to determine total production, 2) then multiple total production by appropriate harvest efficiency (Table 2) to achieve available forage for grazing, 3) then divide by 913 lb. (amount of air-dried forage consumed
by one AU per month) to determine total AUM available (see formula below or Worksheet C of the Range Calculator).

Acres of Total Harvest Available Forage

Formula:

Vegetation Type

x

RPV1

=

Production (lb.)

x

Efficiency2

=

for Consumption/913 lb3

=

AUM4

Expressed Carrying Capacity:

AUM

÷

total acres

÷

AUE5

=

AUEM/ac

  1. Relative production value (Table 4).
  2. See Harvest Efficiency section for recommended value (Table 2).
  3. Average consumption of an AU for one month is 913 pounds of air-dried forage.
  4. AUM must be calculated for each vegetation type.
  5. AUE for your livestock class or type found in Table 1.

Table 4. Estimated stocking rate guide using relative production values (RPV; lb/ac) and multiple land resource areas (MLRA) for reference plant communities associated with each vegetation type/ecological site (modified from USDA (2014) relative forage production values by ecological sites).

(Use for rangeland and tame grass pastures.)

Vegetation Type/Ecological Site 53A&B 54 55A&B 56 58C&D
Upland          
-- Loamy 2,400 2,400 2,800 2,850 2,100
-- Sandy 2,500 2,400 2,800 2,850 2,900
-- Clayey 2,300 2,100 2,600 2,700 1,900
Shallow 2,200 1,330 2,100 2,150 1,300
Very shallow/Thin claypan 1,100 800 1,350 1,050 800
Lowland          
-- Overflow 3,500 3,200 3,800 3,800 2,650
-- Wet meadown/Sub 4,500 4,250 4,600 4,500 4,000

Repeat for each vegetation type found in the pasture. Total the results of each vegetation type to determine total AUM available for the pasture. If a properly managed grazing system has been installed and is working effectively, increasing the harvest efficiency percentage found in Table 2 may be desired.

To determine the carrying capacity in AUM per acre, divide the total AUM by the acres in the grazing unit. To convert AUM/ac to ac/AUM, divide 1 by AUM/acre.

To determine acres needed to support your class or type of livestock, take the total AUM/ac and divide by AUE to get AUEM/ac. Then divide 1 by the AUEM to determine acres needed to support your class or type of livestock for one month.

Example 5

1,000 acre rangeland pasture grazed seasonlong containing 790 acres of loamy upland, 150 acres of shallow, 50 acres of overflow and 10 acres of wet meadow near Steele, N.D. (MLRA 53B1).  Range unit is grazed by 1,300-lb. cow with calf.  

Site Type

x

Acres

x

RPV2

=

Total Pounds Produced

x

Harvest Efficiency3

=

Forage Available for Comsumption (lb)/913 lb.4

=

AUM

Loamy

x

790

x

2,400 lb

=

1,896,000

x

0.25

=

474,000/913

=

519.2

Shallow

x

150

x

2,200 lb.

=

330,000

x

0.25

=

82,500/913

=

90.4

Overflow

x

50

x

3,500 lb.

=

175,000

x

0.25

=

43,750/913

=

47.9

Wet meadow

x

10

x

4,500 lb.

=

45,000

x

0.125

=

5,625/913

=

6.2

Total


1,000


=

663.7 AUM

Carrying capacity is 0.66 AUM/ac (663.7 AUM ÷ 1,000 acres) or 1.51 ac/AUM (1,000 acres ÷ 663.7 AUM)

  1. Figure 1
  2. Relative production value (Table 4)
  3. See Harvest Efficiency section for recommended value (Table 2)
  4. Average consumption for an AU for one month is 913 pounds. 

Expressed carrying capacity is 663.7 AUM ÷ 1,000 acres = 0.66 AUM/ac ÷ 1.22 AUE = 0.54 AUEM/ac;

or

1 ÷ 0.54 AUEM/ac = 1.85 acres per month for each 1,300-lb. cow with calf. 

Example 6

1,000 acre rangeland pasture grazed seasonlong containing 790 acres of loamy upland, 150 acres of shallow, 50 acres of overflow and 10 acres of wet meadow near Steele, N.D. (MLRA 53B1).  Range unit is grazed by mature sheep with lambs.  

Site Type

x

Acres

x

RPV2

=

Total Pounds Produced

x

Harvest Efficiency3

=

Forage Available for Comsumption (lb)/913 lb.4

=

AUM

Loamy

x

790

x

2,400 lb

=

1,896,000

x

0.35

=

663,000/913

=

726.8

Shallow

x

150

x

2,200 lb.

=

330,000

x

0.35

=

115,500/913

=

126.5

Overflow

x

50

x

3,500 lb.

=

175,000

x

0.35

=

62,250/913

=

67.1

Wet meadow

x

10

x

4,500 lb.

=

45,000

x

0.125

=

5,625/913

=

6.2

Total


1,000


=

926.6 AUM

Carrying capacity is 0.93 AUM/ac (926.6 AUM ÷ 1,000 acres) or 1.08 ac/AUM (1,000 acres ÷ 926.6 AUM)

  1. Figure 1
  2. Relative production value (Table 4)
  3. See Harvest Efficiency section for recommended value (Table 2)
  4. Average consumption for an AU for one month is 913 pounds. 

Expressed carrying capacity is 926.6 AUM ÷ 1,000 acres = 0.93 AUM/ac ÷ 0.20 AUE = 4.65 AUEM/ac;

or

1 ÷ 4.65 AUEM/ac = 0.22 acres per month for each sheep with lamb. 

Management Recommendations

• The stocking rate should not be greater than the carry capacity to assure proper resource management. Frequently, the stocking rate may be lower than the carrying capacity due to different ecological and management objectives.

• The carrying capacity is influenced by the current condition of the ecological site.

See R1556, “Ecological Sites of North Dakota” (Sedivec and Printz 2012)

• We highly recommend that monitoring tools be implemented to prevent overgrazing and to determine whether you are meeting your management goals.

See R1780, “The North Dakota Grazing Monitoring Stick: A Way to Measure Range and Pasture Utilization” (Meehan et al., 2015)

• The estimated stocking rate could be based on local knowledge and past stocking rates if the similarity index, health and trend have met the producer’s objectives without degrading the resource.

• In times of drought, early adjustments of the stocking rate will need to occur due to loss of forage production.

See R1819, “Strategies for Managing Drought in the Northern Plains” (Sedivec et al., 2016)

November 2018