Irrigation Scheduling by the Checkbook Method
(AE792, Reviewed February 2024)This publication outlines and shows the Checkbook Method of irrigation scheduling.
Contact your county NDSU Extension office to request a printed copy.
NDSU staff can order copies online (login required).
With variable rain events and a mixture of soil types, determining when to irrigate and how much water to apply during the growing season can be a challenge. With too little water, the crop is stressed, while with too much water, crops are stunted and fertilizer is leached below the root zone, and pumping costs are increased. Either way, the crop suffers and reduces the yield.
Definitions
(Adapted from American Society of Agricultural and Biological Engineers (ASABE) Standard S526.4, used with permission)
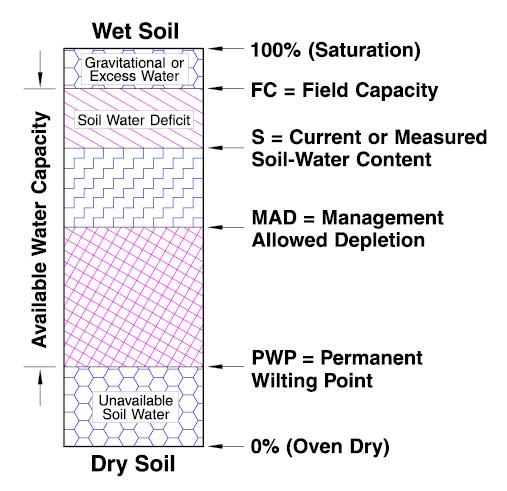
Available soil water, more commonly called available water capacity (AWC): The portion of soil water that plant roots of most crops can absorb readily; expressed in millimeters (mm) of water per mm of soil (inches per inch, inches per foot or total inches) for a specific soil depth. It is the amount of water stored in the soil between field capacity (FC) and permanent wilting point (WP). It typically is adjusted for salinity (electrical conductivity) and rock fragment content. In some texts it also is called available water-holding capacity (AWHC).
Crop evapotranspiration (ETc): The amount of water used by the crop in transpiration and building of plant tissue, and that evaporated from adjacent soil or was intercepted by plant foliage. It is expressed as depth in mm (inches, or as the volume-depth ratio of acre-inches per acre) and can refer to daily, peak, design, monthly or seasonal quantities. Sometimes referred to as consumptive use (CU).
Crop water use: Calculated or measured water used by plants; expressed in mm per day (inches per day). Same as ETc except it is expressed as daily use only.
Deficit irrigation: An irrigation water management alternative where the soil in the plant root zone is not refilled to field capacity in all or part of the field.
Field capacity (FC): Amount of water remaining in a soil when the downward water flow due to gravity becomes negligible. An estimate of field capacity ranges between soil water contents at matric potentials of minus 10 to minus 33 kilopascal (kPa) (minus 0.1 to minus 0.33 bar).
Irrigation scheduling: The process of determining when to irrigate and how much water to apply based upon measurements or estimates of soil moisture or water used by the plant.
Management-allowed depletion (MAD): The desired soil-water deficit at the time of irrigation.
Permanent wilting point (PWP): Soil water content below which plants cannot readily obtain water and permanently wilt. Sometimes called “permanent wilting percentage,” or WP. Often estimated as the water content corresponding to a matric potential of minus 1.5 megapascal (MPa) (minus 15 bar).
Soil-water deficit: Amount of water required to raise the soil-water content of the crop root zone to field capacity. It is measured in mm (inches) of water. Also called soil-water depletion.
Water application efficiency: Ratio of the average depth of water infiltrated and stored in the root zone to the average depth of water applied.
Water-holding capacity (WHC): Total amount of water held in a freely drained soil per increment of depth. It is the amount of water held between field capacity and the oven-dry moisture level; expressed in centimeters/centimeters (cm/cm) (inches/inch), centimeters/meter (cm/m) (inches/foot) or total centimeters (inches) for a specific soil depth. Sometimes called total water-holding capacity.
A system for scheduling irrigation using the “checkbook” method is outlined in this publication. It’s called the checkbook method because it operates just like a bank checking account. Rain and irrigation are deposits to the soil and the crop withdraws water from the root zone.
During the critical growth periods, the checkbook requires almost daily updates by the irrigator and, if used properly, it is a proven tool for irrigation scheduling.
Quick Start to Using the Checkbook
The Root Zone
Assuming no subsurface restrictions, at maturity, each crop has a typical fully developed root zone depth. The root zone determines to what depth the plant can extract water from the soil.
The root zone of annual crops may not fully develop until eight weeks after the crop emerges. However, established perennials such as alfalfa and forage grasses will start with deeper roots.
Plant roots extract the greatest amount of soil water from the upper part of the root zone, and each crop is different. Generally, for all the crops shown in Figure 1, more than 90% of the water extracted from the root zone during the growing season will come from the depth shown as shaded.
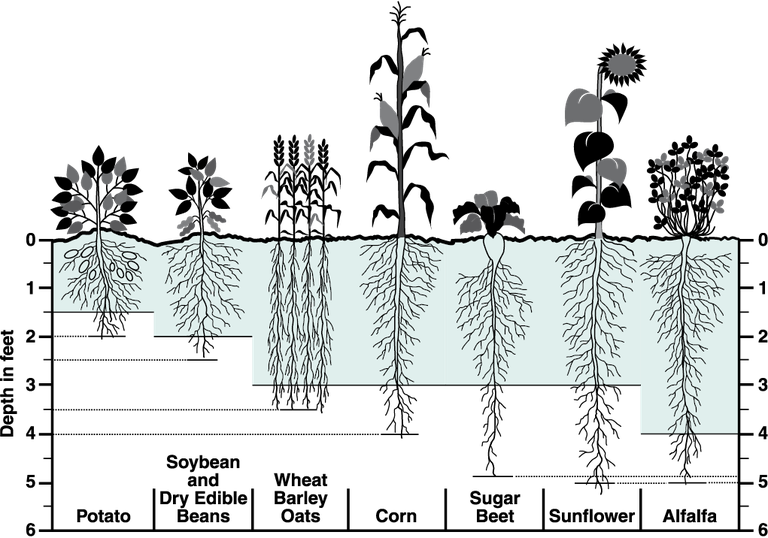
Therefore, a depth less than a fully developed root zone can be used for irrigation management purposes. Fully developed root zone depths, along with irrigation management depths, are shown in Table 2.
| Crop | Depth of Fully Developed Root Zone (inches) | Depth of Root Zone for Irrigation Water Management (inches) |
|---|---|---|
| Potatoes | 24 to 30 | 18 |
| Soybeans, dry edible beans | 30 to 36 | 24 |
| Wheat, barley, oats | 42 to 48 | 36 |
| Corn, sugarbeets, sunflowers | 48 to 54 | 36 |
| Established alfalfa and forage grasses | 60 to 72 | 48 |
At the beginning of crop emergence and growth, having the soil water-holding capacity in the total root zone at or near field capacity is important. Moist soil is necessary for germination and proper root development.
However, low previous autumn rainfall, no winter snow accumulations and less spring rain may result in dry subsoil below about 2 feet. Under these conditions, irrigating prior to or after planting to store water in the lower part of the root zone may be necessary.
Roots will not grow through or into a dry layer of soil, and a reduced root depth will result. Thus, checking the soil moisture to at least the 3-foot depth prior to or at planting time is important.
Determining Soil Water Deficit
The checkbook expresses the soil water content in terms of deficit, which is the difference between the soil water content at field capacity and the current soil water content in the root zone. It is presented as inches of water deficit or as a percentage of the available water capacity.
Think of it as the amount of water required to fill the root zone to field capacity or the point of zero deficit. One way to picture this concept is to imagine a tube that contains 4 inches of water when full, but if it only contains 3 inches of water, then it is one-fourth low, or it has a deficit of 1 inch of water, or 25%. To fill the tube, 1 inch must be added.
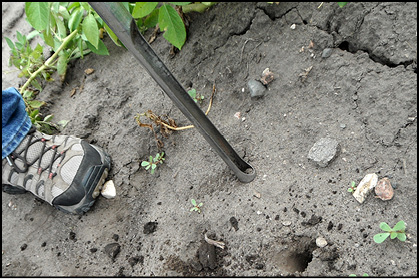
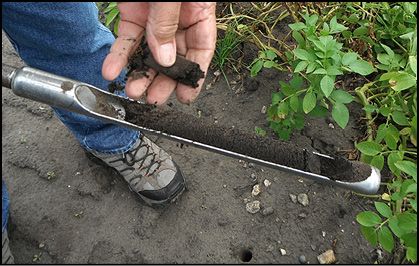
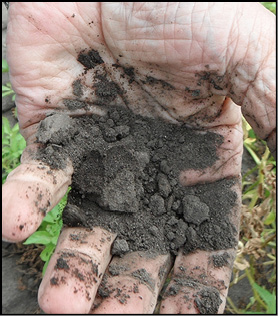
To begin the checkbook method of scheduling, you must determine the soil water content in the field at the start of the growing season (day of emergence). The initial soil water content can be determined with soil moisture sensors, but the easiest way is to use a soil probe to obtain samples from several areas of the field. Pay particular attention to areas with the coarsest soil textures.
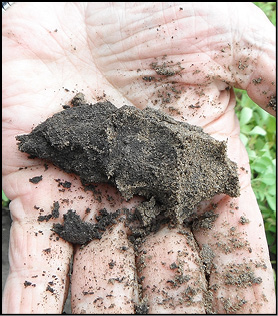
Estimate the soil water deficit using the “Feel Method” outlined in Table 5. Soil samples should be taken in 6-inch increments to the depth used for water management (Table 2). Brochures with pictures showing the feel method for various soil textures can be found on the internet by doing a search using “soil water by the feel method” or go to the website listed in the section titled Additional Irrigation Scheduling Resources for North Dakota.
| Soil Water Deficit | Fine Sands and Loamy Sands | Sandy Loams and Fine Sandy Loams | Loams, Silt Loams, Silty Clay Loams | Clay Loams, Silty Clays and Clay |
| 0% to 5% (about) (field capacity) | Upon squeezing, no free water appears on soil but wet outline of ball is left on hand, 0.0 | Upon squeezing, no free water appears on soil but wet outline of ball is left on hand, 0.0 | Upon squeezing, some free water appears on soil with wet outline of ball left on hand, 0.2 | Upon squeezing, some free water appears on soil with wet outline of ball left on hand, 0.3 |
| 5 – 25% - Wet | Forms a weak ball under pressure with water staining on fingers, 0 to 0.2 | Forms a weak ball and makes a weak ribbon that breaks easily, 0 to 0.4 | Forms a ball; very pliable that ribbons easily, 0.0 to 0.5 | Forms a ball, ribbons easily and has a slick feeling, 0 to 0.6 |
| 25 – 50% - Moist | Forms a weak ball; will not ribbon but some water staining on fingers, 0.2 to 0.5 | Forms a ball under pressure with light staining on fingers, 0.4 to 0.8 | Forms a ball that is somewhat plastic and forms a weak ribbon, 0.5 to 1.0 | Forms a smooth ball and ribbons, 0.6 to 1.2 |
| 50 – 75% - Slightly Moist | Appears to be dry but will form a weak ball when squeezed, 0.5 to 0.8 | Forms a weak ball with finger marks but not much staining on fingers, 0.8 to 1.2 | Forms a weak ball but holds together with pressure and no water staining on fingers, 1 to 1.5 | Forms weak ball; somewhat pliable but no water stains on hand, 1.2 to 1.9 |
| 75 – 100% - Dry (100% soil water deficit results in permanent wilting) | Dry, loose and single grains flow through fingers, 0.8 to 1 | Forms a very weak ball and soil grains break away easily, 1.2 to 1.5 | Dry and sometimes slightly crusted; clods crumble with pressure, 1.5 to 2 | Baked hard; clods are hard to crumble with pressure, 1.9 to 2.5 |
The total root zone deficit is computed by adding the deficits for each foot. The example below shows the procedure to estimate the soil water deficit in a 3-foot root zone. This should be done at the start of the growing season and about every two weeks after emergence, depending on rain events.
| Soil Water-holding Capacity at One Location in the Field | |||
|---|---|---|---|
| Estimated Deficit | |||
| Soil Depth | Soil Texture | Average Water-holding Capacity (Table 1) | |
| 0 to 1 foot | Fine sandy loam (fsl) | 0.16 inch per inch | |
| 1 to 3 feet | Loamy sand (ls) | 0.09 inch per inch | |
| Soil Depth | Water-holding Capacity (Table 1) | Estimated Percent Deficit from Field Measurements (Table 5) | Deficit (inches) |
| 0 to 6 inches | 6 in x 0.16 in/in = 0.96 | x 50 % | = 0.48 |
| 6 to 12 inches | 6 in x 0.16 in/in = 0.96 | x 40 % | = 0.38 |
| 12 to 24 inches | 12 in x 0.09 in/in = 1.08 | x 30 % | = 0.32 |
| 24 to 36 inches | 12 in x 0.09 in/in = 1.08 | x 20 % | = 0.22 |
| Total | 4.1 | 1.4 | |
| Percent Deficit | 34 | ||
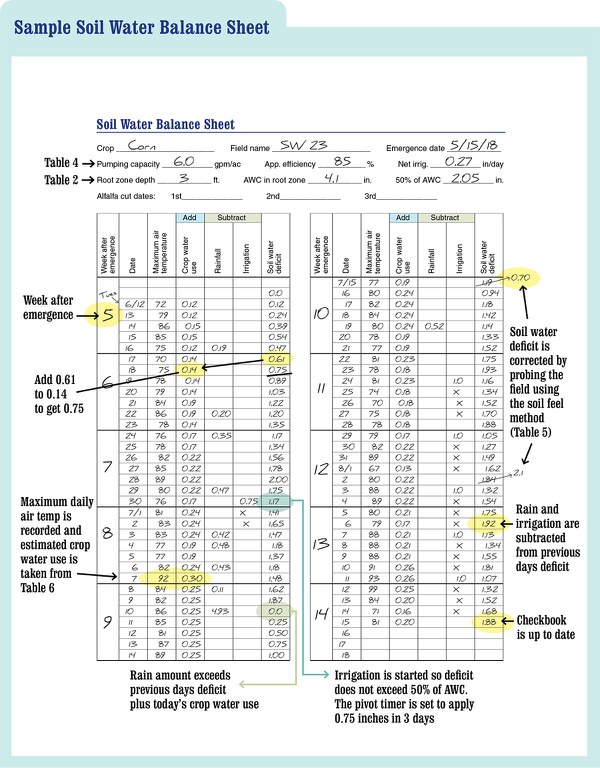
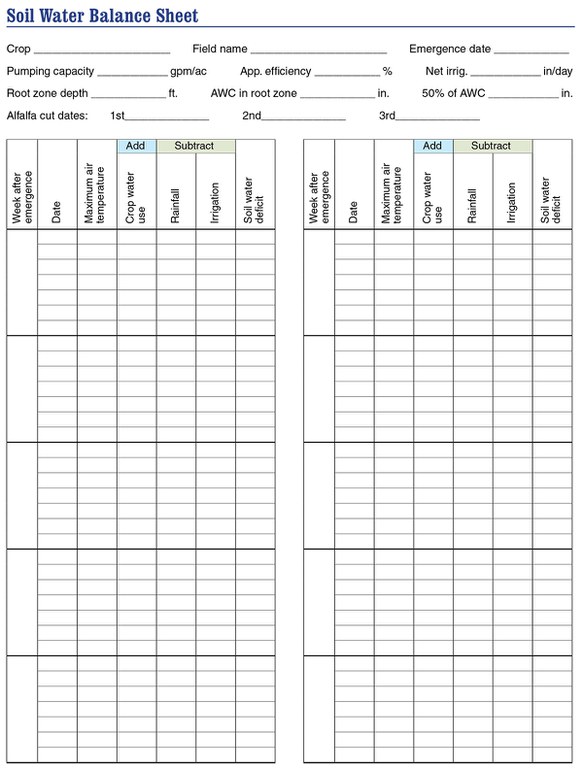
Soil Water Balance Sheet
A completed soil water balance sheet example and blank copies are included in this publication. The irrigation manager should keep a balance sheet for each individual irrigated field. Keeping a soil water balance between zero and the allowable deficit for the specific crop in the field is the goal of irrigation scheduling.
Recording Rain and Irrigation Amounts
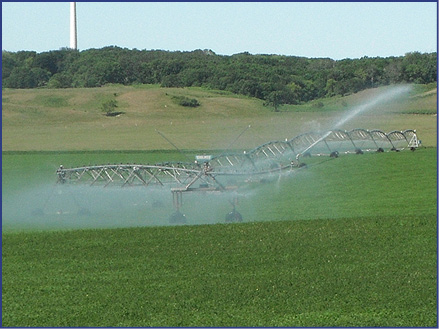
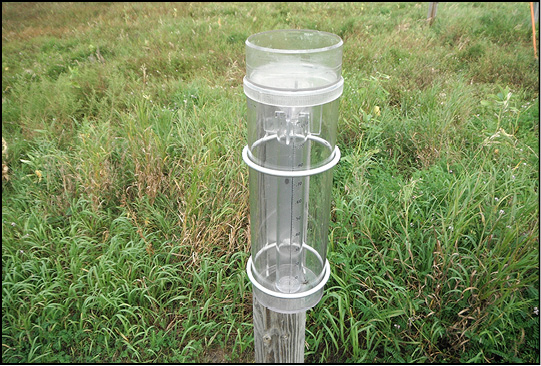
To use the balance sheet, the dates and measured amounts of irrigation and rain must be recorded. Rain is so variable over the landscape that two easily accessible rain gauges should be located in or near each irrigated field. Ideally, rain gauges should be located as shown in Figure 2.
The rain gauges should be at least 3 inches in diameter for accuracy. The standard 4-inch-diameter National Weather Service rain gauge that records rain events to 0.01 inch is highly recommended.

Daily Crop Water Use Estimates
Tables 6 through 14 provide estimates of water use for the major irrigated crops in North Dakota. To use the tables, you need to know the daily maximum air temperature and the number of weeks after emergence. To make the process easy, the maximum air temperature for a day has to be only within a 10-degree range. As an illustration, on the example soil water balance sheet, the maximum temperature on July 11 was 85 degrees.
To obtain a crop water use estimate for corn, look on Table 6 under the ninth week after emergence in the row for the range of 80 to 90 degrees to find a crop water use estimate of 0.25 inch. Estimating alfalfa water use is different because alfalfa is cut several times during the growing season and water use is reduced after cutting. The additional tables that accompany Table 14 can be used to estimate alfalfa water use the first three weeks after cutting.
Site-specific and more accurate crop water use values can be obtained by accessing the North Dakota Agricultural Weather Network website. Look under “Applications” in the left-hand menu. To obtain the water use estimates, select the nearest weather station on the network, the crop, emergence date and time period.
To use the balance sheet, enter the estimated water use and add this to the previous day’s soil water deficit. For the first day after emergence, enter the estimated deficit from the field measurements. Subtract rain and/or irrigation for that day and record the new soil water deficit amount.
Compare this to the 50% deficit point shown at the top of the balance sheet (2.05 inches on the example balance sheet) to determine when irrigation is needed. Of course, check weather reports to see if rain is forecast for the area where the field is located.
Remember, the soil water deficit never can be less than zero because zero indicates the soil is at field capacity. If a negative deficit is calculated for a particular day, enter zero in the deficit column.
To ensure the checkbook is tracking the soil water deficit accurately, the field should be probed to root zone depth about every two weeks at several locations. If the checkbook is different from the field measurements, enter the measured deficit value for that day.
Acknowledgments
The first version of this publication was authored by Darnell R. Lundstrom and Earl C. Stegman in 1976, reprinted in 1983 and revised in 1988. This publication is a revision and update of the 1988 version. We are indebted to these gentlemen for coining the term “Checkbook Method,” which is used throughout the U.S. to refer to soil water accounting methods for irrigation scheduling.