Pinto Bean Response to Phosphorus Starter Fertilizer in East-central North Dakota
(A1883, April 2023)This is a production reference to highlight pinto bean fertilizer research.
Results and Discussion
In individual trials, pinto bean seed yield response did not always occur among fertilizer treatments.
Seed yield averaged across seven trials increased 3.1 hundredweight (cwt) per acre (11 percent), compared with the untreated check (Figure 1).
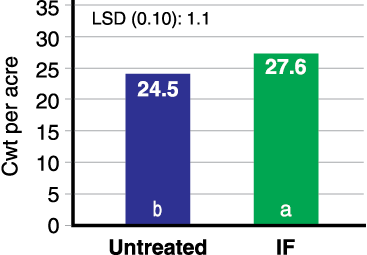
* Soil P: 5 to 8 ppm (low to medium). 10-34-0 rates: 2 to 3 gpa.
Averaged across six trials, IF-applied 10-34-0 at 2 to 3 gallons per acre (gpa) reduced the pinto bean plant population by 4 percent, compared with the untreated check (Table 1). Given the reduction in plant population due to IF application, a separated seed to fertilizer band might be most beneficial.
| Method | Rate (gpa) | Plants per acre |
|---|---|---|
| Untreated check | 68,860 a | |
| IF | 2 to 3 | 65,835 b |
| LSD (0.10) | 2,070 | |
| * Soil P: 5 to 8 ppm (low to medium). | ||
Pinto bean yield between IF- and band-applied 10-34-0 at 3 to 6 gpa was statistically similar averaged among seven trials (Figure 2). However, the plant population was reduced an average of 13 percent with IF-applied 10-34-0, compared with band-applied 10-34-0 and the untreated check (Table 2). The banded fertilizer application provides soil separation between fertilizer and bean seed that reduces the risk of seed damage from fertilizer salts and ammonium-N (Franzen, 2017).
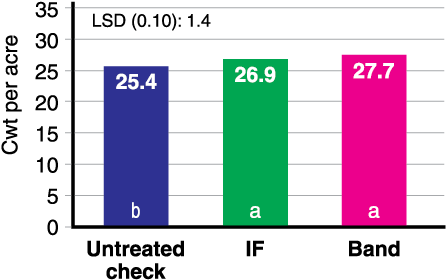
* Soil P: 5-10 ppm (low-med). 10-34-0 rates: 3 to 6 gpa.
| Method | Rate (gpa) | Plants per acre |
|---|---|---|
| Untreated check | 57,160 a | |
| IF | 3 to 6 | 50,650 b |
| Band | 3 to 6 | 59,730 a |
| LSD (0.10) | 2,990 | |
| * Soil P: 5 to 10 ppm (low to medium) | ||
Averaged across three trials, pinto bean yield was similar between broadcast-applied 10-34-0 and the untreated check, while yield increased 4.9 cwt per acre with IF- or band-applied 10-34-0, compared with the untreated check (Figure 3).
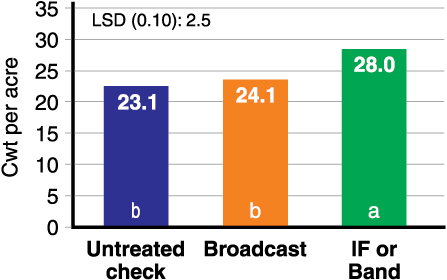
* Soil P: 5 ppm (low). 10-34-0 rates: 2013 = 8 gpa broadcast PRE (without mechanical incorporation) and 5 gpa IF and band; 2014 = 9 gpa broadcast PPI and 6 gpa IF; and 2015 = 4.5 gpa broadcast PPI and 3 gpa IF and band.
Broadcast 10-34-0 at 8 gpa was applied immediately after planting (PRE) without mechanical incorporation in 2013, and was preplant applied and incorporated (PPI) at 9 gpa in 2014 and 4.5 gpa in 2015. IF- and band-applied fertilizer rates were one-third less, compared with the broadcast rate in the trials.
Averaged across three trials, pinto bean yield did not increase with midrow band application (centered between 22- or 30-inch rows) at 4 or 6 gpa of 10-34-0 at planting, compared with the untreated check. Also, midrow band application of 10-34-0 averaged 12 percent less yield than with similar fertilizer rates of IF- or band-applied (Figure 4).
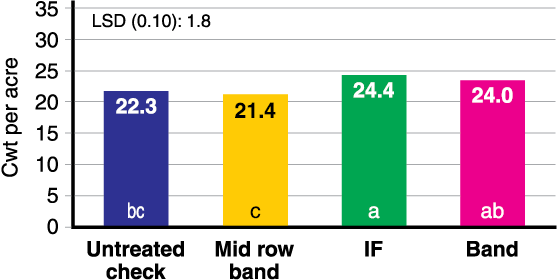
*Soil P: 7 to 10 ppm (low to medium). 10-34-0 rates: 4 or 6 gpa.
Pinto bean yield, averaged across three trials, was similar with low (2.5 to 3 gpa) and high (5 to 6 gpa) rates of IF-applied 10-34-0 (Figure 5). The plant population was statistically similar between the untreated check and low fertilizer rates, while high fertilizer rates decreased the population by 13 percent, compared with the untreated check (Table 3).
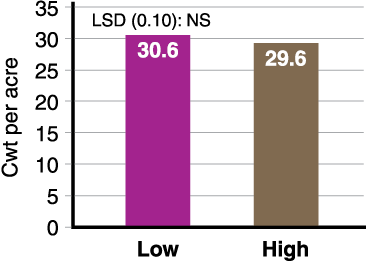
* Soil P: 5 to 6 ppm (low). 10-34-0 rates: low = 2.5 to 3 gpa; high = 5 to 6 gpa.
| Method | Rate (gpa) | Plants per acre |
|---|---|---|
| Untreated check | 68,830 a | |
| IF | 2.5 to 3 | 65,050 a |
| if | 5 TO 6 | 59,800 b |
| LSD (0.10) | 4,720 | |
| * Soil P: 5 to 6 ppm (low) | ||
At similar rates of IF-applied P, pinto bean yield averaged across three trials with 10-34-0 was similar to yields from the low-salt fertilizer 6-24-6 application (Figure 6). Also, the plant population was statistically similar between the two fertilizers; however, the plant population was lower, compared with the untreated check (Table 4). K soil levels in the trials were high to very high.
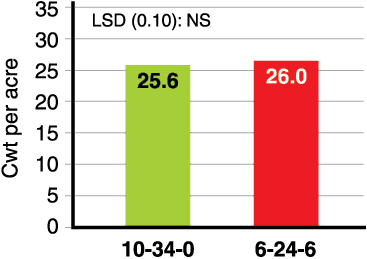
* Soil P: 5 to 7 ppm (low). Fertilizer rates: 2014-15 = 10-34-0 at 3 gpa and 6-24-6 at 4.5 gpa; 2016 = 10-34-0 at 2.75 gpa and 6-24-6 at 4.25 gpa.
| Fertilizer | ||
|---|---|---|
| Type | Rate (gpa) | Plants per acre |
| Untreated check | 67,510 a | |
| 10-34-0 | 2.75 to 3 | 61,540 b |
| 6-24-6 | 4.25 to 4.5 | 62,630 b |
| LSD (0.10) | 2,990 | |
| * Soil P: 5 to 7 ppm (low) | ||
Reference
Franzen, D.W. 2017. Fertilizing pinto, navy and other dry edible bean. NDSU Extension Service publication SF720 (Revised).
Research was partially supported by the Northarvest Bean Growers Association.

April 2018