Title

Solid Manure Sampling for Nutrient Management Planning

(NM1259, Revised May 2026)
Summary

Accurate sampling and laboratory testing provides actual manure nutrient information. This information allows crop producers to strategize for maximum crop yields and minimal manure nutrient impact to the environment.

Lead Author
Lead Author:
Mary A. Keena, Livestock Environmental Management Extension Specialist Carrington Research Extension Center
Availability
Availability:
Web only
Publication Sections
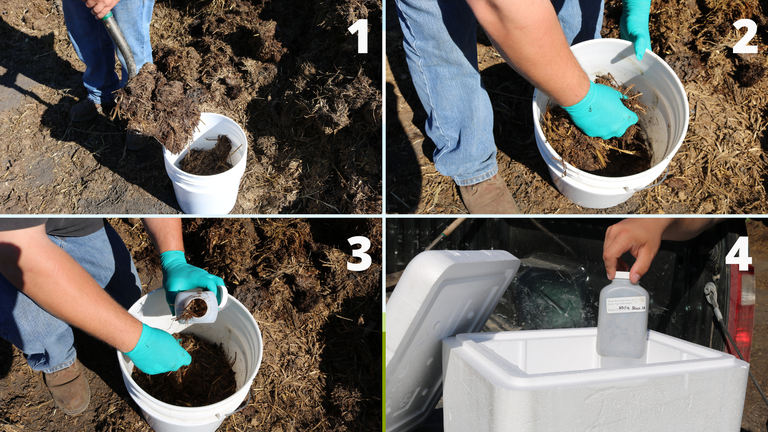
Figure 1

Steps

  1. Collect 10 quart-sized subsamples from various depths and locations in the manure pile and place them together in a bucket.
  2. Mix the subsamples together thoroughly.
  3. Place one pint-sized sample into a sampling container.
  4. Place the labeled sample in a cooler and transfer to a freezer if you are not delivering it to the lab on the day it is collected

Why sample manure?

Manure is highly variable in composition and nutrient availability compared with commercial fertilizer, which has a guaranteed analysis. As reported in the publication Nutrient Characteristics of Solid Beef Manure in North Dakota, the nitrogen in solid beef manure in North Dakota ranges from 4 pounds/ton to 32 pounds/ton. Manure nutrient values depend on many things, including:

  • Manure type
  • Animal source
  • Animal size
  • Animal diet
  • Bedding used
  • Weather conditions
  • Manure handling practices
  • Storage systems

Accurate sampling and laboratory testing provides actual manure nutrient information. This information allows crop producers to strategize for maximum crop yields and minimal manure nutrient impact to the environment.

How should solid manure be sampled?

It is best to contact the laboratory you wish to send your sample to before taking samples.

This is because each lab may have its own preferences for sample size, packaging and delivery. Some labs will furnish sample containers and mailers free of charge. Your local Extension agent can help you find a lab that is right for your needs.

If you have manure storage sites (stockpiles, compost, etc.) from multiple animal sources, ensure you collect samples from each site. Samples should be taken from each manure storage site that represents a different animal source, type, size, age, diet, management practice and type of storage structure or other factors that could affect nutrient values.

To start the sampling process, collect 10 to 15 quart-sized subsamples from various locations and depths in the pile using a spade or shovel. Avoid sampling the dry top crust or other parts of the stockpile that may not be representative. Mix subsamples thoroughly in a bucket. Collect 1 to 2 pints, and place in a clean, sealable plastic bag, a clean plastic bottle with a lid, or use the sampling containers the lab has provided you.

This sampling procedure is consistent with analysis criteria stated in the USDA-NRCS North Dakota 590 Nutrient Management Standard.

How should manure samples be handled?

Samples must be labeled before sending to the lab for analysis. Labeling with date, species and location is a good practice (for example, fall 2019 beef stockpile). If collected during warm weather, the sample should be placed on ice, in a cooler, and delivered to the lab as soon as possible.

If samples are going to be mailed, freeze immediately after collection. Send samples early in the week to avoid weekend layovers.

Manure is changing constantly in physical, chemical and biological characteristics. Keeping samples cool slows the process of change and gives you a better snapshot of what is happening in the stockpiled manure.

What to analyze?

When a manure sample is submitted for analysis, you will need to tell the lab what nutrients you want analyzed. You can request almost any nutrient, as well as organic matter, pH and electrical conductivity (salts).

Total nitrogen (N), inorganic N, phosphorus (P) as P2O5, and potassium (K) as K2O are the main nutrients you need to know for nutrient planning. Other nutrients such as sulfur and zinc also may be important for nutrient planning purposes. Total salt analysis may be useful if salts are a concern in the soil to which manure is to be applied.

How do I read my manure report?

Sample _________________________________

Type _________________________________

Source _________________________________

Storage _________________________________

Lab number _________________________________

Sample is what you have named the sample to remember where it was taken from (for example, bull pen vs. finishing steers vs. stockpile).

Type and source describe what kind of manure and the species from which it was taken.

Storage describes how the manure was stored when the sample was taken (for example, stockpiled vs. composted vs. not piled).

Lab number is assigned by the lab and used if you ever have any questions about your manure report. You can call the lab that did the analysis and receive information by using this number.

Moisture 46

Dry matter 54

• These numbers are expressed as percentages. The moisture is the percent of water that was in the sample when it arrived at the lab. The dry matter (DM) is the percent of everything left (solids) after the sample is dried.

Dry BasisAs Receivedlbs/ton
Total nitrogen (N) 1.00%20
Ammonium nitrogen 0.0053%0.11
Nitrate nitrogen 0.052%1.00
Inorganic nitrogen 0.057%1.1
Organic nitrogen 0.94%19
Phosphate (P2O5)0.73%0.39%7.9
Potash (K2O)0.78%0.42%8.4

Dry Basis is the percent of each element present in the manure sample; it’s calculated after removal of moisture from the sample.

As Received is the percent of each element present in the manure sample; it’s calculated with no manipulation (drying) of the sample.

Lbs/ton is the total pounds of each element that is present in 1 ton (2,000 pounds) of manure.

How should results be reported?

Manure test results should be reported “as is” or “as received” because that is the way manure will be land applied. If results are on a dry-matter basis, values can be multiplied by the manure dry-matter percentage (expressed as a decimal) to obtain the equivalent wet weight.

Example:

If total N = 2% dry basis and the sample is 60% dry matter, then N = 2 x 0.6 = 1.2% as is.

The nutrient content of the manure should be in the same units used in calibrating the land application equipment. For solid manure, typically pounds per ton is used.

For solid manure spreader calibration procedures, see NDSU Extension publication “Manure Spreader Calibration for Nutrient Management Planning” (NM1418).

Phosphorus should be reported as P2O5 because this is the value used in fertilizer application planning. If results are in elemental P, the conversion formula is: P x 2.29 = P2O5.

Potassium should be reported as K2O because this is the value used in fertilizer application planning. If results are in elemental K, the conversion formula is: K x 1.20 = K2O.

If results are given in percents, the following conversion factor can be used to get results in a more usable form: percent x 20 = pounds per ton. For example, in the table at left, total N is 1.00 as received x 20 = 20 lbs/ton or K2O is 0.42 as received x 20 = 8.4 lbs/ton.

How can manure analyses be used?

Using Tables 1 and 2 (Page 4), the crop-available portion of manure nutrients can be estimated. Manure nutrient analyses, combined with soil tests, previous crop credits and crop nutrient requirements, can be used to determine the proper application rate for manure.

Determine crop nutrient requirements using NDSU Extension publication “North Dakota Fertilizer Recommendation Tables and Equations” (SF882) and the Crop Production Tools found here: www.ndsu.edu/agriculture/ag-hub/ag-topics/crop-production/crop-producti….

Table 1. Nitrogen Availability and Loss as Affected by Method of Manure Application for Beef

Year Available1

Percent of Total Nitrogen Available Per Year

Broadcast Incorporation Time1

> 96 hrs.

12-96 hrs.

< 12 hrs.

Year 1 (first crop)

25

45

60

Year 2 (second crop)

25

25

25

Adapted from: Calculating manure application rates. Table 1: Nitrogen availability and loss as affected by method of manure application and animal type. University of Minnesota Extension. 2019. Accessed May 2020.
2Timing categories refer to the length of time between manure application and incorporation.

Table 2. Phosphorus and Potassium Crop Availability for Beef Manure

Nutrient

Percent of Total P & K Available in Year One

Phosphorus80%
Potassium90%
From: Manure Characteristics. Figure 4. Calculations for determining plant available phosphorus and plant available potassium. University of Minnesota Extension. 2021. Accessed March 2026. https://extension.umn.edu/manureland-application/manure-characteristics…

Example

Using the North Dakota Corn N Calculator, it can be determined that for corn grown in Foster County under conventional tillage methods of medium-texture soils with historic yields > 160 bu/ac with 45 lbs/ac soil test N and soybean as the previous crop, you need 137 lbs N/ac. Knowing there is 20 lbs of N/ton from the manure analysis and that approximately 50% of the total N is available for crop production during year one, you would need to apply the manure at a rate of 13.7 tons/ac. Using NDSU SF-882, we know that if our soil test P is in the medium range (8-11 ppm) we need to add 52 lbs P205/ac and if soil test K is in the high range (121-160) then we need to add 60 lbs K2O/ac. We know from our sample above that there are 7.9 lbs/ton P2O5 and 8.4 lbs/ton K2O in the manure. Remember, 80% of the P and 90% of the K are available the first year for plant growth. So, if you’re spreading 13.7 tons/ac then you are applying 87 pounds of P/ac and 104 pounds of K/ac. Applying the manure from the sample above at a rate of 13.7 tons/ac meets/exceeds the necessary crop requirements.

Need more assistance?

If you have questions about manure analysis or nutrient management planning, please contact your local Extension office (www.ndsu.edu/agriculture/extension/extension-county-offices).

Reviewers: Leslie Johnson, University of Nebraska-Lincoln Extension; Penny Nester, NDSU Extension Agent, Kidder County; Angie Johnson, NDSU Extension Agent, Steele County.

The current author extends appreciation to the previous authors for their contributions.

NDSU Extension does not endorse commercial products or companies even though reference may be made to tradenames, trademarks or service names.

For more information on this and other topics, see www.ndsu.edu/extension