Black and Navy Bean Response to Row Spacing and Plant Population in Eastern North Dakota
(A1921 Revised April 2022)Research data summarizes black and navy bean seed yield response to reduced row spacing and increased plant populations compared to traditional recommendations.
Results
Black bean seed yield was statistically different among means of the two factors averaged across four years at Carrington (Table 1). Among plant populations, which averaged 101,700, 126,200 and 148,500 plants per acre, yield increased 13% to 14% with 14-inch rows compared to 28-inch rows. However, among plant populations, 21-inch rows had similar yield as 28-inch rows. Within each row spacing, yield did not differ among plant populations.
Table 1. Black bean seed yield among row spacings and plant populations, Carrington, 2014 and 2016-18 (4 site-years).
| Plant population | |||
|---|---|---|---|
| Row spacing | 101,700 | 126,200 | 148,500 |
| Inches | Seed yield (lb. per acre) | ||
| 14 | 2210 ab1 | 2290 a | 2270 a |
| 21 | 2050 bc | 2080 abc | 2090 abc |
| 28 | 1940 c | 2030 bc | 2010 bc |
| LSD (0.05) | - - - 220 - - - |
1 Means with no similar letters are significantly different.
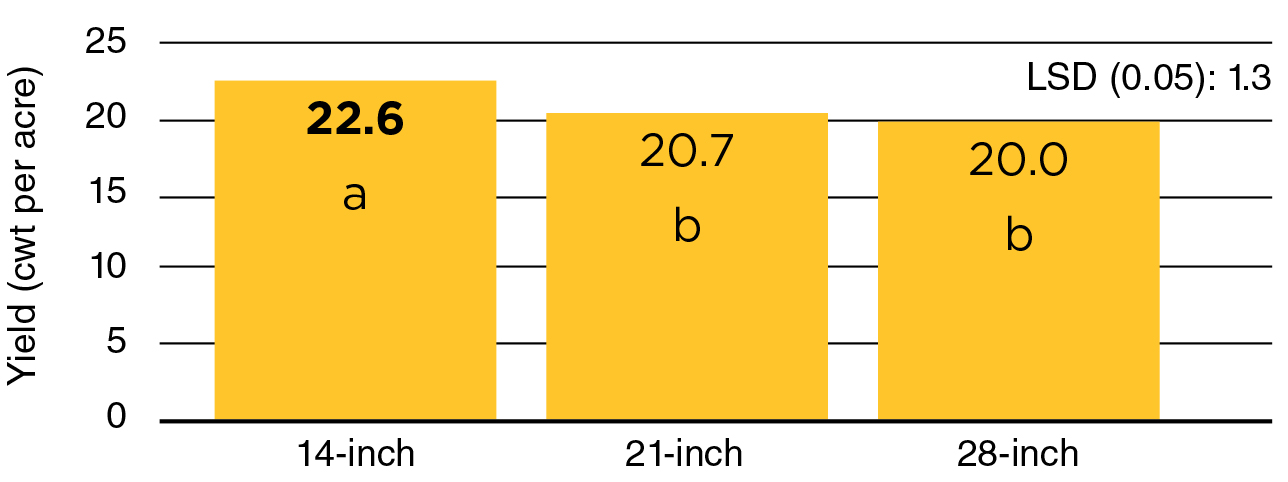
Averaged across four years and plant populations at Carrington, black bean yield with 14-inch rows was 9% and 13% greater compared to yield with 21- and 28-inch rows, respectively (Figure 1). Plant emergence, flowering and physiological maturity dates generally were similar with row spacing each year of the study (data not shown). Canopy closure visually evaluated during late July to early August and averaged over three years was 85%, 76% and 64% with 14-, 21- and 28-inch rows, respectively. Test weight and seed size generally were similar among row spacings (data not shown).
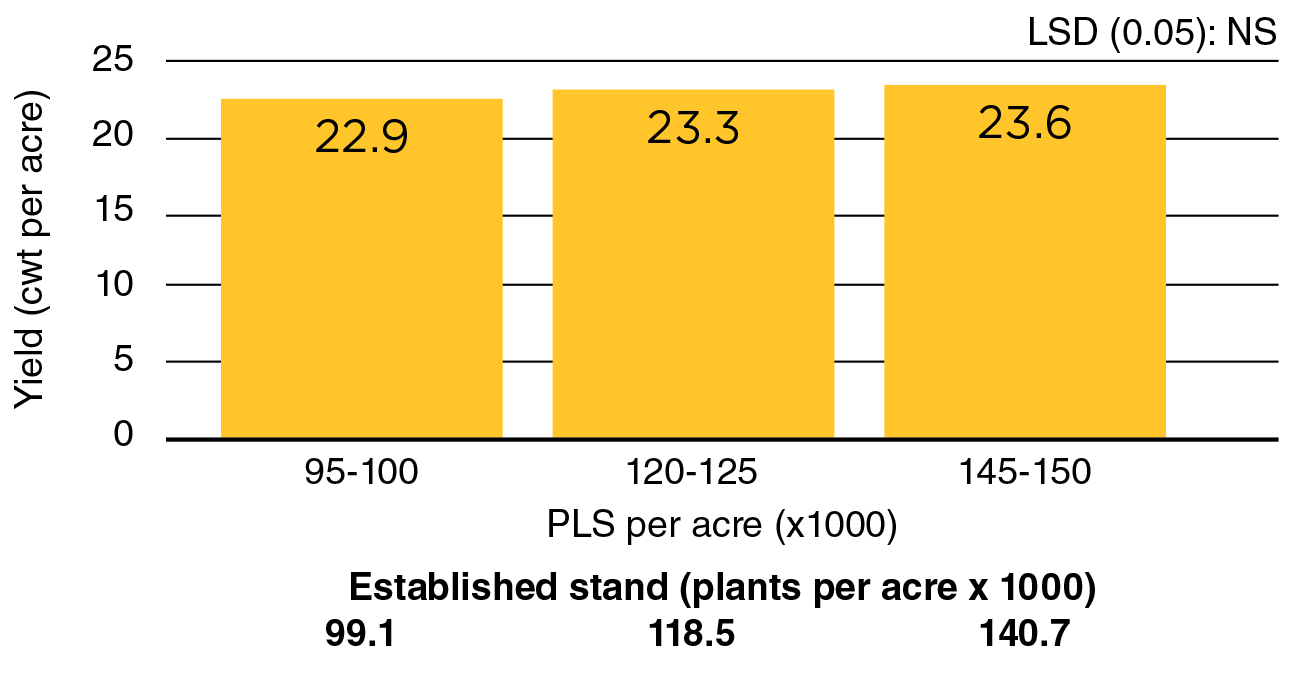
Averaged across eight site-years, black bean planted at the low, medium and high rates produced 99,100, 118,500 and 140,700 plants per acre, respectively (Figure 2). Yield was statistically similar among plant populations. Plant emergence, flowering and physiological maturity dates generally were similar with plant population (data not shown). Canopy closure, averaged across five site-years, generally was similar among plant populations. Also, test weight and seed size were similar with plant population at each of the eight site-years of the study.
Averaged across row spacings.
Navy bean seed yield, averaged across three site-years at Carrington, was statistically different with the two-factor interaction (Table 2). Averaged across three years and rows, plant population was 92,600, 116,800 and 139,800 plants per acre with the low to high planting rates, respectively. Highest yield was achieved at 2,790 and 2,660 lb. per acre with 14-inch rows and the high and medium plant populations, respectively. The combination of 14-inch rows and plant populations of greater than 115,000 plants per acre increased yield 24% to 28% compared to 28-inch rows with slightly more than 90,000 plants per acre.
Among the three plant populations, navy bean seed yield increased 10% to 23% with 21-inch rows compared to 28-inch rows. Within 21- and 28-inch rows, yield did not increase with increasing plant populations.
Navy bean plant emergence, flowering date and physiological maturity generally were similar with row spacing and plant population each year of the study at Carrington (data not shown). Canopy closure, averaged over two years, was 91%, 76% and 70% with 14-, 21- and 28-inch rows, respectively. Also, canopy closure was similar among plant populations (data not shown). Test weight and seed size were similar with row spacing and plant population each year of study.
Table 2. Navy bean seed yield among row spacings and plant populations, Carrington, 2014 and 2016-17 (3 site-years).
| Plant population (per acre) | |||
|---|---|---|---|
| Row spacing | 92,600 | 116,800 | 139,800 |
| Inches | Seed yield (lb. per acre) | ||
| 14 | 2580 bc1 | 2660 ab | 2790 a |
| 21 | 2470 cd | 2340 d | 2340 d |
| 28 | 2010 e | 2070 e | 2120 e |
| LSD (0.10) | - - - 180 - - - |
1 Means with no similar letters are significantly different.
References
Knodel, J.J., P.B. Beauzay, M. Ebert, G.J. Endres, D.W. Franzen, J. T. Ikley, H.J. Kandel, S.G. Markell, and J.M. Osorno. 2022. 2021 Dry bean grower survey of production, pest problems and pesticide use in Minnesota and North Dakota. NDSU Extension publication E2052.
Schatz, B.G., S.F. Zwinger, and G.J. Endres. 2000. Dry edible bean performance as influenced by plant density. NDSU Carrington Research Extension Center. Crop and Livestock Review. Vol. 41, p. 9.
Northarvest Bean Growers Association provided financial support for this study.