Fertilizing Sunflower
(SF713 Revised Sept. 2022)This publication contains updated information for use in backup of the N calculator for sunflower, and also includes information for sunflower growers in the Langdon Region
Nitrogen
The sunflower recommendations are regionally-based and tillage-based. Perhaps due to the deeper rooting nature of sunflower, soil texture had less effect on yield compared with clay texture effect on corn N use efficiency in previous studies. However, at most sites that were planted to sunflowers for the first time in more than 30 years or did not have a deep-rooted crop such as sugar beets or sunflowers within the past five years, yield response was very slight, if any increase occurred. Oil content tended to be near or below 40%, even with zero added N. This would be possible only if these locations have some unaccounted-for deep N. The western North Dakota site that was not planted to sunflower for at least five years experienced a major drought in 2012, followed by relatively wet seasons in 2013-2015, which may have moved N downward in the soil. In the sunflower crop of 2015, the deeper N in this field likely was tapped, resulting in no yield increase with higher N rates and relatively low oil content in the seed. The sites in eastern North Dakota without sugar beet or sunflower in recent memory likewise did not have increased yield with higher N rates and had oil content that, even at the zero N rate, was below 40%.
If practical, new fields intended for sunflower should be sampled to a 4-foot depth to determine if deep N should be considered in N fertility recommendations. About 30 pounds of N from 2 to 4 feet in depth are assumed but not subtracted from N recommendations. If the 2- to 4-foot soil nitrate test is greater than 30 pounds N per acre, then the extra N should be subtracted from the total N recommendation.
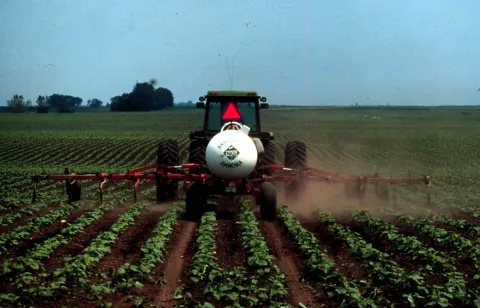
If deeper soil sampling is not practical, an N nonlimiting area of a full rate of N based on the N calculator or the N recommendation tables should be applied, and about half the N calculator rate should be applied to the rest of the field. Using an active-optical sensor or “best-guess” assessment of color differences and vigor of the N nonlimiting area, compared with the rest of the field, a decision whether or not to apply additional N in-season could be made or not made between stage V-8 to R1 (approximately V12 to V14) using a side-dress applicator or high-clearance applicator (Figure 1). In fields without a history of sunflower, sugar beet or another deep-rooted crop such as safflower, no additional N likely needs to be applied.
Soil sampling to 2 feet in depth is very important for N recommendations in this region. Including soil test nitrate-N into analysis of N rate vs sunflower yield trials greatly increased the relationship of total known available N to relative yield in all regions.
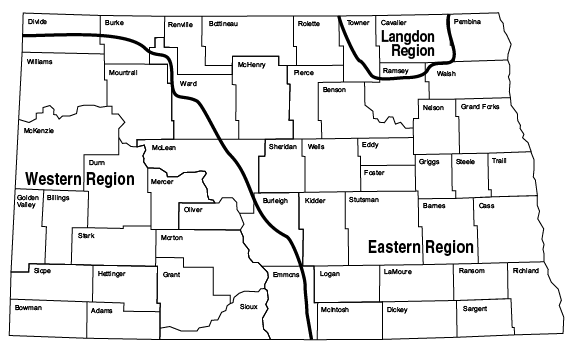
There are differences in the response of sunflower in eastern North Dakota compared to those in western North Dakota (Figure 2). In addition, the Langdon region is separated from the rest of eastern North Dakota due to the small shale pieces the soil in this region contains. These shale pieces are the source of mineralizable, plant-available ammonium, causing these soils to act as a natural slow-release N fertilizer. The N recommended in the Langdon Region is less than in the rest of the eastern region.
contain small pieces of shale that release N during the growing season, making the N rate recommendations for Langdon less than those in the rest of eastern North
Dakota.
In the state, long-term no-till sites, those sites with continuous no-till for at least six years, required less N to achieve maximum economic yield compared to sites under conventional tillage. Similar results have also been recorded in spring wheat/durum and in corn, whose recommendations also contain reduced N rates for long-term no-till management.
Some harvest loss is likely with lodging, so the upper values of N rate were reduced to limit lodging loss. Although white mold and downy mildew seemed to be related to N rate in experiment observation, only one site was rated for disease in each treatment. This site, north of Dickinson, North Dakota, was rated at harvest for sunflower rust, which is caused by the fungus Puccinia helianthi. The results of the rating are available in Table 1.
|
N rate, |
Sunflower rust |
|
0 |
0.65 a |
|
40 |
1.51 ab |
|
80 |
2.25 b |
|
120 |
1.53 ab |
|
160 |
1.25 ab |
|
200 |
1.63 ab |
* Ratings made on images obtained by retired agronomist Roger Ashley and rated by Samuel Markel, NDSU Extension plant pathologist.
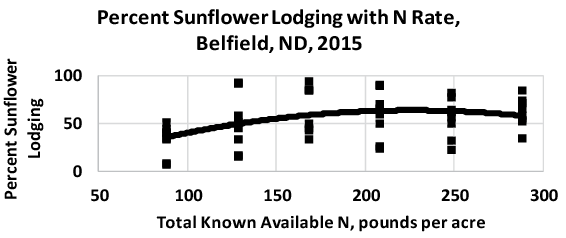
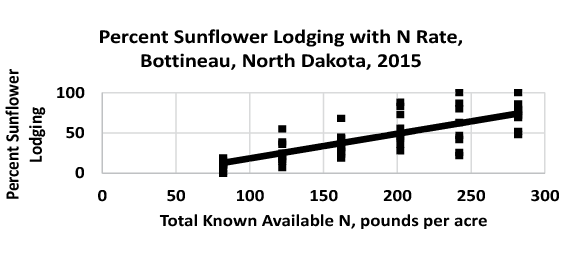
Excessive wind resulting in sunflower root lodging or stalk breakage does not happen in every sunflower field every year, but lodging is a concern of most sunflower growers. Several research sites were affected by wind each year, and lodging severity was directly related to N rate (Figure 3).
Although in the N rate experiments all heads were included in yield, sunflower growers would suffer a decrease in harvest efficiency when sunflowers are on or near the ground. Therefore, the N rate is capped, even though small increases in yield and marginal profit might be possible with greater N rates in nonwind-affected growing seasons.
Seed oil content of oil-seed sunflowers always decreased with N rate, regardless of yield response. The economic impact of available N on yield response, seed oil response and N cost is factored into each N recommendation. Highest N rates are moderated due to possible harvestable yield reduction due to lodging. The N rate recommendations are available in Tables 2-13.
|
Sunflower $ per pound |
N cost $ per pound |
||||||||
|
0.20 |
0.30 |
0.40 |
0.50 |
0.60 |
0.70 |
0.80 |
0.90 |
1.00 |
|
|
Total Known Available N Recommended, pounds per acre* |
|||||||||
|
* Total known available N includes soil test N to 2 feet, previous crop credit and fertilizer amendment N rate. |
|||||||||
|
0.09 |
160 |
107 |
43 |
0 |
0 |
0 |
0 |
0 |
0 |
|
0.12 |
160 |
155 |
107 |
59 |
11 |
0 |
0 |
0 |
0 |
|
0.15 |
160 |
160 |
145 |
107 |
69 |
30 |
0 |
0 |
0 |
|
0.18 |
160 |
160 |
160 |
139 |
107 |
75 |
43 |
11 |
0 |
|
0.21 |
160 |
160 |
160 |
160 |
134 |
107 |
79 |
52 |
25 |
|
0.24 |
160 |
160 |
160 |
160 |
155 |
131 |
107 |
83 |
59 |
|
0.27 |
160 |
160 |
160 |
160 |
160 |
149 |
128 |
107 |
86 |
|
0.30 |
160 |
160 |
160 |
160 |
160 |
160 |
145 |
126 |
107 |
|
0.33 |
160 |
160 |
160 |
160 |
160 |
160 |
160 |
142 |
139 |
|
0.36 |
160 |
160 |
160 |
160 |
160 |
160 |
160 |
155 |
151 |
|
0.39 |
160 |
160 |
160 |
160 |
160 |
160 |
160 |
160 |
160 |
|
0.42 |
160 |
160 |
160 |
160 |
160 |
160 |
160 |
160 |
160 |
|
0.45 |
160 |
160 |
160 |
160 |
160 |
160 |
160 |
160 |
160 |
|
0.48 |
160 |
160 |
160 |
160 |
160 |
160 |
160 |
160 |
160 |
|
0.51 |
160 |
160 |
160 |
160 |
160 |
160 |
160 |
160 |
160 |
|
0.55 |
160 |
160 |
160 |
160 |
160 |
160 |
160 |
160 |
160 |
|
0.60 |
160 |
160 |
160 |
160 |
160 |
160 |
160 |
160 |
160 |
|
Sunflower $ per pound |
N cost $ per pound |
|||||||||
|
1.10 |
1.20 |
1.30 |
1.40 |
1.50 |
1.60 |
1.70 |
1.80 |
1.90 |
2.00 |
|
|
Total Known Available N Recommended, pounds per acre* |
||||||||||
|
* Total known available N includes soil test N to 2 feet, previous crop credit and fertilizer amendment N rate. |
||||||||||
|
0.09 |
0 |
0 |
0 |
0 |
0 |
0 |
0 |
0 |
0 |
0 |
|
0.12 |
0 |
0 |
0 |
0 |
0 |
0 |
0 |
0 |
0 |
0 |
|
0.15 |
0 |
0 |
0 |
0 |
0 |
0 |
0 |
0 |
0 |
0 |
|
0.18 |
0 |
0 |
0 |
0 |
0 |
0 |
0 |
0 |
0 |
0 |
|
0.21 |
0 |
0 |
0 |
0 |
0 |
0 |
0 |
0 |
0 |
0 |
|
0.24 |
24 |
11 |
0 |
0 |
0 |
0 |
0 |
0 |
0 |
0 |
|
0.27 |
64 |
43 |
22 |
0 |
0 |
0 |
0 |
0 |
0 |
0 |
|
0.30 |
88 |
68 |
49 |
30 |
11 |
0 |
0 |
0 |
0 |
0 |
|
0.33 |
107 |
89 |
72 |
55 |
37 |
20 |
0 |
0 |
0 |
0 |
|
0.36 |
123 |
107 |
91 |
75 |
57 |
43 |
27 |
11 |
0 |
0 |
|
0.39 |
136 |
119 |
107 |
92 |
77 |
63 |
48 |
33 |
20 |
0 |
|
0.42 |
160 |
134 |
120 |
107 |
93 |
79 |
64 |
52 |
38 |
25 |
|
0.45 |
160 |
147 |
132 |
120 |
107 |
94 |
81 |
68 |
56 |
43 |
|
0.48 |
160 |
160 |
143 |
131 |
119 |
107 |
96 |
83 |
71 |
59 |
|
0.51 |
160 |
160 |
152 |
141 |
129 |
118 |
107 |
96 |
84 |
73 |
|
0.55 |
160 |
160 |
160 |
152 |
142 |
131 |
121 |
110 |
100 |
89 |
|
0.60 |
160 |
160 |
160 |
160 |
155 |
144 |
136 |
126 |
116 |
107 |
|
Sunflower $ per pound |
N cost $ per pound |
||||||||
|
0.20 |
0.30 |
0.40 |
0.50 |
0.60 |
0.70 |
0.80 |
0.90 |
1.00 |
|
|
Total Known Available N Recommended, pounds per acre* |
|||||||||
|
* Total known available N includes soil test N to 2 feet, previous crop credit and fertilizer amendment N rate. |
|||||||||
|
0.09 |
150 |
135 |
124 |
111 |
96 |
84 |
72 |
59 |
47 |
|
0.12 |
150 |
145 |
135 |
125 |
116 |
106 |
96 |
87 |
78 |
|
0.15 |
150 |
150 |
143 |
135 |
127 |
119 |
112 |
104 |
96 |
|
0.18 |
150 |
150 |
148 |
141 |
135 |
128 |
126 |
115 |
109 |
|
0.21 |
150 |
150 |
150 |
146 |
141 |
135 |
129 |
124 |
118 |
|
0.24 |
150 |
150 |
150 |
150 |
145 |
140 |
130 |
130 |
125 |
|
0.27 |
150 |
150 |
150 |
150 |
148 |
144 |
135 |
135 |
131 |
|
0.30 |
150 |
150 |
150 |
150 |
150 |
147 |
139 |
139 |
135 |
|
0.33 |
150 |
150 |
150 |
150 |
150 |
150 |
150 |
150 |
138 |
|
0.36 |
150 |
150 |
150 |
150 |
150 |
150 |
150 |
150 |
142 |
|
0.39 |
150 |
150 |
150 |
150 |
150 |
150 |
150 |
150 |
144 |
|
0.42 |
150 |
150 |
150 |
150 |
150 |
150 |
150 |
150 |
146 |
|
0.45 |
150 |
150 |
150 |
150 |
150 |
150 |
150 |
150 |
148 |
|
0.48 |
150 |
150 |
150 |
150 |
150 |
150 |
150 |
150 |
150 |
|
0.51 |
150 |
150 |
150 |
150 |
150 |
150 |
150 |
150 |
150 |
|
0.55 |
150 |
150 |
150 |
150 |
150 |
150 |
150 |
150 |
150 |
|
0.60 |
150 |
150 |
150 |
150 |
150 |
150 |
150 |
150 |
150 |
|
Sunflower $ per pound |
N cost $ per pound |
|||||||||
|
1.10 |
1.20 |
1.30 |
1.40 |
1.50 |
1.60 |
1.70 |
1.80 |
1.90 |
2.00 |
|
|
Total Known Available N Recommended, pounds per acre* |
||||||||||
|
* Total known available N includes soil test N to 2 feet, previous crop credit and fertilizer amendment N rate. |
||||||||||
|
0.09 |
35 |
23 |
12 |
0 |
0 |
0 |
0 |
0 |
0 |
0 |
|
0.12 |
68 |
59 |
50 |
41 |
32 |
23 |
14 |
0 |
0 |
0 |
|
0.15 |
89 |
81 |
74 |
67 |
59 |
52 |
45 |
38 |
30 |
23 |
|
0.18 |
103 |
96 |
90 |
84 |
78 |
72 |
65 |
59 |
53 |
47 |
|
0.21 |
113 |
107 |
102 |
96 |
91 |
86 |
80 |
75 |
70 |
65 |
|
0.24 |
120 |
115 |
111 |
106 |
101 |
95 |
91 |
87 |
83 |
78 |
|
0.27 |
126 |
122 |
118 |
113 |
109 |
105 |
102 |
96 |
92 |
88 |
|
0.30 |
131 |
127 |
123 |
119 |
115 |
112 |
108 |
104 |
100 |
96 |
|
0.33 |
135 |
131 |
128 |
124 |
121 |
117 |
116 |
110 |
107 |
103 |
|
0.36 |
138 |
135 |
132 |
128 |
125 |
122 |
119 |
115 |
112 |
109 |
|
0.39 |
141 |
138 |
135 |
132 |
129 |
126 |
123 |
120 |
117 |
114 |
|
0.42 |
143 |
141 |
138 |
135 |
132 |
129 |
127 |
124 |
121 |
118 |
|
0.45 |
145 |
143 |
140 |
138 |
135 |
132 |
130 |
127 |
124 |
122 |
|
0.48 |
147 |
145 |
142 |
140 |
137 |
135 |
132 |
130 |
128 |
125 |
|
0.51 |
150 |
147 |
144 |
142 |
140 |
137 |
135 |
133 |
130 |
128 |
|
0.55 |
150 |
150 |
146 |
144 |
142 |
140 |
138 |
136 |
134 |
131 |
|
0.60 |
150 |
150 |
148 |
146 |
144 |
142 |
141 |
139 |
137 |
135 |
|
Sunflower $ per pound |
N cost $ per pound |
||||||||
|
0.20 |
0.30 |
0.40 |
0.50 |
0.60 |
0.70 |
0.80 |
0.90 |
1.00 |
|
|
Total Known Available N Recommended, pounds per acre* |
|||||||||
|
* Total known available N includes soil test N to 2 feet, previous crop credit and fertilizer amendment N rate. |
|||||||||
|
0.09 |
34 |
0 |
0 |
0 |
0 |
0 |
0 |
0 |
0 |
|
0.12 |
67 |
18 |
0 |
0 |
0 |
0 |
0 |
0 |
0 |
|
0.15 |
89 |
47 |
11 |
0 |
0 |
0 |
0 |
0 |
0 |
|
0.18 |
100 |
67 |
36 |
0 |
0 |
0 |
0 |
0 |
0 |
|
0.21 |
100 |
82 |
55 |
27 |
0 |
0 |
0 |
0 |
0 |
|
0.24 |
100 |
92 |
69 |
45 |
21 |
0 |
0 |
0 |
0 |
|
0.27 |
100 |
100 |
80 |
58 |
37 |
15 |
0 |
0 |
0 |
|
0.30 |
100 |
100 |
89 |
68 |
49 |
30 |
11 |
0 |
0 |
|
0.33 |
100 |
100 |
95 |
76 |
60 |
40 |
23 |
0 |
0 |
|
0.36 |
100 |
100 |
100 |
84 |
67 |
51 |
35 |
19 |
0 |
|
0.39 |
100 |
100 |
100 |
90 |
75 |
60 |
44 |
30 |
15 |
|
0.42 |
100 |
100 |
100 |
96 |
81 |
67 |
53 |
39 |
25 |
|
0.45 |
100 |
100 |
100 |
100 |
87 |
74 |
61 |
47 |
35 |
|
0.48 |
100 |
100 |
100 |
100 |
92 |
80 |
67 |
55 |
43 |
|
0.51 |
100 |
100 |
100 |
100 |
97 |
85 |
73 |
61 |
50 |
|
0.55 |
100 |
100 |
100 |
100 |
100 |
91 |
80 |
69 |
58 |
|
0.60 |
100 |
100 |
100 |
100 |
100 |
97 |
87 |
77 |
67 |
|
Sunflower $ per pound |
N cost $ per pound |
|||||||||
|
1.10 |
1.20 |
1.30 |
1.40 |
1.50 |
1.60 |
1.70 |
1.80 |
1.90 |
2.00 |
|
|
Total Known Available N Recommended, pounds per acre* |
||||||||||
|
* Total known available N includes soil test N to 2 feet, previous crop credit and fertilizer amendment N rate. |
||||||||||
|
0.09 |
0 |
0 |
0 |
0 |
0 |
0 |
0 |
0 |
0 |
0 |
|
0.12 |
0 |
0 |
0 |
0 |
0 |
0 |
0 |
0 |
0 |
0 |
|
0.15 |
0 |
0 |
0 |
0 |
0 |
0 |
0 |
0 |
0 |
0 |
|
0.18 |
0 |
0 |
0 |
0 |
0 |
0 |
0 |
0 |
0 |
0 |
|
0.21 |
0 |
0 |
0 |
0 |
0 |
0 |
0 |
0 |
0 |
0 |
|
0.24 |
0 |
0 |
0 |
0 |
0 |
0 |
0 |
0 |
0 |
0 |
|
0.27 |
0 |
0 |
0 |
0 |
0 |
0 |
0 |
0 |
0 |
0 |
|
0.30 |
0 |
0 |
0 |
0 |
0 |
0 |
0 |
0 |
0 |
0 |
|
0.33 |
0 |
0 |
0 |
0 |
0 |
0 |
0 |
0 |
0 |
0 |
|
0.36 |
0 |
0 |
0 |
0 |
0 |
0 |
0 |
0 |
0 |
0 |
|
0.39 |
0 |
0 |
0 |
0 |
0 |
0 |
0 |
0 |
0 |
0 |
|
0.42 |
12 |
12 |
0 |
0 |
0 |
0 |
0 |
0 |
0 |
0 |
|
0.45 |
22 |
22 |
0 |
0 |
0 |
0 |
0 |
0 |
0 |
0 |
|
0.48 |
30 |
30 |
0 |
0 |
0 |
0 |
0 |
0 |
0 |
0 |
|
0.51 |
38 |
38 |
16 |
0 |
0 |
0 |
0 |
0 |
0 |
0 |
|
0.55 |
47 |
47 |
26 |
16 |
0 |
0 |
0 |
0 |
0 |
0 |
|
0.60 |
57 |
57 |
38 |
28 |
18 |
10 |
0 |
0 |
0 |
0 |
|
Sunflower $ per pound |
N cost $ per pound |
||||||||
|
0.20 |
0.30 |
0.40 |
0.50 |
0.60 |
0.70 |
0.80 |
0.90 |
1.00 |
|
|
Total Known Available N Recommended, pounds per acre* |
|||||||||
|
* Total known available N includes soil test N to 2 feet, previous crop credit and fertilizer amendment N rate. |
|||||||||
|
0.09 |
44 |
0 |
0 |
0 |
0 |
0 |
0 |
0 |
0 |
|
0.12 |
77 |
28 |
0 |
0 |
0 |
0 |
0 |
0 |
0 |
|
0.15 |
99 |
57 |
21 |
0 |
0 |
0 |
0 |
0 |
0 |
|
0.18 |
110 |
77 |
46 |
10 |
0 |
0 |
0 |
0 |
0 |
|
0.21 |
110 |
92 |
65 |
37 |
10 |
0 |
0 |
0 |
0 |
|
0.24 |
110 |
102 |
79 |
55 |
31 |
0 |
0 |
0 |
0 |
|
0.27 |
110 |
110 |
90 |
68 |
47 |
25 |
0 |
0 |
0 |
|
0.30 |
110 |
110 |
99 |
78 |
59 |
40 |
21 |
0 |
0 |
|
0.33 |
110 |
110 |
105 |
86 |
70 |
50 |
33 |
10 |
0 |
|
0.36 |
110 |
110 |
110 |
94 |
77 |
61 |
45 |
29 |
0 |
|
0.39 |
110 |
110 |
110 |
100 |
85 |
70 |
54 |
40 |
25 |
|
0.42 |
110 |
110 |
110 |
106 |
91 |
77 |
63 |
49 |
35 |
|
0.45 |
110 |
110 |
110 |
110 |
97 |
84 |
71 |
57 |
45 |
|
0.48 |
110 |
110 |
110 |
110 |
102 |
90 |
77 |
65 |
53 |
|
0.51 |
110 |
110 |
110 |
110 |
107 |
95 |
83 |
71 |
60 |
|
0.55 |
110 |
110 |
110 |
110 |
110 |
101 |
90 |
79 |
68 |
|
0.60 |
110 |
110 |
110 |
110 |
110 |
107 |
97 |
87 |
77 |
|
Sunflower $ per pound |
N cost $ per pound |
|||||||||
|
1.10 |
1.20 |
1.30 |
1.40 |
1.50 |
1.60 |
1.70 |
1.80 |
1.90 |
2.00 |
|
|
Total Known Available N Recommended, pounds per acre* |
||||||||||
|
* Total known available N includes soil test N to 2 feet, previous crop credit and fertilizer amendment N rate. |
||||||||||
|
0.09 |
0 |
0 |
0 |
0 |
0 |
0 |
0 |
0 |
0 |
0 |
|
0.12 |
0 |
0 |
0 |
0 |
0 |
0 |
0 |
0 |
0 |
0 |
|
0.15 |
0 |
0 |
0 |
0 |
0 |
0 |
0 |
0 |
0 |
0 |
|
0.18 |
0 |
0 |
0 |
0 |
0 |
0 |
0 |
0 |
0 |
0 |
|
0.21 |
0 |
0 |
0 |
0 |
0 |
0 |
0 |
0 |
0 |
0 |
|
0.24 |
0 |
0 |
0 |
0 |
0 |
0 |
0 |
0 |
0 |
0 |
|
0.27 |
0 |
0 |
0 |
0 |
0 |
0 |
0 |
0 |
0 |
0 |
|
0.30 |
0 |
0 |
0 |
0 |
0 |
0 |
0 |
0 |
0 |
0 |
|
0.33 |
0 |
0 |
0 |
0 |
0 |
0 |
0 |
0 |
0 |
0 |
|
0.36 |
0 |
0 |
0 |
0 |
0 |
0 |
0 |
0 |
0 |
0 |
|
0.39 |
0 |
0 |
0 |
0 |
0 |
0 |
0 |
0 |
0 |
0 |
|
0.42 |
22 |
22 |
0 |
0 |
0 |
0 |
0 |
0 |
0 |
0 |
|
0.45 |
32 |
32 |
0 |
0 |
0 |
0 |
0 |
0 |
0 |
0 |
|
0.48 |
40 |
40 |
10 |
0 |
0 |
0 |
0 |
0 |
0 |
0 |
|
0.51 |
48 |
48 |
26 |
10 |
0 |
0 |
0 |
0 |
0 |
0 |
|
0.55 |
57 |
57 |
36 |
26 |
10 |
0 |
0 |
0 |
0 |
0 |
|
0.60 |
67 |
57 |
48 |
38 |
28 |
20 |
0 |
0 |
0 |
0 |
|
Sunflower $ per pound |
N cost $ per pound |
||||||||
|
0.20 |
0.30 |
0.40 |
0.50 |
0.60 |
0.70 |
0.80 |
0.90 |
1.00 |
|
|
Total Known Available N Recommended, pounds per acre* |
|||||||||
|
* Total known available N includes soil test N to 2 feet, previous crop credit and fertilizer amendment N rate. |
|||||||||
|
0.09 |
120 |
67 |
10 |
0 |
0 |
0 |
0 |
0 |
0 |
|
0.12 |
120 |
115 |
67 |
19 |
0 |
0 |
0 |
0 |
0 |
|
0.15 |
120 |
120 |
105 |
67 |
29 |
0 |
0 |
0 |
0 |
|
0.18 |
120 |
120 |
120 |
99 |
67 |
35 |
0 |
0 |
0 |
|
0.21 |
120 |
120 |
120 |
120 |
94 |
67 |
39 |
12 |
0 |
|
0.24 |
120 |
120 |
120 |
120 |
115 |
91 |
67 |
43 |
19 |
|
0.27 |
120 |
120 |
120 |
120 |
120 |
109 |
88 |
67 |
46 |
|
0.30 |
120 |
120 |
120 |
120 |
120 |
120 |
105 |
86 |
67 |
|
0.33 |
120 |
120 |
120 |
120 |
120 |
120 |
120 |
102 |
99 |
|
0.36 |
120 |
120 |
120 |
120 |
120 |
120 |
120 |
115 |
111 |
|
0.39 |
120 |
120 |
120 |
120 |
120 |
120 |
120 |
120 |
120 |
|
0.42 |
120 |
120 |
120 |
120 |
120 |
120 |
120 |
120 |
120 |
|
0.45 |
120 |
120 |
120 |
120 |
120 |
120 |
120 |
120 |
120 |
|
0.48 |
120 |
120 |
120 |
120 |
120 |
120 |
120 |
120 |
120 |
|
0.51 |
120 |
120 |
120 |
120 |
120 |
120 |
120 |
120 |
120 |
|
0.55 |
120 |
120 |
120 |
120 |
120 |
120 |
120 |
120 |
120 |
|
0.60 |
120 |
120 |
120 |
120 |
120 |
120 |
120 |
120 |
120 |
|
Sunflower $ per pound |
N cost $ per pound |
|||||||||
|
1.10 |
1.20 |
1.30 |
1.40 |
1.50 |
1.60 |
1.70 |
1.80 |
1.90 |
2.00 |
|
|
Total Known Available N Recommended, pounds per acre* |
||||||||||
|
* Total known available N includes soil test N to 2 feet, previous crop credit and fertilizer amendment N rate. |
||||||||||
|
0.09 |
0 |
0 |
0 |
0 |
0 |
0 |
0 |
0 |
0 |
0 |
|
0.12 |
0 |
0 |
0 |
0 |
0 |
0 |
0 |
0 |
0 |
0 |
|
0.15 |
0 |
0 |
0 |
0 |
0 |
0 |
0 |
0 |
0 |
0 |
|
0.18 |
0 |
0 |
0 |
0 |
0 |
0 |
0 |
0 |
0 |
0 |
|
0.21 |
0 |
0 |
0 |
0 |
0 |
0 |
0 |
0 |
0 |
0 |
|
0.24 |
0 |
0 |
0 |
0 |
0 |
0 |
0 |
0 |
0 |
0 |
|
0.27 |
24 |
0 |
0 |
0 |
0 |
0 |
0 |
0 |
0 |
0 |
|
0.30 |
48 |
28 |
0 |
0 |
0 |
0 |
0 |
0 |
0 |
0 |
|
0.33 |
67 |
49 |
10 |
15 |
0 |
0 |
0 |
0 |
0 |
0 |
|
0.36 |
83 |
67 |
32 |
35 |
17 |
0 |
0 |
0 |
0 |
0 |
|
0.39 |
96 |
94 |
51 |
52 |
37 |
10 |
10 |
0 |
0 |
0 |
|
0.42 |
108 |
107 |
67 |
67 |
53 |
24 |
24 |
12 |
0 |
0 |
|
0.45 |
120 |
120 |
80 |
80 |
67 |
41 |
41 |
28 |
16 |
0 |
|
0.48 |
120 |
120 |
92 |
91 |
79 |
56 |
56 |
43 |
31 |
19 |
|
0.51 |
120 |
120 |
112 |
101 |
89 |
67 |
67 |
56 |
44 |
33 |
|
0.55 |
120 |
120 |
120 |
112 |
102 |
91 |
81 |
70 |
60 |
49 |
|
0.60 |
120 |
120 |
120 |
120 |
115 |
104 |
96 |
86 |
76 |
67 |
|
Sunflower $ per pound |
N cost $ per pound |
||||||||
|
0.20 |
0.30 |
0.40 |
0.50 |
0.60 |
0.70 |
0.80 |
0.90 |
1.00 |
|
|
Total Known Available N Recommended, pounds per acre* |
|||||||||
|
* Total known available N includes soil test N to 2 feet, previous crop credit and fertilizer amendment N rate. |
|||||||||
|
0.09 |
110 |
57 |
0 |
0 |
0 |
0 |
0 |
0 |
0 |
|
0.12 |
110 |
115 |
57 |
10 |
0 |
0 |
0 |
0 |
0 |
|
0.15 |
110 |
110 |
105 |
57 |
19 |
0 |
0 |
0 |
0 |
|
0.18 |
110 |
110 |
110 |
89 |
57 |
25 |
0 |
0 |
0 |
|
0.21 |
110 |
110 |
110 |
110 |
84 |
57 |
29 |
0 |
0 |
|
0.24 |
110 |
110 |
110 |
110 |
105 |
81 |
57 |
33 |
10 |
|
0.27 |
110 |
110 |
110 |
110 |
110 |
99 |
78 |
57 |
36 |
|
0.30 |
110 |
110 |
110 |
110 |
110 |
110 |
95 |
76 |
57 |
|
0.33 |
110 |
110 |
110 |
110 |
110 |
110 |
110 |
92 |
89 |
|
0.36 |
110 |
110 |
110 |
110 |
110 |
110 |
110 |
115 |
91 |
|
0.39 |
110 |
110 |
110 |
110 |
110 |
110 |
110 |
110 |
110 |
|
0.42 |
110 |
110 |
110 |
110 |
110 |
110 |
110 |
110 |
110 |
|
0.45 |
110 |
110 |
110 |
110 |
110 |
110 |
110 |
110 |
110 |
|
0.48 |
110 |
110 |
110 |
110 |
110 |
110 |
110 |
110 |
110 |
|
0.51 |
110 |
110 |
110 |
110 |
110 |
110 |
110 |
110 |
110 |
|
0.55 |
110 |
110 |
110 |
110 |
110 |
110 |
110 |
110 |
110 |
|
0.60 |
110 |
110 |
110 |
110 |
110 |
110 |
110 |
110 |
110 |
|
Sunflower $ per pound |
N cost $ per pound |
|||||||||
|
1.10 |
1.20 |
1.30 |
1.40 |
1.50 |
1.60 |
1.70 |
1.80 |
1.90 |
2.00 |
|
|
Total Known Available N Recommended, pounds per acre* |
||||||||||
|
* Total known available N includes soil test N to 2 feet, previous crop credit and fertilizer amendment N rate. |
||||||||||
|
0.09 |
0 |
0 |
0 |
0 |
0 |
0 |
0 |
0 |
0 |
0 |
|
0.12 |
0 |
0 |
0 |
0 |
0 |
0 |
0 |
0 |
0 |
0 |
|
0.15 |
0 |
0 |
0 |
0 |
0 |
0 |
0 |
0 |
0 |
0 |
|
0.18 |
0 |
0 |
0 |
0 |
0 |
0 |
0 |
0 |
0 |
0 |
|
0.21 |
0 |
0 |
0 |
0 |
0 |
0 |
0 |
0 |
0 |
0 |
|
0.24 |
0 |
0 |
0 |
0 |
0 |
0 |
0 |
0 |
0 |
0 |
|
0.27 |
14 |
0 |
0 |
0 |
0 |
0 |
0 |
0 |
0 |
0 |
|
0.30 |
38 |
18 |
0 |
0 |
0 |
0 |
0 |
0 |
0 |
0 |
|
0.33 |
57 |
39 |
0 |
0 |
0 |
0 |
0 |
0 |
0 |
0 |
|
0.36 |
73 |
57 |
32 |
25 |
10 |
0 |
0 |
0 |
0 |
0 |
|
0.39 |
86 |
84 |
41 |
32 |
27 |
0 |
0 |
0 |
0 |
0 |
|
0.42 |
98 |
97 |
57 |
57 |
43 |
14 |
14 |
0 |
0 |
0 |
|
0.45 |
110 |
110 |
70 |
70 |
57 |
31 |
31 |
18 |
10 |
0 |
|
0.48 |
110 |
110 |
82 |
81 |
69 |
46 |
46 |
33 |
21 |
10 |
|
0.51 |
110 |
110 |
92 |
91 |
79 |
57 |
57 |
46 |
34 |
23 |
|
0.55 |
110 |
110 |
110 |
102 |
92 |
81 |
71 |
60 |
50 |
39 |
|
0.60 |
110 |
110 |
110 |
110 |
115 |
94 |
86 |
76 |
66 |
57 |
|
Sunflower $ per pound |
N cost $ per pound |
||||||||
|
0.20 |
0.30 |
0.40 |
0.50 |
0.60 |
0.70 |
0.80 |
0.90 |
1.00 |
|
|
Total Known Available N Recommended, pounds per acre* |
|||||||||
|
* Total known available N includes soil test N to 2 feet, previous crop credit and fertilizer amendment N rate. |
|||||||||
|
0.09 |
10 |
0 |
0 |
0 |
0 |
0 |
0 |
0 |
0 |
|
0.12 |
47 |
0 |
0 |
0 |
0 |
0 |
0 |
0 |
0 |
|
0.15 |
69 |
27 |
0 |
0 |
0 |
0 |
0 |
0 |
0 |
|
0.18 |
80 |
47 |
16 |
0 |
0 |
0 |
0 |
0 |
0 |
|
0.21 |
80 |
62 |
35 |
10 |
0 |
0 |
0 |
0 |
0 |
|
0.24 |
80 |
72 |
49 |
25 |
0 |
0 |
0 |
0 |
0 |
|
0.27 |
80 |
80 |
60 |
38 |
17 |
0 |
0 |
0 |
0 |
|
0.30 |
80 |
80 |
69 |
48 |
29 |
10 |
0 |
0 |
0 |
|
0.33 |
80 |
80 |
75 |
56 |
40 |
20 |
10 |
0 |
0 |
|
0.36 |
80 |
80 |
80 |
64 |
47 |
31 |
15 |
0 |
0 |
|
0.39 |
80 |
80 |
80 |
70 |
55 |
40 |
24 |
10 |
0 |
|
0.42 |
80 |
80 |
80 |
76 |
61 |
47 |
33 |
19 |
10 |
|
0.45 |
80 |
80 |
80 |
80 |
67 |
54 |
41 |
27 |
15 |
|
0.48 |
80 |
80 |
80 |
80 |
72 |
60 |
47 |
35 |
23 |
|
0.51 |
80 |
80 |
80 |
80 |
77 |
65 |
53 |
41 |
30 |
|
0.55 |
80 |
80 |
80 |
80 |
80 |
71 |
60 |
49 |
38 |
|
0.60 |
80 |
80 |
80 |
80 |
80 |
77 |
67 |
57 |
47 |
|
Sunflower $ per pound |
N cost $ per pound |
|||||||||
|
1.10 |
1.20 |
1.30 |
1.40 |
1.50 |
1.60 |
1.70 |
1.80 |
1.90 |
2.00 |
|
|
Total Known Available N Recommended, pounds per acre* |
||||||||||
|
* Total known available N includes soil test N to 2 feet, previous crop credit and fertilizer amendment N rate. |
||||||||||
|
0.09 |
0 |
0 |
0 |
0 |
0 |
0 |
0 |
0 |
0 |
0 |
|
0.12 |
0 |
0 |
0 |
0 |
0 |
0 |
0 |
0 |
0 |
0 |
|
0.15 |
0 |
0 |
0 |
0 |
0 |
0 |
0 |
0 |
0 |
0 |
|
0.18 |
0 |
0 |
0 |
0 |
0 |
0 |
0 |
0 |
0 |
0 |
|
0.21 |
0 |
0 |
0 |
0 |
0 |
0 |
0 |
0 |
0 |
0 |
|
0.24 |
0 |
0 |
0 |
0 |
0 |
0 |
0 |
0 |
0 |
0 |
|
0.27 |
0 |
0 |
0 |
0 |
0 |
0 |
0 |
0 |
0 |
0 |
|
0.30 |
0 |
0 |
0 |
0 |
0 |
0 |
0 |
0 |
0 |
0 |
|
0.33 |
0 |
0 |
0 |
0 |
0 |
0 |
0 |
0 |
0 |
0 |
|
0.36 |
0 |
0 |
0 |
0 |
0 |
0 |
0 |
0 |
0 |
0 |
|
0.39 |
0 |
0 |
0 |
0 |
0 |
0 |
0 |
0 |
0 |
0 |
|
0.42 |
0 |
0 |
0 |
0 |
0 |
0 |
0 |
0 |
0 |
0 |
|
0.45 |
10 |
10 |
0 |
0 |
0 |
0 |
0 |
0 |
0 |
0 |
|
0.48 |
10 |
10 |
0 |
0 |
0 |
0 |
0 |
0 |
0 |
0 |
|
0.51 |
18 |
18 |
0 |
0 |
0 |
0 |
0 |
0 |
0 |
0 |
|
0.55 |
27 |
27 |
16 |
0 |
0 |
0 |
0 |
0 |
0 |
0 |
|
0.60 |
37 |
27 |
18 |
18 |
0 |
0 |
0 |
0 |
0 |
0 |
|
Sunflower $ per pound |
N cost $ per pound |
||||||||
|
0.20 |
0.30 |
0.40 |
0.50 |
0.60 |
0.70 |
0.80 |
0.90 |
1.00 |
|
|
Total Known Available N Recommended, pounds per acre* |
|||||||||
|
* Total known available N includes soil test N to 2 feet, previous crop credit and fertilizer amendment N rate. |
|||||||||
|
0.09 |
0 |
0 |
0 |
0 |
0 |
0 |
0 |
0 |
0 |
|
0.12 |
17 |
0 |
0 |
0 |
0 |
0 |
0 |
0 |
0 |
|
0.15 |
59 |
17 |
0 |
0 |
0 |
0 |
0 |
0 |
0 |
|
0.18 |
70 |
37 |
10 |
0 |
0 |
0 |
0 |
0 |
0 |
|
0.21 |
70 |
52 |
25 |
0 |
0 |
0 |
0 |
0 |
0 |
|
0.24 |
70 |
62 |
39 |
15 |
0 |
0 |
0 |
0 |
0 |
|
0.27 |
70 |
70 |
50 |
28 |
10 |
0 |
0 |
0 |
0 |
|
0.30 |
70 |
70 |
59 |
38 |
19 |
0 |
0 |
0 |
0 |
|
0.33 |
70 |
70 |
65 |
46 |
20 |
10 |
0 |
0 |
0 |
|
0.36 |
70 |
70 |
70 |
54 |
37 |
21 |
10 |
0 |
0 |
|
0.39 |
70 |
70 |
70 |
70 |
45 |
30 |
14 |
0 |
0 |
|
0.42 |
70 |
70 |
70 |
70 |
51 |
37 |
23 |
10 |
0 |
|
0.45 |
70 |
70 |
70 |
70 |
57 |
44 |
31 |
17 |
10 |
|
0.48 |
70 |
70 |
70 |
70 |
62 |
50 |
37 |
25 |
15 |
|
0.51 |
70 |
70 |
70 |
70 |
67 |
55 |
43 |
31 |
20 |
|
0.55 |
70 |
70 |
70 |
70 |
70 |
61 |
50 |
39 |
28 |
|
0.60 |
70 |
70 |
70 |
70 |
70 |
67 |
57 |
27 |
37 |
|
Sunflower $ per pound |
N cost $ per pound |
|||||||||
|
1.10 |
1.20 |
1.30 |
1.40 |
1.50 |
1.60 |
1.70 |
1.80 |
1.90 |
2.00 |
|
|
Total Known Available N Recommended, pounds per acre* |
||||||||||
|
* Total known available N includes soil test N to 2 feet, previous crop credit and fertilizer amendment N rate. |
||||||||||
|
0.09 |
0 |
0 |
0 |
0 |
0 |
0 |
0 |
0 |
0 |
0 |
|
0.12 |
0 |
0 |
0 |
0 |
0 |
0 |
0 |
0 |
0 |
0 |
|
0.15 |
0 |
0 |
0 |
0 |
0 |
0 |
0 |
0 |
0 |
0 |
|
0.18 |
0 |
0 |
0 |
0 |
0 |
0 |
0 |
0 |
0 |
0 |
|
0.21 |
0 |
0 |
0 |
0 |
0 |
0 |
0 |
0 |
0 |
0 |
|
0.24 |
0 |
0 |
0 |
0 |
0 |
0 |
0 |
0 |
0 |
0 |
|
0.27 |
0 |
0 |
0 |
0 |
0 |
0 |
0 |
0 |
0 |
0 |
|
0.30 |
0 |
0 |
0 |
0 |
0 |
0 |
0 |
0 |
0 |
0 |
|
0.33 |
0 |
0 |
0 |
0 |
0 |
0 |
0 |
0 |
0 |
0 |
|
0.36 |
0 |
0 |
0 |
0 |
0 |
0 |
0 |
0 |
0 |
0 |
|
0.39 |
0 |
0 |
0 |
0 |
0 |
0 |
0 |
0 |
0 |
0 |
|
0.42 |
0 |
0 |
0 |
0 |
0 |
0 |
0 |
0 |
0 |
0 |
|
0.45 |
0 |
0 |
0 |
0 |
0 |
0 |
0 |
0 |
0 |
0 |
|
0.48 |
0 |
0 |
0 |
0 |
0 |
0 |
0 |
0 |
0 |
0 |
|
0.51 |
10 |
10 |
0 |
0 |
0 |
0 |
0 |
0 |
0 |
0 |
|
0.55 |
17 |
17 |
10 |
0 |
0 |
0 |
0 |
0 |
0 |
0 |
|
0.60 |
27 |
17 |
10 |
10 |
0 |
0 |
0 |
0 |
0 |
0 |
|
Sunflower $ per pound |
N cost $ per pound |
||||||||
|
0.20 |
0.30 |
0.40 |
0.50 |
0.60 |
0.70 |
0.80 |
0.90 |
1.00 |
|
|
Total Known Available N Recommended, pounds per acre* |
|||||||||
|
* Total known available N includes soil test N to 2 feet, previous crop credit and fertilizer amendment N rate. |
|||||||||
|
0.09 |
86 |
37 |
0 |
0 |
0 |
0 |
0 |
0 |
0 |
|
0.12 |
110 |
75 |
37 |
0 |
0 |
0 |
0 |
0 |
0 |
|
0.15 |
110 |
95 |
66 |
37 |
0 |
0 |
0 |
0 |
0 |
|
0.18 |
110 |
110 |
86 |
61 |
38 |
0 |
0 |
0 |
0 |
|
0.21 |
110 |
110 |
100 |
79 |
58 |
38 |
0 |
0 |
0 |
|
0.24 |
110 |
110 |
110 |
92 |
73 |
55 |
38 |
20 |
0 |
|
0.27 |
110 |
110 |
110 |
102 |
85 |
69 |
55 |
38 |
22 |
|
0.30 |
110 |
110 |
110 |
110 |
95 |
81 |
69 |
52 |
38 |
|
0.33 |
110 |
110 |
110 |
110 |
102 |
90 |
81 |
65 |
52 |
|
0.36 |
110 |
110 |
110 |
110 |
110 |
100 |
90 |
73 |
63 |
|
0.39 |
110 |
110 |
110 |
110 |
110 |
110 |
100 |
82 |
73 |
|
0.42 |
110 |
110 |
110 |
110 |
110 |
110 |
110 |
89 |
81 |
|
0.45 |
110 |
110 |
110 |
110 |
110 |
110 |
110 |
99 |
88 |
|
0.48 |
110 |
110 |
110 |
110 |
110 |
110 |
110 |
101 |
94 |
|
0.51 |
110 |
110 |
110 |
110 |
110 |
110 |
110 |
106 |
99 |
|
0.55 |
110 |
110 |
110 |
110 |
110 |
110 |
110 |
110 |
106 |
|
0.60 |
110 |
110 |
110 |
110 |
110 |
110 |
110 |
110 |
110 |
|
Sunflower $ per pound |
N cost $ per pound |
|||||||||
|
1.10 |
1.20 |
1.30 |
1.40 |
1.50 |
1.60 |
1.70 |
1.80 |
1.90 |
2.00 |
|
|
Total Known Available N Recommended, pounds per acre* |
||||||||||
|
* Total known available N includes soil test N to 2 feet, previous crop credit and fertilizer amendment N rate. |
||||||||||
|
0.09 |
0 |
0 |
0 |
0 |
0 |
0 |
0 |
0 |
0 |
0 |
|
0.12 |
0 |
0 |
0 |
0 |
0 |
0 |
0 |
0 |
0 |
0 |
|
0.15 |
0 |
0 |
0 |
0 |
0 |
0 |
0 |
0 |
0 |
0 |
|
0.18 |
0 |
0 |
0 |
0 |
0 |
0 |
0 |
0 |
0 |
0 |
|
0.21 |
0 |
0 |
0 |
0 |
0 |
0 |
0 |
0 |
0 |
0 |
|
0.24 |
0 |
0 |
0 |
0 |
0 |
0 |
0 |
0 |
0 |
0 |
|
0.27 |
0 |
0 |
0 |
0 |
0 |
0 |
0 |
0 |
0 |
0 |
|
0.30 |
26 |
0 |
0 |
0 |
0 |
0 |
0 |
0 |
0 |
0 |
|
0.33 |
39 |
27 |
0 |
0 |
0 |
0 |
0 |
0 |
0 |
0 |
|
0.36 |
51 |
39 |
28 |
0 |
0 |
0 |
0 |
0 |
0 |
0 |
|
0.39 |
61 |
50 |
39 |
29 |
0 |
0 |
0 |
0 |
0 |
0 |
|
0.42 |
70 |
60 |
50 |
39 |
39 |
29 |
0 |
0 |
0 |
0 |
|
0.45 |
78 |
68 |
58 |
49 |
49 |
39 |
11 |
0 |
0 |
0 |
|
0.48 |
85 |
75 |
66 |
57 |
57 |
48 |
23 |
12 |
0 |
0 |
|
0.51 |
90 |
82 |
73 |
65 |
65 |
56 |
31 |
21 |
13 |
0 |
|
0.55 |
95 |
89 |
81 |
73 |
73 |
65 |
40 |
32 |
24 |
17 |
|
0.60 |
105 |
97 |
90 |
83 |
83 |
75 |
51 |
44 |
37 |
29 |
|
Sunflower $ per pound |
N cost $ per pound |
||||||||
|
0.20 |
0.30 |
0.40 |
0.50 |
0.60 |
0.70 |
0.80 |
0.90 |
1.00 |
|
|
Total Known Available N Recommended, pounds per acre* |
|||||||||
|
* Total known available N includes soil test N to 2 feet, previous crop credit and fertilizer amendment N rate. |
|||||||||
|
0.09 |
76 |
27 |
0 |
0 |
0 |
0 |
0 |
0 |
0 |
|
0.12 |
100 |
65 |
27 |
0 |
0 |
0 |
0 |
0 |
0 |
|
0.15 |
100 |
85 |
56 |
27 |
0 |
0 |
0 |
0 |
0 |
|
0.18 |
100 |
100 |
76 |
51 |
28 |
0 |
0 |
0 |
0 |
|
0.21 |
100 |
100 |
100 |
69 |
48 |
28 |
0 |
0 |
0 |
|
0.24 |
100 |
100 |
100 |
82 |
63 |
45 |
28 |
10 |
0 |
|
0.27 |
100 |
100 |
100 |
92 |
75 |
59 |
45 |
28 |
12 |
|
0.30 |
100 |
100 |
100 |
100 |
85 |
71 |
59 |
42 |
28 |
|
0.33 |
100 |
100 |
100 |
100 |
102 |
80 |
71 |
55 |
42 |
|
0.36 |
100 |
100 |
100 |
100 |
100 |
100 |
80 |
63 |
53 |
|
0.39 |
100 |
100 |
100 |
100 |
100 |
100 |
100 |
72 |
63 |
|
0.42 |
100 |
100 |
100 |
100 |
100 |
100 |
100 |
79 |
71 |
|
0.45 |
100 |
100 |
100 |
100 |
100 |
100 |
100 |
89 |
78 |
|
0.48 |
100 |
100 |
100 |
100 |
100 |
100 |
100 |
91 |
84 |
|
0.51 |
100 |
100 |
100 |
100 |
100 |
100 |
100 |
96 |
89 |
|
0.55 |
100 |
100 |
100 |
100 |
100 |
100 |
100 |
100 |
96 |
|
0.60 |
100 |
100 |
100 |
100 |
100 |
100 |
100 |
100 |
100 |
|
Sunflower $ per pound |
N cost $ per pound |
|||||||||
|
1.10 |
1.20 |
1.30 |
1.40 |
1.50 |
1.60 |
1.70 |
1.80 |
1.90 |
2.00 |
|
|
Total Known Available N Recommended, pounds per acre* |
||||||||||
|
* Total known available N includes soil test N to 2 feet, previous crop credit and fertilizer amendment N rate. |
||||||||||
|
0.09 |
0 |
0 |
0 |
0 |
0 |
0 |
0 |
0 |
0 |
0 |
|
0.12 |
0 |
0 |
0 |
0 |
0 |
0 |
0 |
0 |
0 |
0 |
|
0.15 |
0 |
0 |
0 |
0 |
0 |
0 |
0 |
0 |
0 |
0 |
|
0.18 |
0 |
0 |
0 |
0 |
0 |
0 |
0 |
0 |
0 |
0 |
|
0.21 |
0 |
0 |
0 |
0 |
0 |
0 |
0 |
0 |
0 |
0 |
|
0.24 |
0 |
0 |
0 |
0 |
0 |
0 |
0 |
0 |
0 |
0 |
|
0.27 |
0 |
0 |
0 |
0 |
0 |
0 |
0 |
0 |
0 |
0 |
|
0.30 |
16 |
0 |
0 |
0 |
0 |
0 |
0 |
0 |
0 |
0 |
|
0.33 |
29 |
17 |
0 |
0 |
0 |
0 |
0 |
0 |
0 |
0 |
|
0.36 |
41 |
29 |
18 |
0 |
0 |
0 |
0 |
0 |
0 |
0 |
|
0.39 |
51 |
40 |
29 |
19 |
0 |
0 |
0 |
0 |
0 |
0 |
|
0.42 |
60 |
50 |
40 |
29 |
29 |
19 |
0 |
0 |
0 |
0 |
|
0.45 |
68 |
58 |
48 |
39 |
39 |
29 |
0 |
0 |
0 |
0 |
|
0.48 |
75 |
65 |
56 |
47 |
47 |
38 |
13 |
0 |
0 |
0 |
|
0.51 |
80 |
72 |
63 |
55 |
55 |
46 |
21 |
11 |
0 |
0 |
|
0.55 |
85 |
79 |
71 |
63 |
63 |
55 |
30 |
22 |
14 |
10 |
|
0.60 |
95 |
87 |
80 |
73 |
73 |
65 |
41 |
34 |
27 |
19 |
|
Sunflower $ per pound |
N cost $ per pound |
||||||||
|
0.20 |
0.30 |
0.40 |
0.50 |
0.60 |
0.70 |
0.80 |
0.90 |
1.00 |
|
|
Total Known Available N Recommended, pounds per acre* |
|||||||||
|
* Total known available N includes soil test N to 2 feet, previous crop credit and fertilizer amendment N rate. |
|||||||||
|
0.09 |
136 |
87 |
40 |
20 |
0 |
0 |
0 |
0 |
0 |
|
0.12 |
160 |
105 |
87 |
40 |
20 |
0 |
0 |
0 |
0 |
|
0.15 |
160 |
145 |
116 |
87 |
60 |
40 |
0 |
0 |
0 |
|
0.18 |
160 |
160 |
136 |
111 |
88 |
60 |
0 |
0 |
0 |
|
0.21 |
160 |
160 |
160 |
129 |
108 |
88 |
40 |
20 |
0 |
|
0.24 |
160 |
160 |
160 |
142 |
123 |
105 |
78 |
60 |
20 |
|
0.27 |
160 |
160 |
160 |
152 |
135 |
119 |
105 |
88 |
62 |
|
0.30 |
160 |
160 |
160 |
160 |
145 |
131 |
119 |
102 |
88 |
|
0.33 |
160 |
160 |
160 |
160 |
160 |
140 |
131 |
115 |
102 |
|
0.36 |
160 |
160 |
160 |
160 |
160 |
160 |
140 |
123 |
113 |
|
0.39 |
160 |
160 |
160 |
160 |
160 |
160 |
160 |
132 |
123 |
|
0.42 |
160 |
160 |
160 |
160 |
160 |
160 |
160 |
139 |
131 |
|
0.45 |
160 |
160 |
160 |
160 |
160 |
160 |
160 |
149 |
138 |
|
0.48 |
160 |
160 |
160 |
160 |
160 |
160 |
160 |
151 |
144 |
|
0.51 |
160 |
160 |
160 |
160 |
160 |
160 |
160 |
156 |
149 |
|
0.55 |
160 |
160 |
160 |
160 |
160 |
160 |
160 |
160 |
156 |
|
0.60 |
160 |
160 |
160 |
160 |
160 |
160 |
160 |
160 |
160 |
|
Sunflower $ per pound |
N cost $ per pound |
|||||||||
|
1.10 |
1.20 |
1.30 |
1.40 |
1.50 |
1.60 |
1.70 |
1.80 |
1.90 |
2.00 |
|
|
Total Known Available N Recommended, pounds per acre* |
||||||||||
|
* Total known available N includes soil test N to 2 feet, previous crop credit and fertilizer amendment N rate. |
||||||||||
|
0.09 |
0 |
0 |
0 |
0 |
0 |
0 |
0 |
0 |
0 |
0 |
|
0.12 |
0 |
0 |
0 |
0 |
0 |
0 |
0 |
0 |
0 |
0 |
|
0.15 |
0 |
0 |
0 |
0 |
0 |
0 |
0 |
0 |
0 |
0 |
|
0.18 |
0 |
0 |
0 |
0 |
0 |
0 |
0 |
0 |
0 |
0 |
|
0.21 |
0 |
0 |
0 |
0 |
0 |
0 |
0 |
0 |
0 |
0 |
|
0.24 |
0 |
0 |
0 |
0 |
0 |
0 |
0 |
0 |
0 |
0 |
|
0.27 |
20 |
0 |
0 |
0 |
0 |
0 |
0 |
0 |
0 |
0 |
|
0.30 |
66 |
20 |
0 |
0 |
0 |
0 |
0 |
0 |
0 |
0 |
|
0.33 |
89 |
77 |
20 |
0 |
0 |
0 |
0 |
0 |
0 |
0 |
|
0.36 |
101 |
89 |
58 |
20 |
0 |
0 |
0 |
0 |
0 |
0 |
|
0.39 |
111 |
100 |
89 |
79 |
20 |
0 |
0 |
0 |
0 |
0 |
|
0.42 |
120 |
110 |
100 |
89 |
59 |
20 |
0 |
0 |
0 |
0 |
|
0.45 |
128 |
118 |
108 |
99 |
89 |
69 |
20 |
0 |
0 |
0 |
|
0.48 |
135 |
125 |
116 |
107 |
97 |
88 |
53 |
20 |
0 |
0 |
|
0.51 |
140 |
132 |
123 |
115 |
105 |
96 |
81 |
41 |
20 |
0 |
|
0.55 |
145 |
139 |
131 |
123 |
113 |
105 |
90 |
72 |
54 |
30 |
|
0.60 |
155 |
147 |
140 |
133 |
123 |
115 |
101 |
94 |
87 |
79 |
|
Sunflower $ per pound |
N cost $ per pound |
||||||||
|
0.20 |
0.30 |
0.40 |
0.50 |
0.60 |
0.70 |
0.80 |
0.90 |
1.00 |
|
|
Total Known Available N Recommended, pounds per acre* |
|||||||||
|
* Total known available N includes soil test N to 2 feet, previous crop credit and fertilizer amendment N rate. |
|||||||||
|
0.09 |
136 |
77 |
30 |
10 |
0 |
0 |
0 |
0 |
0 |
|
0.12 |
150 |
95 |
77 |
30 |
10 |
0 |
0 |
0 |
0 |
|
0.15 |
150 |
135 |
106 |
87 |
50 |
30 |
0 |
0 |
0 |
|
0.18 |
150 |
150 |
126 |
101 |
78 |
50 |
0 |
0 |
0 |
|
0.21 |
150 |
150 |
150 |
119 |
98 |
78 |
30 |
10 |
0 |
|
0.24 |
150 |
150 |
150 |
132 |
113 |
95 |
68 |
50 |
10 |
|
0.27 |
150 |
150 |
150 |
142 |
115 |
109 |
95 |
78 |
52 |
|
0.30 |
150 |
150 |
150 |
150 |
135 |
121 |
109 |
92 |
78 |
|
0.33 |
150 |
150 |
150 |
150 |
150 |
130 |
121 |
105 |
92 |
|
0.36 |
150 |
150 |
150 |
150 |
150 |
150 |
130 |
113 |
103 |
|
0.39 |
150 |
150 |
150 |
150 |
150 |
150 |
140 |
122 |
113 |
|
0.42 |
150 |
150 |
150 |
150 |
150 |
150 |
150 |
129 |
121 |
|
0.45 |
150 |
150 |
150 |
150 |
150 |
150 |
150 |
139 |
128 |
|
0.48 |
150 |
150 |
150 |
150 |
150 |
150 |
150 |
141 |
134 |
|
0.51 |
150 |
150 |
150 |
150 |
150 |
150 |
150 |
146 |
139 |
|
0.55 |
150 |
150 |
150 |
150 |
150 |
150 |
150 |
150 |
146 |
|
0.60 |
150 |
150 |
150 |
150 |
150 |
150 |
150 |
150 |
150 |
|
Sunflower $ per pound |
N cost $ per pound |
|||||||||
|
1.10 |
1.20 |
1.30 |
1.40 |
1.50 |
1.60 |
1.70 |
1.80 |
1.90 |
2.00 |
|
|
Total Known Available N Recommended, pounds per acre* |
||||||||||
|
* Total known available N includes soil test N to 2 feet, previous crop credit and fertilizer amendment N rate. |
||||||||||
|
0.09 |
0 |
0 |
0 |
0 |
0 |
0 |
0 |
0 |
0 |
0 |
|
0.12 |
0 |
0 |
0 |
0 |
0 |
0 |
0 |
0 |
0 |
0 |
|
0.15 |
0 |
0 |
0 |
0 |
0 |
0 |
0 |
0 |
0 |
0 |
|
0.18 |
0 |
0 |
0 |
0 |
0 |
0 |
0 |
0 |
0 |
0 |
|
0.21 |
0 |
0 |
0 |
0 |
0 |
0 |
0 |
0 |
0 |
0 |
|
0.24 |
0 |
0 |
0 |
0 |
0 |
0 |
0 |
0 |
0 |
0 |
|
0.27 |
10 |
0 |
0 |
0 |
0 |
0 |
0 |
0 |
0 |
0 |
|
0.30 |
56 |
10 |
0 |
0 |
0 |
0 |
0 |
0 |
0 |
0 |
|
0.33 |
79 |
67 |
10 |
0 |
0 |
0 |
0 |
0 |
0 |
0 |
|
0.36 |
91 |
79 |
48 |
10 |
0 |
0 |
0 |
0 |
0 |
0 |
|
0.39 |
101 |
90 |
79 |
69 |
10 |
0 |
0 |
0 |
0 |
0 |
|
0.42 |
110 |
100 |
90 |
79 |
49 |
10 |
0 |
0 |
0 |
0 |
|
0.45 |
118 |
108 |
98 |
89 |
79 |
59 |
10 |
0 |
0 |
0 |
|
0.48 |
125 |
115 |
106 |
97 |
87 |
78 |
43 |
10 |
0 |
0 |
|
0.51 |
130 |
122 |
113 |
105 |
95 |
86 |
71 |
31 |
10 |
0 |
|
0.55 |
135 |
129 |
121 |
113 |
103 |
95 |
80 |
62 |
44 |
20 |
|
0.60 |
145 |
137 |
130 |
123 |
113 |
105 |
91 |
84 |
77 |
69 |
References
Blackman, B.B., M. Scascitelli, N.C. Kane, H.H. Luton, D.A. Rasmussen, R.A. Bye, D.L. Lentz and L.H. Rieseberg. 2011. Sunflower domestication alleles support single domestication center in eastern North America. Proc. Natl. Acad. Sci. USA 108:14360–14365.
Darby, H., E. Cummings, R. Madden and S. Monahan. 2013. 2012 Sunflower population and nitrogen rate trial. Univ. of Vermont Ext. Publ. Burlington, Vt.
Scheiner, J.D., F.H. Gutierrez-Boem and R.S. Lavado. 2002. Sunflower nitrogen requirement and 15N fertilizer recovery in Western Pampas, Argentina. Eur. J. Agron. 17:73–79.
The original publication was authored by W.C. Dahnke, C. Fanning and A. Cattanach, former NDSU researchers and Extension specialists, 1992.
The National Sunflower Association provided funding for the research that led to this revised publication.

NDSU Extension does not endorse commercial products or companies even though reference may be made to trade names, trademarks or service names.
For more information on this and other topics, see www.ag.ndsu.edu
NDSU encourages you to use and share this content, but please do so under the conditions of our Creative Commons license.
You may copy, distribute, transmit and adapt this work as long as you give full attribution, don’t use the work for commercial purposes and share your resulting work similarly. For more information, visit www.ag.ndsu.edu/agcomm/creative-commons.
North Dakota State University does not discriminate on the basis of age, color, disability, gender expression/identity, genetic information, marital status, national origin, public assistance status, race, religion, sex, sexual orientation, or status as a U.S. veteran. Direct inquiries to: Vice Provost for Faculty and Equity, 201 Old Main, (701) 231-7708 or Title IX/ADA Coordinator, 102 Old Main, (701) 231-6409.
County Commissions, NDSU and U.S. Department of Agriculture Cooperating.
This publication will be made available in alternative formats for people with disabilities upon request, (701) 231-7881.