Pinto Bean Response to Row Spacing and Plant Population in North Dakota
(A2060 May 2022)The publication contains a summary of NDSU field research investigating the impact of plant population and row spacing on pinto bean seed yield and other agronomic characteristics.
Results
Row Spacings
Examining row spacing as a single production factor for pinto bean, seed yield average across 11 trials (Carrington, 2011-13 and 2018-21; Minot, 2018-19; and Langdon, 2020-21) indicates an advantage of 20% (350 lb per acre) with intermediate (15- to 22-inch) rows compared to wide rows (Figure 1).
Figure 1. Pinto bean seed yield between row spacings, Carrington, 2011-13 and 2018-21; Minot, 2018-19; and Langdon, 2020-21 (11 site-years)1
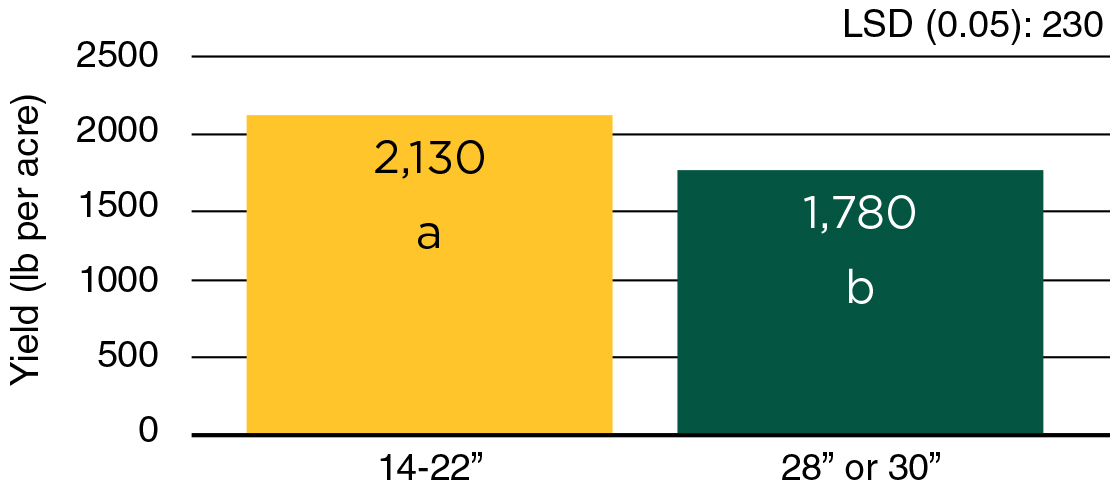
1 Means with no similar letters are significantly different.
Research trials conducted at Carrington (2019-21) and Langdon (2020-21) also included pinto bean grown in paired rows (separated by 6 or 7 inches and centered on 30 or 28 inches, respectively) (see picture below). Seed yield with paired rows, averaged among five site-years, was similar to intermediate rows and 20% greater than wide rows (Figure 2).
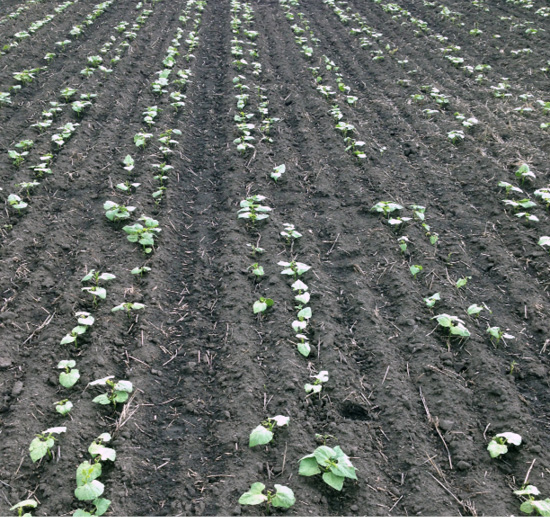
Figure 2. Pinto bean seed yield with paired rows, Carrington, 2019-21 and Langdon, 2020-21 (5 site-years)1
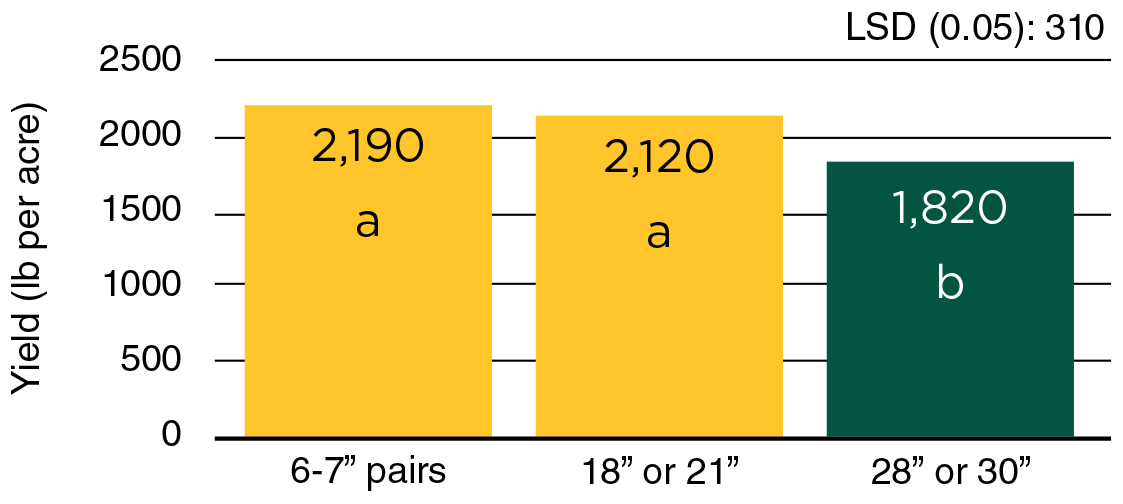
1 Means with no similar letters are significantly different.
Plant Populations
Analyzing pinto bean plant population as a single production factor, the impact of reduced plant population was measured across eight site-years of trials (Carrington, 2018-21; Minot, 2018-19; and Langdon, 2020-21). The average population of 51,200 plants per acre produced 1,600 lb per acre compared to the population of 68,500 plants per acre that produced 1,690 lb per acre (Figure 3). The greater plant density, which is similar to the standard recommendation of 70,000 plants per acre, had a yield advantage of 6%.
Figure 3. Pinto bean seed yield between reduced and standard plant populations, Carrington, 2018-21; Minot, 2018-21; and Langdon, 2020-21 (8 site-years)1
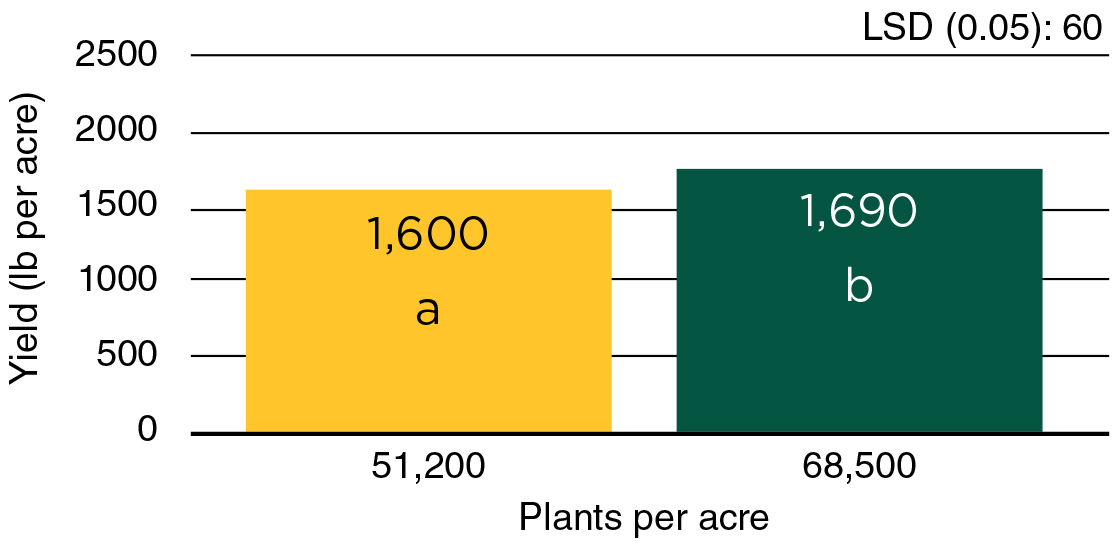
1 Means with no similar letters are significantly different.
Another database, averaged across three site-years of trials (Carrington, 2013 and 2018; and Langdon, 2021), indicates a pinto bean yield increase with greater than the standard plant population. Average plant density of 87,200 plants per acre produced 1,650 lb per acre compared to 1,570 lb per acre with 71,900 plants per acre (Figure 4). The increased plant density had a yield advantage of 5%.
Figure 4. Pinto bean seed yield between standard and increased plant populations, Carrington, 2013 and 2018; and Langdon, 2021 (3 site-years)1
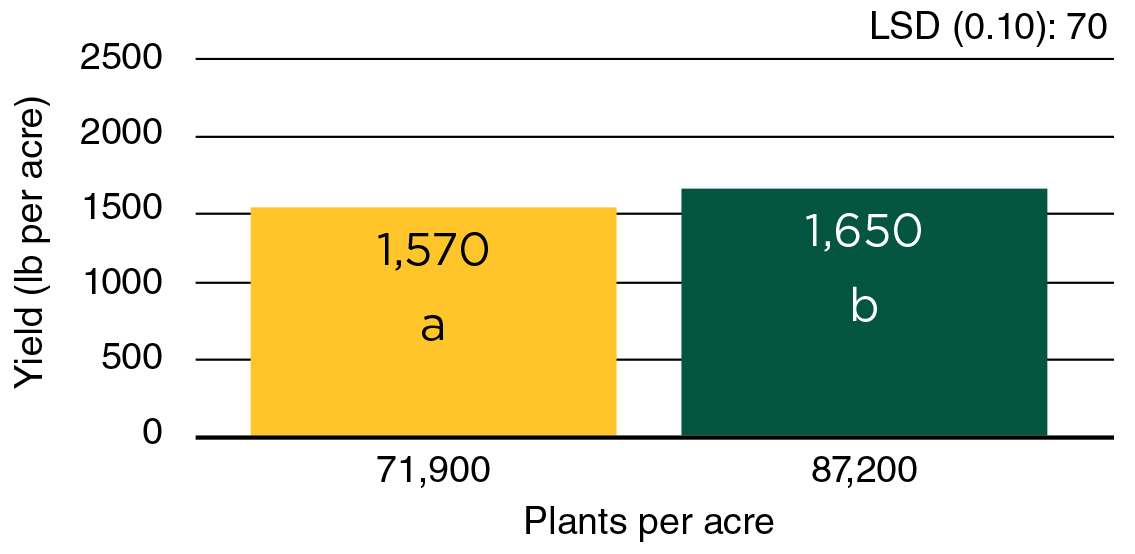
1 Means with no similar letters are significantly different.
References
Eckert, F.R., H.J. Kandel, B.L. Johnson, G.A. Rojas-Cifuentes, C. Deplazes, A.J. Vander Wal and J.M. Osorno. 2011. Seed yield and loss of dry bean cultivars under conventional and direct harvest. Agronomy Journal. https://doi.org/10.2134/agronj2010.0199.
Knodel, J.J., P.B. Beauzay, M. Ebert, G.J. Endres, D.W. Franzen, J.T. Ikley, H.J. Kandel, S.G. Markell and J.M. Osorno. 2022. 2021 Dry bean grower survey of production, pest problems and pesticide use in Minnesota and North Dakota. NDSU Extension publication E2052. www.ndsu.edu/agriculture/extension/publications/2021-dry-bean-grower-survey-production-pest-problems-and-pesticide-use
Northarvest Bean Growers Association provided financial support for this study.
The NDSU Extension does not endorse commercial products or companies even though reference may be made to tradenames, trademarks or service names. NDSU encourages you to use and share this content, but please do so under the conditions of our Creative Commons license. You may copy, distribute, transmit and adapt this work as long as you give full attribution, don’t use the work for commercial purposes and share your resulting work similarly. For more information, visit www.ag.ndsu.edu/agcomm/creative-commons.
For more information on this and other topics, see ndsu.edu/agriculture/ag-hub