2026 North Dakota Livestock Research Report
(AS2304, September 2026)The report will have several short research reports from researchers conducting research on livestock and associated topics in North Dakota. The target audience is people associated with the livestock industries ND and elsewhere.
Performance Testing
AS2304-1 • Moderate prebreeding body condition improves reproductive efficiency and productivity in fall- and spring-lambing commercial Rambouillet ewes.
Samantha L. Ekstrom1,2, Carlos D. Ruiz-Vázquez1,2, Nikita So2, Jetzairy Irizarry-Soto2, Sherly García Rivera2, Christopher S. Schauer2 and Rachel L. Gibbs2
1Department of Animal Science, NDSU ²Hettinger Research Extension Center, NDSU
A moderate prebreeding BCS of approximately 3.0 maximized reproductive efficiency and lamb production in commercial Rambouillet ewes. While prebreeding condition influenced flock-level productivity through improved conception and prolificacy, it had limited effects on late-gestation metabolism, lamb growth, or survival. Strategic management of ewe body condition before breeding provides a practical approach to improving flock efficiency and year-round lamb supply.
Summary
Body condition before breeding is an important management tool for improving ewe reproductive success and flock productivity. This study evaluated 327 fall-lambing and 219 spring-lambing commercial Rambouillet ewes to determine how prebreeding body condition score (BCS) influences reproduction, ewe productivity, late-gestation health and lamb outcomes. Ewe BCS was evaluated prior to breeding and throughout gestation, and reproductive performance, lamb survival, growth and health outcomes were monitored through weaning. Prebreeding BCS influenced conception, prolificacy and total pounds of lamb weaned per ewe, with the greatest productivity among exposed ewes occurring at a moderate BCS of approximately 3.0, regardless of season. Greater prebreeding BCS further improved productivity among fall-lambing ewes that conceived but appeared to offer limited advantages for spring-lambing ewes. Prebreeding BCS had limited effects on late-gestation metabolism, lamb health, survival or growth in either season. These results indicate that maintaining ewes near a BCS of 3 before breeding can improve reproductive efficiency and flock productivity without negatively affecting ewe or lamb health and performance through weaning.
Introduction
Increasing U.S. lamb demand and seasonal limitations in domestic production create opportunities to improve out-of-season production systems (USDA-ERS, 2025). Fall-lambing systems can increase production flexibility but require breeding outside the natural reproductive season, which may challenge ewe reproductive performance (Lomet et al., 2020). Body condition scoring is a practical tool for evaluating ewe nutritional status, which plays an important role in reproductive success by influencing energy availability, ovulation and pregnancy establishment (Muñoz et al., 2007). However, variation in prebreeding BCS is common in extensive production systems, and optimal BCS targets for maximizing productivity while maintaining downstream ewe and lamb outcomes remain unclear. Therefore, this study evaluated the relationship between prebreeding BCS thresholds and reproductive performance, ewe productivity, late-gestation metabolic status and lamb outcomes in commercial fall- and spring-lambing Rambouillet ewes.
Procedures
Data were collected from 327 fall-lambing and 219 spring-lambing multiparous commercial Rambouillet ewes (2-6 yr) managed at the NDSU Hettinger Research Extension Center under an approved NDSU Institutional Animal Care and Use Committee protocol. Ewes were managed under commercial flock conditions with uniform nutrition within each production season. Body condition was assessed before breeding, midgestation (~60-90 dGA), late-gestation (~135 dGA) and weaning, using a 1-5 scale in 0.5-point increments. A subset of ewes (fall: n = 78; spring: n = 36) was evaluated for metabolic status and lamb outcomes. Measurements included reproductive performance, lambing outcomes (birthing difficulty, lamb vigor, suckling assistance), lamb survival, adjusted weaning weights, ewe and lamb health, ewe metabolites, and lamb immune outcomes. Data were analyzed within each lambing season using SAS statistical software, with ewe age included in statistical models as a fixed effect.
Results and Discussion
Fall-lambing ewes entered the breeding season at a lower average BCS than spring-lambing ewes (2.74 vs. 3.23), while conception rates were similar between seasons (72.5% and 74.4%). Body condition increased throughout gestation in both systems, with fall-lambing ewes maintaining condition from mid- to late gestation, while spring-lambing ewes continued increasing condition through late gestation. Greater prebreeding BCS was associated with greater body condition throughout gestation. Prebreeding BCS influenced reproductive efficiency and flock productivity, with optimal conception and lamb production occurring near a BCS of 3.0. Greater prebreeding BCS increased the likelihood of multiple births and pounds of lamb weaned per productive ewe. However, prebreeding BCS had limited effects after pregnancy was established, with no major associations observed with lamb growth, mortality, lambing difficulty, ewe health, late-gestation metabolites or most lamb immune outcomes. Maintaining ewes at a moderate prebreeding BCS (~ 3.0) provides a practical strategy to improve reproductive performance and flock productivity without negatively affecting ewe or lamb health.
| Table 1. Summary of experimental ewe cohorts and reproductive performance metrics. | ||
| Fall (April 2025 – January 2026) | Spring (August 2025 – April 2026) | |
| # Exposed ewes (n) | 327 | 226 |
| Average age | 3.42 ± 0.06 | 3.25 ± 0.07 |
| Average weight (lbs) | 151.1 ± 1.19 | 155.1 ± 1.47 |
| Average adjusted pre-breeding BCS | 2.74 ± 0.03 | 3.23 ± 0.03 |
| Conception rate (%) | 72.5 | 74.4 |
| # Productive ewes (n) | 237 | 163 |
| BCS = body condition score. Values are presented as mean ± standard error (SE) for continuous variables and percentages or counts for categorical variables. Exposed ewes represent all ewes participating in the breeding season, whereas productive ewes represent ewes that successfully conceived. Fall data was collected from April 2025 to January 2026, and spring data was collected from August 2025 to April 2026. | ||
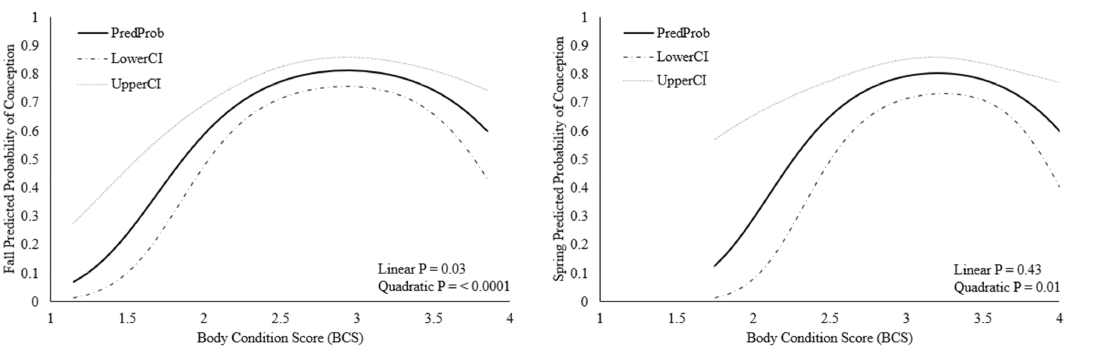
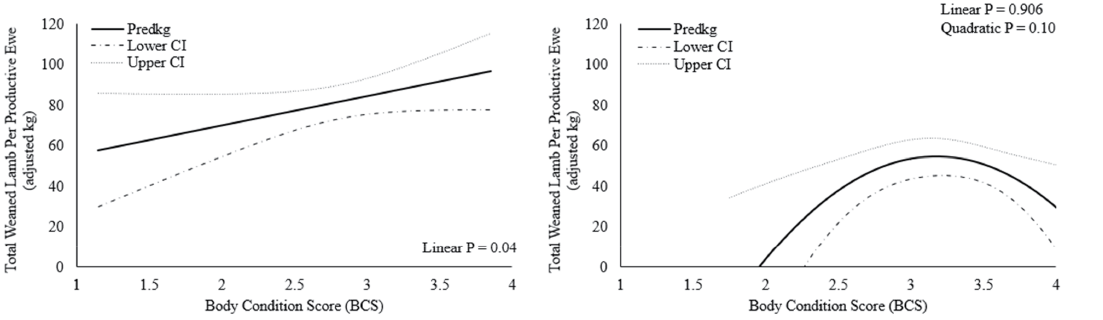
(P = 0.10), maximizing at approximately 3.2.
Acknowledgments
The authors thank the North Dakota State University Hettinger Research Extension Center staff for their contributions to animal care and research support. We also acknowledge the faculty, students, and technicians who assisted with data collection, laboratory analyses and project completion.
Literature Cited
Lomet, D., X. Druart, D. Hazlerigg, M. Beltramo, and H. Dardente. 2020. Circuit-level analysis identifies target genes of sex steroids in ewe seasonal breeding. Mol. Cell. Endocrinol. 512:110825.
Muñoz, C., A. F. Carson, M. A. McCoy, L. E. R. Dawson, N. E. O’Connell, and A. W. Gordon. 2007. Nutritional status of adult ewes during early and mid-pregnancy. 1. Effects of plane of nutrition on ewe reproduction and offspring performance to weaning. Animal. 2:52-63.
USDA Economic Research Service. 2025. Livestock and meat international trade data. U.S. Department of Agriculture. From: https://www.ers.usda.gov/data-products/livestock-and-meat-international….
Finishing Cattle and Shep
AS2304-8 • Whole soybeans and lubabegron in finishing diets: Effects on steer performance and carcass traits
Pauliane Pucetti¹, Madison Bierman2, Timothy Schroeder2 and Kendall C. Swanson¹
¹Animal Sciences Department, NDSU
²Carrington Research and Extension Center, NDSU
Moderate whole-soybean inclusion was more practical than high inclusion. Steers fed 12.5% whole soybeans maintained overall gain closer to those fed 0% whole soybeans, whereas 25% whole soybeans reduced average daily gain and tended to reduce feed efficiency without reducing dry matter intake. Within the 25% whole-soybean diet, lubabegron supplementation tended to improve gain and increased carcass dressing percentage, but it should complement — not replace — careful diet formulation.
Summary
This study evaluated increasing whole-soybean inclusion and the response to lubabegron supplementation in finishing steers. Increasing whole soybeans reduced average daily gain without affecting dry matter intake, with a more pronounced reduction at 25% than at 12.5% inclusion. Within the 25% whole-soybean diet, lubabegron tended to improve gain and increased dressing percentage without increasing intake. These results support moderate whole-soybean inclusion in balanced finishing diets and indicate that lubabegron may improve selected performance and carcass outcomes when high levels of whole soybeans are fed.
Introduction
Feeding whole soybeans can provide dietary protein and lipids in cattle diets. For North Dakota cattle feeders, using whole soybeans directly in finishing diets may create an additional market for soybean growers while replacing part of the corn and supplemental protein source normally used in the ration. The energy value of the diet is expected to increase as soybean lipid replaces carbohydrate; however, more fat does not always result in more gain.
High concentrations of dietary lipid — particularly unsaturated fatty acids — can inhibit ruminal microorganisms, alter fiber digestion and change nutrient use. The response depends on the amount and source of lipid and on the remainder of the diet. Adequate effective fiber, a suitable balance of rumen-degradable and metabolizable protein, and appropriate grain and forage proportions remain important when whole soybeans are added (NASEM, 2016). In the present diets, predicted fat increased from 3.01% to 5.25% and 7.57% of dry matter as whole soybeans increased from 0% to 12.5% and 25%, respectively.
Lubabegron (Experior®; Elanco US Inc., Greenfield, Indiana) is a beta-adrenergic agonist/antagonist approved by the U.S. Food and Drug Administration for reducing ammonia gas emissions per pound of live weight and hot carcass weight when fed during the final 14 to 91 days on feed (FDA, 2018). Research also has reported improvements in average daily gain, feed efficiency and hot carcass weight when lubabegron was fed during the final 56 days (Kube et al., 2021). Whether similar performance responses occur when cattle receive a high level of whole soybeans is not well established. Therefore, the objectives were to determine the effects of increasing levels of whole-soybean inclusion on finishing steer diets and to evaluate the effects of lubabegron supplementation in the 25% whole-soybean diet on intake, growth, efficiency and carcass traits.
Experimental Procedures
A total of 130 crossbred beef steers, averaging approximately 952 lb at the start of the finishing period, were assigned to 16 pens in a completely randomized design at the NDSU Carrington Research Extension Center. Pens contained seven to nine steers each, and four pens were assigned to each treatment. The treatments were 0% whole soybeans (WSB), 12.5% WSB, 25% WSB and 25% WSB plus lubabegron. The first three treatments were used to evaluate the WSB dose response. The fourth treatment received the same 25% WSB basal diet and was used only for the direct lubabegron comparison. One steer was removed before final body weight and carcass data were collected, leaving 31, 33, 33 and 32 steers in the four treatments, respectively. The pen — not the individual animal — was the experimental unit.
The three basal diets were formulated to provide similar crude protein while WSB replaced soybean meal and portions of the energy ingredients (Table 1). The diets were fed for 162 days. Lubabegron was included in the designated 25% WSB treatment during the final 56 days, followed by a seven-day withdrawal interval before harvest. Feed delivery was recorded daily. Bunks were managed to remain practically clean and no measurable refusals were present; consequently, dry matter supplied was used as pen dry matter intake.
Steers were weighed on two consecutive days at the beginning of the experiment, at the start of lubabegron feeding and at the end of the experiment. These weights defined a 99-day prelubabegron period, a 63-day terminal period that included 56-day lubabegron supplementation and seven-day withdrawal, and the complete 162-day feeding period. Average daily gain was calculated from period-specific body weights, and gain-to-feed ratio was calculated as gain divided by dry matter intake. Hot carcass weight, dressing percentage, marbling score, ribeye area, backfat thickness and yield and quality grades were collected at harvest.
Continuous responses were analyzed using the MIXED procedure of SAS with treatment as a fixed effect and one observation per pen. Planned contrasts evaluated linear and quadratic responses among 0%, 12.5% and 25% WSB without lubabegron and the direct comparison between 25% WSB with and without lubabegron. Statistical significance was declared at P ≤ 0.05 and tendencies at 0.05 < P ≤ 0.10.
WSB = whole soybeans; NDF = neutral detergent fiber. The 25% WSB + lubabegron treatment received the same basal diet as the 25% WSB treatment. Nutrient composition was predicted using the 2016 Beef Cattle Nutrient Requirements Model (NASEM, 2016).
Results and Discussion
Initial body weight and body weight at the start of lubabegron feeding did not differ among treatments (P = 0.993 and P = 0.789, respectively; Figure 1), indicating that pens were comparable at both reference points. During the 99-day period before lubabegron feeding, average daily gain decreased linearly from 3.66 to 3.46 and 3.18 lb/day as WSB increased from 0% to 12.5% and 25% of diet dry matter (P = 0.001). Gain-to-feed ratio also decreased linearly during this period (0.159, 0.146 and 0.143; P = 0.005), whereas dry matter intake did not change linearly (P = 0.321). Because these responses occurred before lubabegron was fed, they reflect the WSB diets rather than the feed additive.
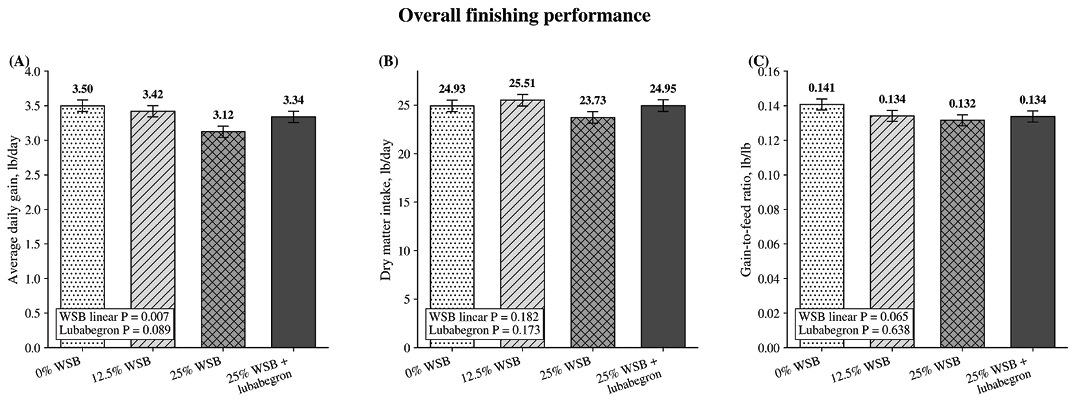
Across the complete 162-day period, average daily gain was 3.50, 3.42 and 3.12 lb/day for 0%, 12.5% and 25% WSB, respectively, and decreased linearly as WSB inclusion increased (P = 0.007; Figure 1A). Overall dry matter intake averaged 24.93, 25.51 and 23.73 lb/day and was not affected by level of WSB inclusion (P = 0.182; Figure 1B). Gain-to-feed ratio tended to decrease linearly (0.141, 0.134 and 0.132; P = 0.065; Figure 1C) with increasing WSB inclusion. Thus, the lower gain at 25% WSB was not simply caused by cattle eating less feed. The 12.5% WSB treatment remained numerically close to the control, whereas performance declined more clearly at 25% WSB.
The diets were formulated to contain almost identical crude protein, and the predicted energy value increased as WSB inclusion increased. Nevertheless, the cattle did not convert the high-WSB diet into additional gain. The study did not directly measure ruminal fermentation or nutrient digestibility, so the mechanisms responsible for the decreased gain cannot be identified. However, the response is consistent with the practical concern that high unsaturated-lipid intake can alter rumen microbial activity and nutrient utilization. Whole soybeans should therefore be evaluated as part of the complete ration rather than only as a source of additional energy. Dietary lipid level, effective fiber, protein supply and the ingredients displaced by WSB all should be considered.
Within the direct 25% WSB comparison, lubabegron tended to increase average daily gain during the 63-day terminal period from 3.04 to 3.42 lb/day (P = 0.088), an increase of approximately 12%. Terminal dry matter intake was similar (26.12 vs. 26.55 lb/day; P = 0.675), and terminal gain-to-feed ratio increased numerically from 0.117 to 0.129 but was not statistically different (P = 0.144). Overall average daily gain also tended to increase from 3.12 to 3.34 lb/day with lubabegron (P = 0.089; Figure 1A). These responses indicate that the possible gain benefit was not driven by greater feed intake.
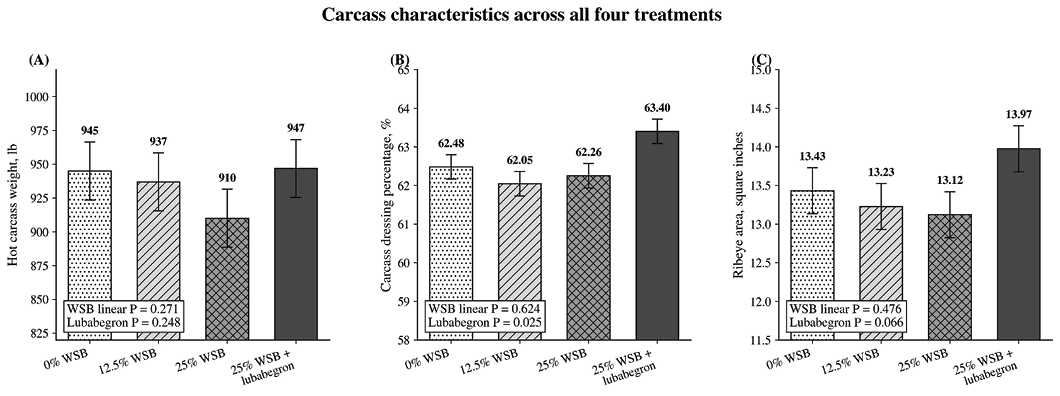
Lubabegron increased dressing percentage from 62.26% to 63.40% within the 25% WSB diet (P = 0.025; Figure 2B). Ribeye area also tended to increase from 13.12 to 13.97 square inches (P = 0.066; Figure 2C). Hot carcass weight was 910 and 947 lb for 25% WSB without and with lubabegron, respectively, but the direct contrast was not significant (P = 0.248; Figure 2A). Marbling score, backfat thickness and calculated yield grade were not affected by lubabegron (P ≥ 0.386).
Lubabegron supplementation produced consistent positive responses within the 25% WSB diet. In addition to increasing dressing percentage, lubabegron tended to improve average daily gain and ribeye area and resulted in a numerical increase in hot carcass weight. Some of these responses did not reach statistical significance, which may be related to the limited number of experimental units available in this study. Future studies with more pens per treatment are warranted to confirm the magnitude and consistency of these responses when lubabegron is supplemented in diets containing high levels of whole soybeans.
In conclusion, whole soybeans can provide a locally available source of protein and energy for finishing cattle, but more was not necessarily better. Under the conditions of this study, 12.5% WSB provided the more balanced practical response, while 25% WSB reduced gain and tended to reduce feed efficiency without reducing intake. Lubabegron improved dressing percentage and tended to improve gain within the 25% WSB diet. It may improve the value recovered during the terminal feeding period, but it should be viewed as a management tool used with a well-balanced diet, not as a substitute for appropriate formulation.
Acknowledgments
The authors thank the North Dakota Soybean Council for financial support and the Carrington Research Extension Center Livestock Unit team for animal care, feeding, daily management, data collection and project support.
References
Food and Drug Administration (FDA). 2018. Freedom of Information Summary, Original New Animal Drug Application NADA 141-508, Experior (lubabegron Type A medicated article). U.S. Food and Drug Administration, Center for Veterinary Medicine. https://animaldrugsatfda.fda.gov/adafda/app/search/public/document/down…
Kube, J. C., B. P. Holland, A. B. Word, J. B. Allen, M. Calvo-Lorenzo, D. McKenna and G. Vogel. 2021. Effects of various doses of lubabegron on calculated ammonia gas emissions, growth performance, and carcass characteristics of beef cattle during the last 56 days of the feeding period. Translational Animal Science 5:txab137.
National Academies of Sciences, Engineering, and Medicine (NASEM). 2016. Nutrient Requirements of Beef Cattle. 8th rev. ed. The National Academies Press, Washington, DC.
Table 1. Ingredient and predicted nutrient composition of finishing diets containing increasing levels of whole soybeans (dry matter basis).
| Item | 0% WSB | 12.5% WSB | 25% WSB |
| Ingredient composition, % of diet DM | |||
| Corn silage | 30.00 | 30.00 | 30.00 |
| Soybean hulls | 11.80 | 13.70 | 10.00 |
| Corn grain | 37.50 | 32.00 | 32.00 |
| Whole soybeans | 0.00 | 12.50 | 25.00 |
| Soybean meal | 17.70 | 8.80 | 0.00 |
| Limestone | 1.50 | 1.50 | 1.50 |
| Vitamin and mineral supplement | 1.35 | 1.35 | 1.35 |
| Salt | 0.15 | 0.15 | 0.15 |
| Predicted nutrient composition | |||
| Net energy for maintenance, Mcal/lb | 0.83 | 0.84 | 0.87 |
| Net energy for gain, Mcal/lb | 0.55 | 0.56 | 0.58 |
| Crude protein, % DM | 16.30 | 16.26 | 16.28 |
| Fat, % DM | 3.01 | 5.25 | 7.57 |
| Physically effective NDF, % DM | 12.41 | 14.16 | 16.00 |
AS2304-9 • Corn grain processing and forage inclusion effects on finishing cattle growth performance and feeding behavior
AS2304-10 • High forage versus high concentrate heifer diets during gestation on progeny carcass traits
Charles A. Bunker1, Samat Amat1, Christy Finck1, Shelby L. Sullivan1, Kiersten M. Gundersen1, Roberta Dahlen1, Carl Dahlen1, Pauliane Pucetti1, Kendall C. Swanson1, Godson Aryee1, Kell Helmuth1 and Kasey Maddock Carlin1
1Department of Animal Scieces, NDSU
Maternal diets during gestation may influence progeny carcass characteristics, as steers from the high-forage dams have displayed heavier cold carcass weights and primal chuck weights, while no significant differences were observed in marbling, ribeye area and 12th rib backfat.
Summary
Limited research has examined the effects of maternal nutrition throughout the whole of gestation in heifers on progeny carcass characteristics and meat quality. This study evaluated the impact of high-forage (HF, 75% forage, 25% concentrate, n = 11) or high-concentrate (HC, 75% concentrate, 25% forage, n = 11) diets fed to crossbred Angus heifers from 15 days prebreeding through calving on offspring carcass traits and meat quality. Progeny were all fed a typical finishing diet and harvested at approximately 14 months of age over a one-month period. The carcasses were evaluated for ribeye area, yield grade, marbling score and 12th rib backfat. Blade, ribeye, sirloin and round steaks were collected upon carcass fabrication for drip loss, shelf-life, thaw loss, cook loss and Warner-Bratzler shear force (14- and 21-day-aged). Cold carcass weights and primal chuck weights were heavier (P < 0.002), and hot carcass weights tended (P < 0.075) to be heavier for HF compared to HC progeny. Live weight, dressing percentage, yield grade, ribeye area, 12th rib backfat and round weights did not differ between treatments. Kidney, pelvic and heart fat percentage tended to be lower (P < 0.09) in HF carcasses. Shear force values did not differ at 14 days of aging; however, at 21 days, HC shear force values were lower (P < 0.019). The HF blade steaks had less water loss (P < 0.008) during thawing. During shelf-life evaluation, HF blade steaks were less (P < 0.05) red (a*) on days 5-7, and there was a tendency (P < 0.06) for lower lightness (L*) in HF round steaks on day 7. Results suggest maternal heifer diets may influence progeny carcass weight as well as affect meat tenderness, thaw loss and color stability in carcass forequarter. The novelty of our findings regarding the chuck indicates a need for all aspects of the carcass parts to be evaluated.
Introduction
High forage-based diets for pregnant heifers may not always be feasible, particularly during times of drought or seasonal changes in the quality of available forages-grasses where nutritional requirements may not be met. Therefore, alternative diets should be considered, as the nutritional needs of heifers are greater than in cows and change throughout the entire length of gestation. There is limited research on the effects of feeding different sources of dietary energy during the whole of gestation on heifers and on progeny outcomes, particularly the quality and yield of the meat they produce. Previous research has evaluated maternal diets and the effects on progeny carcass characteristics, but the focus has been on mature cows and targets specific times of gestation, usually mid- to late-gestation. Radunz et al. (2012) found that progeny that were harvested from cows fed a low-starch diet during late gestation had higher marbling scores, but USDA Low Choice, Upper 2⁄3 and Prime did not differ between treatments (low-starch [grass hay and dried corn distillers grains with solubles] vs. high-starch [corn]). Ewes fed a diet containing high inclusion of dried corn distillers grains with solubles during mid- to late-gestation had lower dressing percentages and boneless, closely trimmed retail cuts of the DDGS diet (Radunz et al. 2011). Given the limited research conducted in this area, it is important to understand which carcass traits can be affected by the diet fed to cows and heifers during gestation. Therefore, the objective was to evaluate the effect of feeding high-forage or high-concentrate diets from 15 days prebreeding through calving on progeny carcass characteristics and meat quality traits.
Procedures
Forty-six crossbred Angus heifers from 15 days prebreeding through calving were fed two different diets to achieve similar average daily gains consisting of either 75% forage and 25% concentrate (n = 24; HF) or 75% concentrate and 25% forage (n = 22; HC). The heifers conceived and calved at the NDSU Beef Cattle Research Complex. For this study, a subset (n = 11; HF, n = 11; HC) of progeny steers were managed similarly throughout growing and finishing. During finishing, all steers were fed the same high-concentrate diet (90% concentrate, DM basis). Steers were fed out at the NDSU Animal Nutrition and Physiology Center and were harvested at approximately 14 months of age over one month, with treatment stratified across harvest days. The steers were harvested at the NDSU Meat Lab under USDA inspection. Carcasses were weighed, and kidney fat was removed and weighed prior to entrance into the carcass cooler. Carcass measurements were recorded, including weight, marbling, ribeye area and 12th rib fat depth. Carcasses were stored in the cooler for 14 days prior to fabrication. Upon fabrication, primal weights and circumference were recorded for round (IMPS 158) and chuck (IMPS 113). Steaks (1 in) from the round (top), sirloin (top), ribeye and blade were cut during carcass fabrication for shelf-life and Warner-Bratzler shear force (WBSF). Smaller samples (1.7 oz) from each cut were used to evaluate drip loss for 48 hours. Steaks for shelf-life were placed on polystyrene trays, overwrapped with PVC film and stored in an upright refrigerator at 34 degrees Fahrenheit for seven days, with L* (black to white), a* (red to green) and b* (yellow to blue) values recorded every 24 hours using a HunterLab spectrophotometer for the evaluation of fresh meat color. Steaks for WBSF were weighed, vacuum packaged and either frozen at minus 3 degrees Fahrenheit (aged 14 days) or stored at 34 degrees Fahrenheit for an additional seven days (aged 21 days) then frozen until evaluation. Steaks were thawed at 34 degrees Fahrenheit and weighed to measure thaw water loss. Steaks were cooked on a clam-shell grill to 152-154 degrees Fahrenheit, removed and rested on a metal tray until a peak temperature of 165-170 degrees Fahrenheit was reached and recorded. Cooked steaks were weighed to determine cook loss percentage. Steaks were stored at 34 degrees Fahrenheit overnight. For WBSF, a minimum of three cores were removed parallel with muscle fiber, and shear force was determined by measuring the amount of force needed in kilograms to shear through each core using a Warner-Bratzler shear force machine.
Results and Discussion
Steers from the heifers given the HF diet during gestation had a tendency (P < 0.08) for higher hot carcass weights (766.1 lb vs. 741.6 lbs.; SE = 9.3 lb). The left side cold carcass weight was heavier for the high forage than the high concentrate diet (364.9 lb vs. 342.4 lb, respectively; SE = 4.4 lb; P < 0.002). Additionally, the primal chuck weight for the HF diet was heavier (129.9 lb vs. 121.7 lb; SE= 1.5 lb; P < 0.002). There weren’t any differences (P > 0.1) of maternal diets on steer progeny final live weights, dressing percentages, 12th rib backfat and ribeye area, marbling score, total kidney fat and final yield. Water loss during thawing was greater for the HC diet in the blade steak (6.77% vs. 5.12% P < 0.008). Additionally, the blade steak also tended (P < 0.05) to have higher a* values (more red) for days 5, 6 and 7 of simulated retail display in the HC diet. There was also a tendency (P < 0.06) for lower L* values (lightness) in HF round steaks on day 7 of display. While no differences were observed in the 14-day aged steaks between the treatment diets, WBSF for the HC diet was lower compared to the high forage (2.37 kg vs. 2.58 kg; P < 0.019) in 21-day aged steaks, which is most likely driven by a large difference between blade steaks where the HC diet showed lower (more tender) WBSF values compared to the HF diet (2.5 kg vs. 2.94 kg; P < 0.04). Based on our observations, the primal chuck of offspring carcasses was influenced the most by heifer gestational diet. The HF steers had heavier primal chuck while the HC steers had a more red, lighter blade steaks that were more tender after 21 days of aging. However, the HC had greater thaw loss. Evaluation of the beef chuck has not often been evaluated in previous evaluations of maternal diet on progeny meat yield and quality. Based on the results of this study, evaluation of the primal chuck should be investigated further.
Acknowledgments
The authors would like to thank the meat lab managers Jason Bahls and Jacob Anztzen and their student employees for their help with harvest and fabrication. Funding for this project was provided by the North Dakota State Board of Agriculture Research and Education and USDA NIFA grant project #2022-67016-37092.
Literature Cited
Finck, C. A., P. Pucetti, G. Aryee, K. Helmuth, C. R. Dahlen, K. K. Sedivec, S. Amat, and K. C. Swanson. 2025. Evaluating the impact of maternal diet during gestation on offspring energetic efficiency in finishing steers. North Dakota Livestock Research Report, pg. 9–11.
Kuzel, B. M., J. L. Hurlbert, K. R. M. Slavick, M. S. P. Carlis, C. R. Dahlen, S. Amat, K. K. Sedivec, K. C. Swanson, J. S. Caton, S. R. Underdahl, and G. D. Ramirez-Zamudio. 2025. High-forage vs. high-concentrate diets fed to beef heifers during pregnancy and the impacts on blood metabolite and hormone profiles in the dam and calf and growth of the male calves through 235 days of age. North Dakota Livestock Research Report, pg. 12–16.
Radunz, A. E., F. L. Fluharty, A. E. Relling, T. L. Felix, L. M. Shoup, H. N. Zerby, and S. C. Loerch. 2012. Prepartum dietary energy source fed to beef cows: II. effects on progeny postnatal growth, glucose tolerance, and carcass composition. J. Anim. Sci. 90:4962–4974.
Radunz, A. E., F. L. Fluharty, I. Susin, T. L. Felix, H. N. Zerby, and S. C. Loerch. 2011. Winter-feeding systems for gestating sheep II. effects on feedlot performance, glucose tolerance, and carcass composition of Lamb progeny. J. Anim. Sci. 89:478–488.
Table 1. Least square means for carcass measurements from steers whose dams were fed either a high concentrate (HC) or high forage (HF) diet throughout gestation.
| Variable | Treatment | SEM | P-value | |
|---|---|---|---|---|
| Concentrate (HC) | Forage (HF) | |||
| Marbeling Score = 400-499 = small; 500-599 = modest | ||||
| Live Weight (lb.) | 1,262.40 | 1,282.40 | 16.8 | 0.40 |
| Hot Carcass Weight (lb.) | 741.6 | 766.1 | 9.3 | 0.08 |
| Dressing Percentage (%) | 58.8 | 59.7 | 0.4 | 0.14 |
| 12th Rib Backfat (in.) | 0.63 | 0.69 | 0.06 | 0.53 |
| Kidney, Pelvic, and Heart Fat (%) | 2.32 | 2.14 | 0.07 | 0.10 |
| Ribeye Area (in.2) | 12 | 12.17 | 0.9 | 0.67 |
| Marbling Score | 421 | 449 | 13 | 0.13 |
| Total Kidney Fat (lb.) | 7.44 | 6.85 | 1.07 | 0.70 |
| Final Yield Grade | 2.1 | 2.2 | 0.2 | 0.73 |
Table 2. Least square means for cold carcass weight and primal chuck and round measurements from steers whose dams were fed either a high concentrate (HC) or high forage (HF) diet throughout gestation.
| Variable | Treatment | SEM | P-value | |
|---|---|---|---|---|
| Concentrate (HC) | Forage (HF) | |||
| Cold Carcass Weight - one side (lb.) | 342.6 | 364.9 | 4.4 | 0.002 |
| Primal Round Weight (lb.) | 75.4 | 79.4 | 1.8 | 0.12 |
| Primal Round Circumference (in.) | 44.2 | 45 | 0.6 | 0.28 |
| Primal Chuck Weight (lb.) | 121.7 | 129.9 | 1.5 | 0.002 |
| Primal Chuck Circumference (in.) | 59.3 | 60.9 | 0.7 | 0.13 |
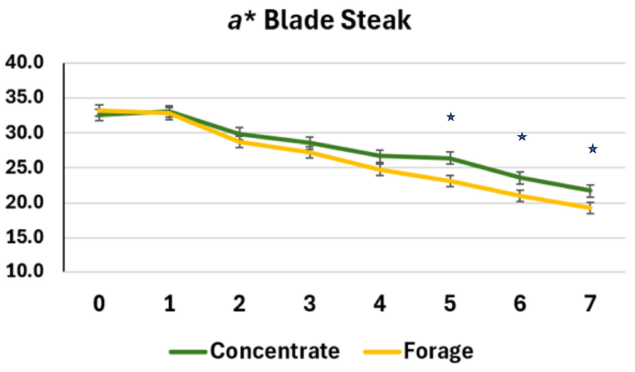
* = Indicates days where HC diet was significant P < .05
Heifer Nutrition
AS2304-11 • Protein and energy supplementation during midgestation in beef heifers and the impacts on maternal performance, metabolic status, calving characteristics and offspring outcomes through weaning
Jennifer L. Hurlbert1, Brooklyn M. Kuzel1, Shelby L. Sullivan1, Antonio Braga1, Kevin K. Sedivec2 and Carl R. Dahlen1
1Department of Animal Sciences, NDSU, Center for Nutrition and Pregnancy, Fargo, ND 58108
2North Dakota State University, Central Grasslands Research Extension Center, Streeter, ND
This study evaluated whether protein and energy supplementation during midgestation could improve heifer nutritional status, calving characteristics and calf growth through weaning. Strategic protein and energy supplementation during midgestation improved heifer body weight and condition and reduced reliance on body reserves for protein and energy metabolism. Calves born to supplemented heifers were heavier at birth and tended to be heavier through weaning, with the greatest weight advantage observed at pasture turn out.
Summary
Forage quality for beef cattle often declines in late summer, fall and winter, potentially limiting the protein and dietary energy available to pregnant cows and heifers. Strategic supplementation during midgestation may help meet increasing nutrient demands while supporting dam condition and calf growth. This study evaluated whether protein and energy supplementation of pregnant beef heifers from day 90 to 186 of gestation could improve dam nutritional status and calf growth through weaning. Heifers received either a forage-based diet (CON; n = 22) or a forage-based diet plus a protein and energy supplement (SUPP; n = 22) before being managed similarly after the supplementation period. Supplemented heifers gained more weight, had greater body condition scores and had lower circulating nonesterified fatty acids, indicating less reliance on body fat reserves. Calves from supplemented heifers were 5.2 lb heavier at birth and tended to be heavier through weaning, with the greatest weight advantage of 17.5 lb observed at pasture turnout. Overall, strategic protein and energy supplementation during midgestation improved maternal nutritional status and supported greater early life calf growth, although further evaluation is needed to determine whether these benefits persist beyond weaning. Further evaluation of postweaning performance and subsequent breeding season success in the cow herd will help determine the long-term production value of this management strategy.
Introduction
Nutritive value of grazed forages for beef cattle often declines in the late summer/fall and winter months, with crude protein levels dropping below 6% in some regions (Schauer et al., 2005). During this period, pregnant heifers in the northern Great Plains, often in their second trimester of gestation for spring-calving cow herds, may struggle to meet the protein and energy demands of gestation with grazed forages alone. Strategic supplementation during midgestation therefore has the potential not only improve forage utilization and digestibility in the dam but also elicit positive outcomes on calf growth before birth and subsequently throughout postnatal life (Llewellyn et al., 2006; Cappellozza et al., 2014).
The objectives were to evaluate the impacts of providing a protein and energy supplement to beef heifers during midgestation on dam performance, calving outcomes, circulating blood metabolites in the dam and calf, and growth performance of the male offspring through weaning. We hypothesized that protein/energy supplementation would increase dam and calf body weights, enhance circulating blood metabolites, and positively influence placental and colostrum characteristics at calving and postnatal growth in the calf.
Procedures
Angus-based beef heifers (n = 143) were bred via artificial insemination (AI) using male sexed semen at the NDSU Central Grasslands Research Extension Center (CGREC). Pregnancies were confirmed on day 35 after breeding, and fetal sex was determined at day 65 after breeding. Shortly after, all heifers pregnant to AI with male fetuses (n = 44; initial body weight [BW] = = 940.9 ± 68 lb) were transported to the NDSU Beef Cattle Research Complex (BCRC) in Fargo, North Dakota, stratified by body weight and randomly assigned to receive a protein and energy supplement with a basal forage diet (SUPP; n = 22) or a basal forage diet with no supplementation (CON; n = 22) from day 90 to day 186 of gestation. The diet for SUPP heifers consisted of 30% corn silage, 45% grass hay and 25% Accuration (Land O’ Lakes Purina) on a dry-matter basis, while the diet for CON heifers consisted of 40% corn silage and 60% grass hay on a dry-matter basis. All heifers received a pelleted mineral product at the company-directed rate of 1 lb per day.
Daily feed intakes were managed strategically with the Insentec feeding system to target daily gains of 0.62 lb/day for heifers assigned to CON and 1.74 lb/day for heifers assigned to SUPP. Body weights were collected on the pregnant heifers every two weeks and body condition scores on a nine-point scale were recorded at the start (day 90), midpoint (day 138) and end (day 186) of the second trimester feeding trial. Following the treatment period, all heifers were transported back to the CGREC and managed on a common forage-based diet through parturition and pasture turnout. Heifers were also weighed shortly before calving (d 257), at calving (average d 279) and at pasture turnout (average 68 day postpartum). Blood samples were collected from the dams at these six major time points throughout the experiment and from their calves at birth, pasture turnout and at weaning. Blood serum samples were analyzed for concentrations of glucose, nonesterified fatty acids (NEFA) and blood urea nitrogen (BUN).
At calving and prior to suckling, BW of the dam and neonatal calf (n = 21 CON; n = 21 SUPP) were recorded, and calving date was recorded to calculate gestation length. Dams were assigned a calving ease score from 1 to 5 (1 = unassisted birth to 5 = cesarean). Additionally, a single quarter of the udder was completely milked to estimate colostrum volume and mass. The placenta was collected upon expulsion and rinsed and weighed, and total number of cotyledons were counted. In the period shortly after birth, calves were assigned a vigor score of 1 to 5 (1 = nursed independently to 5 = stillborn). At 24 hours after colostrum consumption, calf BW was recorded, and morphometric characteristics were evaluated, including chest and abdominal circumference, crown-rump length, shoulder-to-hip length, hip width and hip height. Calves continued to be weighed at pasture turnout and at weaning. As mentioned previously, the male calves born in this experiment were weighed, and blood was collected at birth, pasture turnout and weaning to determine if maternal supplementation influenced long-term growth and metabolism.
Statistical Methods
Data were analyzed as a completely randomized design, and individual animal was considered the experimental unit for all analysis. All variables were analyzed using the MIXED procedure of SAS with repeated measures applied where appropriate. Variables were analyzed for the effect of F0 treatment, day of gestation/age and the respective interaction. Significance was considered at P ≤ 0.05, and tendencies considered at 0.05 < P ≤ 0.10.
Results and Discussion
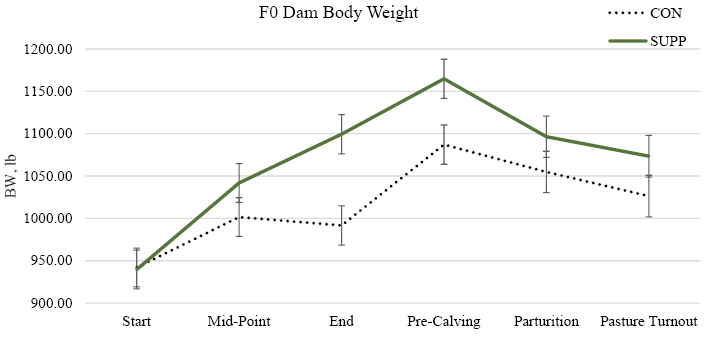
The actual gains recorded during the midgestation supplementation period were 0.55 lb/day and 1.66 lb/day for CON and SUPP heifers, respectively. Furthermore, SUPP heifers were heavier than CON at the end of the supplementation period and at calving (P = 0.02; Figure 1). While heifers were similar in BW at the start of the trial (day 90 in pregnancy) by design, at day 186, we observed a 108-lb difference in BW between treatments (P < 0.05). Interestingly, this weight difference was sustained through late pregnancy (77-lb difference; P < 0.05) and pasture turnout (42-lb difference; P < 0.10). The body condition scores recorded during this period complement the weight differences we observed, with SUPP heifers having greater body condition scores at the end of the supplementation period than CON heifers (5.8 vs. 4.7 BCS; P = 0.01).
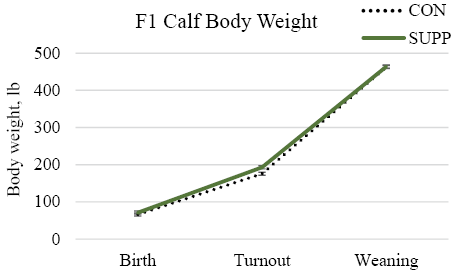
At calving, we observed no differences in gestation length (P = 0.13) between CON and SUPP (280 vs. 278 days, respectively), calving ease (P = 0.32) or calf vigor scores (P = 0.68). Colostrum production and mass were also not different (P ≥ 0.16) between CON and SUPP, and placental characteristics (weight, number of cotyledons and weight of cotyledons) were not different (P ≥ 0.50) between treatments. However, the F1 bull calves born to SUPP heifers were 5.2 lb heavier (P = 0.04) than calves born to CON heifers prior to suckling (Figure 2). Also at birth, SUPP calves had greater chest circumference (P = 0.05) and tended to have greater abdominal circumference and greater hip height measurements (P < 0.10) compared with CON. Despite a difference in birth weights of SUPP and CON calves, the long-term growth performance of the F1 bull calves was not impacted by the interaction of treatment and day (P = 0.36; Figure 2). However, postnatal bull calf growth performance tended (P = 0.10) to be greater in SUPP calves compared with CON, which was driven by a 17.5-lb weight advantage in SUPP calves at pasture turnout but only a 1-lb advantage in SUPP calves at weaning. Calf body weight was also impacted by the effect of day (P < 0.01), which is expected as calf weights increased from birth to weaning.
We observed no impact (P ≥ 0.18) of the interaction of treatment and day on circulating blood metabolites in the dam for glucose or BUN. However, we observed a tendency (P = 0.08) for concentrations of NEFA in the F0 dam to be influenced by the interaction of treatment and day. We also observed that both NEFA and BUN were impacted (P ≤ 0.05) by protein/energy supplementation during midgestation (Table 1), in which concentrations of NEFA were lower (P = 0.02) for SUPP heifers compared with CON and concentrations of BUN were greater (P = 0.05) in SUPP compared with CON heifers. We observed no impact (P = 0.34) of treatment during midgestation on circulating concentrations of glucose in the dam. The effect of day was also observed (P ≤ 0.01) for glucose, NEFA and BUN in SUPP and CON dams (Table 1).
In the F1 bull calves born to CON and SUPP dams, we observed an interaction of treatment and day (P = 0.04) for concentrations of NEFA in the calf, indicating greater concentration of NEFA in SUPP calves at birth and pasture turn out (P ≤ 0.05) compared with CON calves. We also observed an effect of day for concentrations of glucose and BUN in the F1 calf (P ≤ 0.01). However, concentrations of glucose and BUN in the F1 calf were not influenced by the main effect of F0 maternal treatment (P ≥ 0.11; Table 2).
Most fetal growth and increases in nutrient demand for the pregnant cow occur between mid- and late gestation. Because of this, the level of protein and energy provided to cows during midgestation can influence both cow condition and early calf performance. In the current study, protein and energy supplementation increased cow body weight, body condition score, and improved metabolic indicators of energy and protein status during pregnancy. Supplemented cows had lower circulating NEFA, indicating less reliance on body fat mobilization, and slightly greater BUN, reflecting improved protein intake and nitrogen availability (Silva et al., 2019). These results suggest that strategic supplementation helped cows meet pregnancy demands using dietary nutrients rather than body reserves.
Calves born to supplemented cows were 5.2 lb heavier at birth and 17.5 lb heavier at pasture turnout (approximately 70 days of age), demonstrating a short-term growth advantage. However, body weight differences did not persist through weaning, likely due to similar postnatal grazing conditions across treatment groups and catch-up growth exhibited by CON calves. Although long-term weight differences were not observed, calves from supplemented cows showed greater circulating NEFA early in life, suggesting differences in energy use or fat metabolism during the preweaning period. Because midgestation coincides with critical periods of muscle and fat tissue development, improved maternal nutrition during this window may influence early tissue growth and metabolic function in the calf.
Similar responses have been observed in related work from our laboratory, where protein and energy supplementation during early gestation in beef heifers resulted in sustained improvements in cow body weight and modest, short-term increases in calf birth weight, observed as a 2-lb birth weight advantage in calves born to supplemented dams (Baumgaertner et al., 2024). In that study, body weight differences in female offspring were negligible at weaning, but re-emerged after puberty, suggesting that gestational nutrition may have longer-term impacts on animal performance that are not immediately evident at weaning.
Overall, these findings indicate that strategic protein and energy supplementation during midgestation can improve cow condition, reduce reliance on body reserves and enhance early calf growth. While postweaning management may minimize visible weight differences, improved maternal nutrition during pregnancy may still provide long-term benefits for offspring performance and productivity. Additional evaluation of postweaning growth and carcass traits will help determine the full production value of midgestation supplementation programs for offspring developed for terminal or breeding markets.
Conclusions
These data show that providing supplemental protein and energy and greater rates of gain during the second trimester of pregnancy supported increased birth weight and body measurements in the neonatal calf, but did not impact maternal BW at calving, colostrum production or placental characteristics. Further evaluation of growth performance and metabolic phenotype in the F1 male offspring at later postnatal time points will help determine whether maternal nutritional management during gestation induces long-term programming outcomes that could enhance offspring productivity and contribute to global food security.
Funding Acknowledgements
The authors express their appreciation to the North Dakota Corn Utilization Council, Purina Animal Nutrition, and USDA-NIFA Predoctoral Fellowship #2024-67011-43015 for funding support of this project and the personnel involved in this effort. Appreciation is also given to the staff and students at the NDSU Beef Cattle Research Complex, Central Grasslands Research and Extension Center, and the NDSU Nutrition Lab.
Literature Cited
Baumgaertner, F., A. C. B. Menezes, W. J. S. Diniz, J. L. Hurlbert, K. A. Bochantin, S. R. Underdahl, J. D. Kirsch, S. T. Dorsam, K. L. McCarthy, G. D. Ramirez-Zamudio, K. K. Sedivec, J. S. Caton, and C. R. Dahlen. 2024. Effects of rate of body weight gain during the first trimester of gestation on beef heifer and offspring performance, concentrations of hormones and metabolites, and response to vaccination. J. Anim. Sci. 102:skae193.
Cappellozza, B. I., R. F. Cooke, M. M. Reis, P. Moriel, D. H. Keisler, and D. W. Bohnert. 2014. Supplementation based on protein or energy ingredients to beef cattle consuming low-quality cool-season forages: II. Performance, reproductive, and metabolic responses of replacement heifers. J. Anim. Sci. 92:2725–2734.
Llewellyn, D. A., R. C. Cochran, T. T. Marston, D. M. Grieger, C. G. Farmer, and T. A. Wickersham. 2006. Influence of limited fall protein supplementation on performance and forage utilization by beef cattle grazing low-quality native grass pastures. Anim. Feed Sci. Technol. 127:234–250.
Schauer, C. S., D. W. Bohnert, D. C. Ganskopp, C. J. Richards, and S. J. Falck. 2005. Influence of protein supplementation frequency on cows consuming low-quality forage: Performance, grazing behavior, and variation in supplement intake. J. Anim. Sci. 83:1715–1725.
Silva, L. F. P., R. M. Dixon, and D. F. A. Costa. 2019. Nitrogen recycling and feed efficiency of cattle fed protein-restricted diets. Anim. Prod. Sci. 59:2093–2107.
| Table 1. Blood metabolites in F0 beef heifers during the supplementation period (day 90 to 186) through calving and pasture turnout. | ||||||
| Treatment1 | P-Values | |||||
| Item3 | CON | SUPP | SEM2 | TRT | Day | TRT×Day |
| Glucose, mg/dL | 0.34 | <0.01 | 0.79 | |||
| Start | 66.0 | 69.3 | 3.10 | |||
| Midpoint | 60.0 | 64.0 | 3.07 | |||
| End | 63.7 | 63.1 | 3.10 | |||
| Precalving | 68.5 | 71.2 | 3.18 | |||
| Parturition | 96.1 | 95.8 | 4.73 | |||
| Pasture Turnout | 59.9 | 58.7 | 3.31 | |||
| NEFA, µmol/L | 0.02 | <0.01 | 0.08 | |||
| Start | 268.8 | 211.1 | 39.51 | |||
| Midpoint | 264.7 | 270.9 | 38.97 | |||
| End | 606.3 | 428.8 | 40.18 | |||
| Precalving | 977.9 | 716.5 | 45.70 | |||
| Parturition | 662.8 | 600.2 | 40.94 | |||
| Pasture Turnout | 334.5 | 404.6 | 41.51 | |||
| BUN, mg/dL | 0.05 | <0.01 | 0.77 | |||
| Start | 7.6 | 7.7 | 0.56 | |||
| Midpoint | 10.8 | 11.5 | 0.56 | |||
| End | 11.1 | 11.8 | 0.57 | |||
| Precalving | 9.6 | 9.4 | 0.57 | |||
| Parturition | 6.7 | 7.5 | 0.59 | |||
| Pasture Turnout | 8.9 | 9.7 | 0.61 | |||
| 1Heifers were assigned to receive a basal forage diet with target body weight gains of 0.28 kg/hd/d (CON, n = 22) or a basal forage diet plus a protein and energy supplement with target body weight gains of 0.79 kg/hd/d (SUPP, n = 22). 2Standard error of the mean. 3Metabolites evaluated included glucose, nonesterified fatty acids (NEFA) and blood urea nitrogen (BUN). | ||||||
| Table 2. Blood metabolites in F1 male offspring born to dams provided with a basal diet (CON) or to dams provided with a basal diet plus a protein/energy supplement (SUPP). | ||||||
| Treatment1 | P-Values | |||||
| Item3 | CON | SUPP | SEM2 | TRT | Day | TRT×Day |
| Glucose, mg/dL | 0.11 | <0.01 | 0.61 | |||
| Birth | 70.4 | 63.3 | 4.01 | |||
| Turnout | 97.8 | 89.8 | 4.23 | |||
| Weaning | 81.5 | 80.8 | 4.12 | |||
| NEFA, µmol/L | 0.01 | 0.03 | 0.14 | |||
| Birth | 172.2 | 252.6 | 27.51 | |||
| Turnout | 92.5 | 194.2 | 29.29 | |||
| Weaning | 209.4 | 208.8 | 26.74 | |||
| BUN, mg/dL | 0.56 | <0.01 | 0.19 | |||
| Birth | 9.1 | 10.3 | 0.48 | |||
| Turnout | 8.9 | 8.9 | 0.52 | |||
| Weaning | 16.4 | 15.9 | 0.50 | |||
| 1F0 Heifers were assigned to receive a basal forage diet with target body weight gains of 0.28 kg/hd/d (CON, n = 22) or a basal forage diet plus a protein and energy supplement with target body weight gains of 0.79 kg/hd/d (SUPP, n = 22). The F1 offspring were managed on a common diet from birth through weaning. 2Standard error of the mean. 3Metabolites evaluated included glucose, nonesterified fatty acids (NEFA) and blood urea nitrogen (BUN). | ||||||
AS2304-12 • Utilizing a precision supplement delivery system to provide protein and energy supplementation to beef heifers grazing fall native range pasture during midgestation
Jennifer L. Hurlbert1, Brooklyn M. Kuzel1, Michael Undi2, Kevin K. Sedivec2 and Carl R. Dahlen1
1Department of Animal Sciences, NDSU, Center for Nutrition and Pregnancy, Fargo, ND, USA
2North Dakota State University, Central Grasslands Research Extension Center, Streeter, ND, USA
The objectives of this study were to evaluate the effects of providing a protein and energy supplement using precision feeding technology to beef heifers during midgestation grazing fall native range pasture on body weight, supplement intake, metabolic status and diet digestibility. We observed that heifers assigned to receive supplementation on fall pasture tended to be heavier than nonsupplemented controls and had altered blood concentrations of blood urea nitrogen (BUN) and nonesterified fatty acids (NEFA), suggesting an influence of supplementation on energy balance and nitrogen metabolism in supplemented heifers. However, impacts on body weights of the calves exposed to different maternal nutritional environments during the second trimester of gestation were limited.
Summary
Our objectives were to utilize precision feed delivery systems to deliver a protein and energy supplement to beef heifers grazing fall native range pastures and to evaluate the effects of supplementation during midgestation on body weight, supplement intake and metabolic status. The potential impacts on birth and pasture turnout weights of the calves born to females exposed to protein and energy supplementation or the control diet (pasture grazing only) were also evaluated. We observed that heifers receiving supplementation tended to be heavier than nonsupplemented heifers, but we did not observe an impact on calf birth or pasture turnout body weights. Metabolic status appeared to be improved in supplemented heifers, as circulating concentrations of blood urea nitrogen and nonesterified fatty acids reflected a more positive energy balance and nitrogen recycling state compared with control-fed heifers. Measures of digestibility also improved with supplement delivery as forage nutritive value fell in the late fall.
Introduction
Nearly one-third of the heifer calves in North Dakota are retained each year as replacement females, making their development critical to the future productivity and genetic progress of the state’s beef industry. Because first-calf heifers must simultaneously support fetal growth, lactation and their own continued growth, their nutrient requirements exceed those of mature cows. In North Dakota spring-calving herds, however, midgestation coincides with the fall grazing season, when native range forage quality declines substantially, creating nutritional challenges for both the pregnant heifers and their developing calves (Schauer et al., 2005; Llewellyn et al., 2006). Therefore, the objectives of this project were to determine whether strategic corn-based protein and energy supplementation via a precision delivery system during midgestation could improve nutrient digestibility, maternal metabolic status and subsequent performance of the dam and her offspring. We hypothesized that beef heifers receiving supplemental protein/energy while grazing low-quality fall pasture during midgestation would have differing hormone/metabolite profiles and have enhanced measures of digestibility on pasture compared with nonsupplemented cohorts. We further hypothesized that calves born to protein/energy-supplemented dams would exhibit altered postnatal growth compared with calves born to nonsupplemented dams.
Procedures
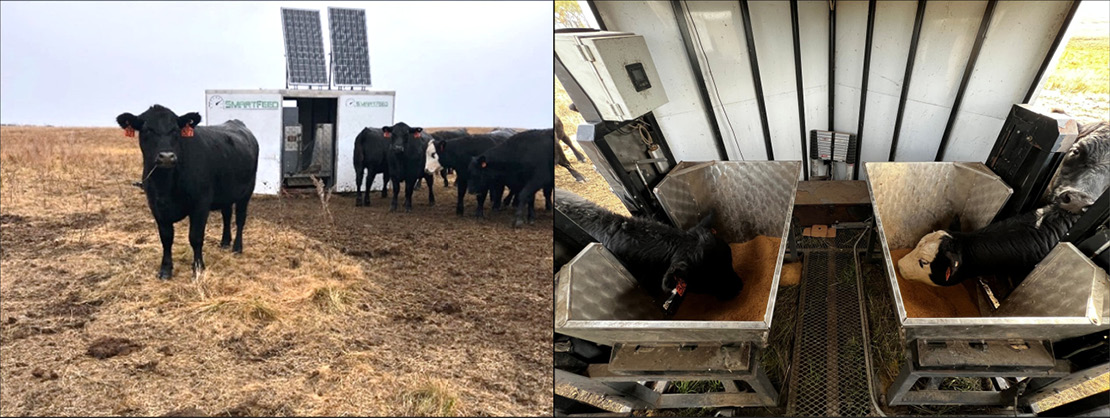
To accomplish these objectives, Angus-based heifers (n = 30; initial body weight [BW] = 960 ± 79.3 lb) were bred by live cover bulls, then stratified by BW and randomly assigned to one of two treatments at approximately day 90 of pregnancy (start of second trimester). Heifers were assigned to either graze native range pasture (CON; n = 15) or the same native range pasture plus have access to a protein and energy supplement (SUPP; n = 15) delivered at a rate of 0.6% of BW on a dry-matter basis using SmartFeed Pro units from C-Lock, Inc. in two enclosed trailers on the pasture (Figure 1). The protein and energy supplement was a corn and dried distillers grains-based supplement with 18% crude protein. Treatments were applied for 59 days beginning in late September and concluding in late November. Following the end point collection at the end of the 59-day period, heifers were managed on a common diet in a single pen until pasture turnout in the spring.
Supplement intake was controlled for all animals in the pasture with the use of a radio frequency identification (RFID) tag. The RFID tag associated with each animal either allowed access to the supplement via a gate that opened at a maximum intake level assigned daily (SUPP) or did not allow access to the feeders (CON). This system allowed individualized management and feed intake records of each animal on a daily basis.
Consecutive-day body weights, blood serum and pasture clippings were collected at the beginning (September), midpoint (October) and end (December) of the 59-day supplementation period. Consecutive-day body weights were used to assign the heifers to their individual supplement allotments (SUPP heifers only) at 0.6% of body weight on a dry-matter basis. Weights were also collected from the dam prior to calving (late January) and at pasture turnout (May) and from the calves born in the spring at birth (April) and again at pasture turnout to evaluate the potential long-term outcomes on maternal supplementation during the second trimester of gestation.
Blood samples were analyzed for concentrations of glucose, nonesterified fatty acids (NEFA) and blood urea nitrogen (BUN) to assess metabolic status of the dams throughout the supplementation period. A chemical analysis was performed on pasture clippings collected throughout the supplementation period to assess the expected decline in forage quality as the grazing season advanced.
Digestibility trials were conducted immediately before supplementation in the fall (period 1) and again near the end of the 59-day grazing period (period 2) via oral administration of chromium oxide boluses for 10 consecutive days at the start and end of the feeding trial, with five consecutive days (day 5 through 10 of bolus administration) of spot-collected fecal samples. The concentration of chromium in the fecal samples was utilized to predict daily fecal output, and subsequent calculations of nutritive composition of the feed available (supplement and forage) and in the feces were used to estimate digestibility.
Statistical Methods
Individual animal was considered the experimental unit as intake of the supplement was monitored on an individual basis. All variables were analyzed using the MIXED procedure of SAS with repeated measures applied where appropriate. Results are presented as LSMEANS with the standard error of the mean. Variables were analyzed for the effect of F0 treatment, day of gestation/age and the respective interaction. Significance was considered at P ≤ 0.05, and tendencies considered at 0.05 < P ≤ 0.10.
Results and Discussion
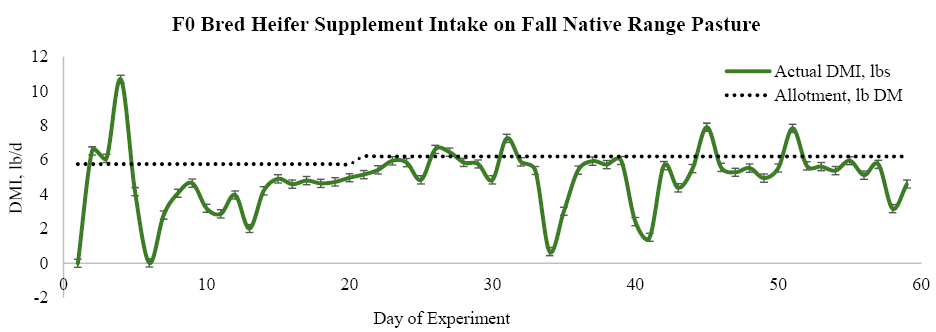
As expected, crude protein levels in the native range pasture decreased from 8.6% in September to 5.8% in November. Neutral detergent (NDF) and acid detergent fiber (ADF) increased, however, from mid-September to late November, with NDF increasing from 61.1% to 67.6% and ADF increasing from 34.1% to 38.1% from September to November. Supplement intake recorded from the SmartFeed Pro system (Figure 2) indicated that, despite average daily feed allowances set for SUPP heifers across the 59-day supplement access period at 6.05 lb dry-matter per day (0.6% of BW), the actual dry-matter consumption of supplement was only 4.90 lb per day (0.47% of BW).
Digestibility trials were conducted at the beginning (day -13 to day -4 prior to supplement access (period 1)) and near the end of the supplementation period (day 50 to day 59 (period 2)). During period 1, CON and SUPP heifers had similar forage intake, fecal output and apparent diet digestibility (P ≥ 0.10; Table 1), suggesting that the groups entered the study with comparable intake and nutrient utilization. Consistent with the decline in forage nutritive value described above, fecal output increased (DM, OM, NDF, ADF) in both treatments (P ≤ 0.01) and apparent dry matter (DM) and crude protein (CP) digestibility decreased in CON heifers (P ≤ 0.03) throughout the grazing season. During period 2, CON heifers consumed more forage than SUPP heifers (26.94 vs. 22.55 lb DM/d), whereas SUPP heifers consumed 5.84 lb supplement DM/d during period 2 (10 d average), resulting in only a modest increase in total DMI (28.37 vs. 26.94 lb/d). This represented a substitution rate of approximately 0.75 lb forage DM per kilogram of supplement DM consumed. Despite lower forage intake, SUPP heifers had greater (P = 0.01) DM digestibility than CON heifers during trial 2 (46.5 vs. 41.5%) and markedly greater (P < 0.01) CP digestibility (41.2 vs. 11.9%). This particularly large improvement in CP digestibility suggests that, at least in part, the greater CP supply provided by the supplement and the replacement of low-quality mature forage with a feed ingredietn containing more readily digestible protein.
Circulating blood metabolites for heifers during the fall grazing period also indicated differences in nitrogen and energy metabolism between treatments as the supplementation period progressed. Concentrations of BUN were greater in SUPP heifers compared with CON at the midpoint and end of the fall feeding period but similar at the start of the trial, as identified with an interaction of treatment and day (P = 0.02; Table 2). Similarly, concentrations of NEFA were also greater in SUPP heifers compared with CON at the end-point blood collection but were similar at the beginning and midpoint of the feeding trial, as observed as an interaction between treatment and day (P = 0.01). No differences were observed between SUPP and CON for concentrations of blood glucose throughout the feeding period (P ≥ 0.11); however, a day effect was observed (P = 0.03) in which glucose concentrations increased throughout the feeding period for both CON and SUPP heifers.
The blood metabolite responses support the differences in nutrient utilization observed during period 2. As forage CP declined through the grazing season, greater apparent CP digestibility in SUPP heifers was accompanied by greater circulating BUN, supporting increased nitrogen availability and metabolism in response to protein and energy supplementation. Conversely, lower BUN concentrations in CON heifers were consistent with reduced dietary nitrogen availability as forage quality declined. Greater NEFA concentrations in CON heifers at the end of supplementation further suggest increased mobilization of body fat reserves as nutrient availability from pasture became increasingly limited. Collectively, the digestibility and circulating metabolite responses indicate that supplementation helped mitigate the nutritional challenges associated with declining fall forage quality.
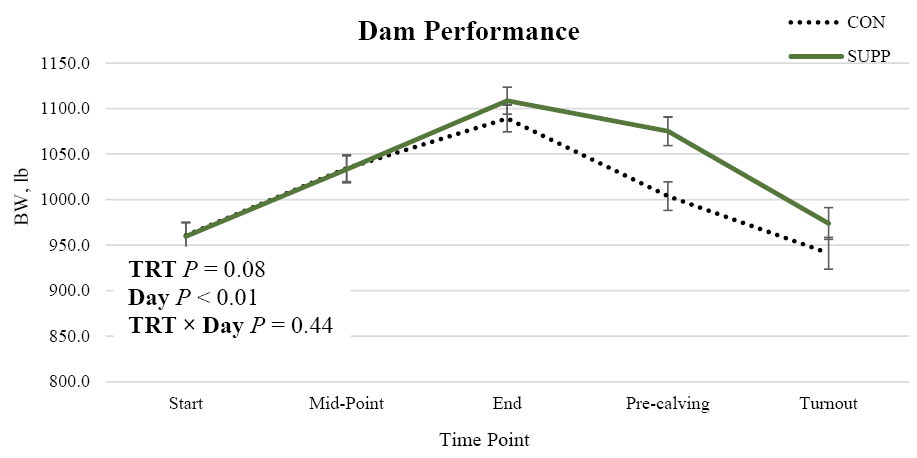
These physiological responses were accompanied by differences in subsequent maternal performance. Although a treatment by day interaction was not detected (P = 0.44), SUPP heifers tended (P = 0.08) to be heavier than CON from the end of the feeding period through pasture turn out (Figure 3). At the end of the feeding period (day ~150 of gestation), SUPP heifers were approximately 19.5 lb heavier than CON and 71.2 lb heavier than CON prior to calving. During the grazing period in midgestation, SUPP heifers tended (P = 0.07) to have a greater average daily gain (2.4 lb/d) compared with CON heifers (2.1 lb/d). Interestingly, despite body weight differences in the SUPP and CON heifers at precalving and pasture turnout, we did not observe body weight differences at birth and at pasture turnout in calves born to these dams (P ≥ 0.69). Average birth weights for calves were 72.7 and 79.1 lb for CON and SUPP, respectively, and average pasture turnout weights for calves were 154.8 and 155.2 lb, respectively.
The tendency for SUPP heifers to remain heavier after supplementation concluded suggests that the benefits associated with improved nutrient utilization and metabolic status during the fall grazing period may have persisted into late gestation and early lactation. Although subsequent reproductive performance of the dams in this study was not evaluated, entering the second breeding season at a greater BW and potentially improved nutritional status may better position young females to support the concurrent demands of lactation, continued maternal growth, and reproduction. Whether this carryover advantage ultimately translates into improved pregnancy success and long-term productivity in the herd warrants further investigation.
Conclusions
From a production standpoint, strategic protein and energy supplementation during midgestation buffered the nutritional challenges associated with declining fall forage quality and resulted in performance advantages that persisted beyond the supplementation period. Improved nutritional status and dam performance observed here may better position females for the demands of late gestation, lactation and the subsequent breeding season. Although reproductive performance was not evaluated, it is unclear whether these carryover benefits translate into improved breed-back success; however, we suspect that an improved nutritional state and body condition after calving may be associated with reproductive advantages in the next breeding season.
Funding Acknowledgements
The authors would like to thank the North Dakota Corn Utilization Council, the Ag Experiment Station Precision Agriculture Grant, Purina Animal Nutrition, and USDA-NIFA Predoctoral Fellowship #2024-67011-43015 for their funding support of this project and the personnel involved in this effort. Appreciation is also extended to the several staff and students involved in this experiment at the Central Grasslands Research Extension Center and the NDSU Nutrition Lab.
Literature Cited
Llewellyn, D. A., R. C. Cochran, T. T. Marston, D. M. Grieger, C. G. Farmer, and T. A. Wickersham. 2006. Influence of limited fall protein supplementation on performance and forage utilization by beef cattle grazing low-quality native grass pastures. Anim. Feed Sci. Tech. 127:234-250.
NASEM, 2016. Nutrient requirements of beef cattle. 8th revised ed. Washington, DC: National Academics Press.
Schauer, C., D. W. Bohnert, D. C. Ganskopp, C. J. Richards, and S. J. Falck. 2005. Influence of protein supplementation frequency on cows consuming low-quality forage: Performance, grazing behavior, and variation in supplement intake. J. Anim. Sci. 83:1715-1725.
| Table 1. Diet digestibility in bred heifers during the second trimester of pregnancy while grazing native range pastures with (n = 15) or without (n = 15) protein and energy supplementation delivered at a rate of 0.6% of BW on a DMB. | |||||||||
| Period 11 | Period 2 | ||||||||
| Treatment | Treatment | P-values4 | |||||||
| Item2 | CON | SUPP | CON | SUPP | SEM3 | TRT | Day | TRT×Day | |
| DM | |||||||||
| Forage intake, kg/d | 9.49a | 9.98a | 12.22b | 10.22a | 0.428 | 0.13 | <0.01 | 0.01 | |
| Supplement intake, kg/d | 0 a | 0a | 0a | 2.65b | 0.065 | <0.01 | <0.01 | <0.01 | |
| Total intake, kg/d | 9.49 | 9.98 | 12.22 | 12.87 | 0.449 | 0.24 | <0.01 | 0.82 | |
| Fecal output, kg/d | 5.15 | 5.22 | 7.15 | 6.87 | 0.221 | 0.71 | 0.01 | 0.17 | |
| Digestibility, % | 46.51a | 47.34a | 41.51b | 46.52a | 1.000 | 0.01 | 0.01 | 0.03 | |
| OM | |||||||||
| Forage intake, kg/d | 8.41a | 8.85a | 10.76b | 9.00a | 0.378 | 0.13 | <0.01 | 0.01 | |
| Supplement intake, kg/d | 0a | 0a | 0a | 2.54b | 0.063 | <0.01 | <0.01 | <0.01 | |
| Total intake, kg/d | 8.41 | 8.85 | 10.76 | 11.55 | 0.399 | 0.16 | <0.01 | 0.56 | |
| Fecal output, kg/d | 4.02 | 4.07 | 5.62 | 5.49 | 0.181 | 0.85 | <0.01 | 0.39 | |
| Digestibility, % | 52.69 | 53.56 | 47.83 | 52.35 | 1.054 | 0.01 | 0.01 | 0.07 | |
| NDF | |||||||||
| Forage intake, kg/d | 5.83a | 6.11a | 8.26b | 6.91c | 0.280 | 0.10 | <0.01 | 0.01 | |
| Supplement intake, kg/d | 0a | 0a | 0a | 0.74b | 0.018 | <0.01 | <0.01 | <0.01 | |
| Total intake, kg/d | 5.83a | 6.11a | 8.26b | 7.65c | 0.286 | 0.61 | <0.01 | 0.03 | |
| Fecal output, kg/d | 2.75 | 2.78 | 4.08 | 3.96 | 0.148 | 0.80 | <0.01 | 0.41 | |
| Digestibility, % | 53.27 | 54.32 | 50.65 | 48.18 | 1.110 | 0.51 | 0.01 | 0.06 | |
| ADF | |||||||||
| Forage intake, kg/d | 3.26a | 3.41a | 4.66b | 3.90c | 0.158 | 0.09 | <0.01 | 0.01 | |
| Supplement intake, kg/d | 0a | 0a | 0a | 0.22b | 0.005 | <0.01 | <0.01 | <0.01 | |
| Total intake, kg/d | 3.26a | 3.41a | 4.66b | 4.12c | 0.159 | 0.28 | <0.01 | 0.01 | |
| Fecal output, kg/d | 1.67 | 1.66 | 2.39 | 2.21 | 0.088 | 0.40 | <0.01 | 0.12 | |
| Digestibility, % | 49.05ab | 51.01a | 48.81ab | 46.27b | 1.241 | 0.80 | 0.02 | 0.03 | |
| CP | |||||||||
| Forage intake, kg/d | 0.80a | 0.85a | 0.71b | 0.59b | 0.030 | 0.35 | <0.01 | 0.01 | |
| Supplement intake, kg/d | 0a | 0a | 0 | 0.48b | 0.012 | <0.01 | <0.01 | <0.01 | |
| Total intake, kg/d | 0.80a | 0.85a | 0.71a | 1.07b | 0.034 | <0.01 | 0.01 | <0.01 | |
| Fecal output, kg/d | 0.61 | 0.62 | 0.62 | 0.63 | 0.026 | 0.74 | 0.64 | 0.74 | |
| Digestibility, % | 24.36a | 24.53a | 11.94b | 41.21c | 2.638 | <0.01 | 0.36 | <0.01 | |
1Trial 1 was conducted for 10 d from 09/11/2024 to 9/20/2024 prior to the initiation of treatments (CON, n = 15; SUPP, n = 15). Trial 2 was conducted for 10 d from 11/12/2024 to 11/21/2024 while treatments were applied. Both trials took place on a single, native range pasture and supplement delivery was controlled and limited to SUPP heifers via an electronic feeder. 2Variables evaluated included: DM, dry matter; OM, organic matter; NDF, neutral detergent fiber; ADF, acid detergent fiber; CP, crude protein; EE, ether extract. 3Standard error of the mean. 4Means within a row lacking a common superscript differ (P ≤ 0.05). | |||||||||
| Table 2. Blood metabolites in F0 pregnant beef heifers on fall pasture with grazing access (CON) or grazing access plus a protein and energy supplement (SUPP). | ||||||
| Treatment1 | P-Values4 | |||||
| Item3 | CON | SUPP | SEM2 | TRT | Day | TRT×Day |
| Glucose, mg/dL | 0.15 | 0.03 | 0.11 | |||
| Start | 48.9 | 47.6 | 2.26 | |||
| Mid-Point | 47.8 | 49.3 | 2.26 | |||
| End | 49.4 | 55.0 | 2.30 | |||
| NEFA, µmol/L | <0.01 | <0.01 | <0.01 | |||
| Start | 215.6b | 198.8bc | 19.81 | |||
| Mid-Point | 129.0d | 143.4cd | 19.46 | |||
| End | 292.6a | 196.9bc | 22.07 | |||
| BUN, mg/dL | <0.01 | <0.01 | 0.02 | |||
| Start | 15.5a | 16.4a | 0.84 | |||
| Mid-Point | 6.8d | 10.8c | 0.84 | |||
| End | 10.2c | 13.7b | 0.84 | |||
1F0 bred heifers were assigned to graze native range pasture (CON; n = 15) or graze the same native range pasture plus have access to a protein and energy supplement (SUPP; n = 15) delivered at a rate of 0.6% of BW on a dry-matter basis. Treatments were applied to the F0 dams in late September (start) through late November (end). 2Standard error of the mean. 3Metabolites evaluated included glucose, nonesterified fatty acids (NEFA) and blood urea nitrogen (BUN). 4Means lacking a common superscript differ (P ≤ 0.05). | ||||||
AS2304-13 • Influence of protein and energy supplementation during mid-gestion on beef heifers and their offspring while grazing pasture
Shelby L. Sullivan1, Jennifer L. Hurlbert1, Leticia Bortolanza Soares1,3, Roberta B.A. Dahlen1,
German Ramirez Zamudio1,3, Eva Tastad1, Kevin. K. Sedivec2, and Carl R. Dahlen1
1North Dakota State University Department of Animal Sciences, Center for Nutrition and Pregnancy, Fargo, ND, USA
2North Dakota State University, Central Grasslands Research Extension Center, Streeter, ND, USA
3University of São Paulo, São Paulo, Brazil
The objective of this study was to evaluate the effects of feeding a protein and energy supplement during mid-gestation on body weight, growth performance, body composition traits, blood metabolites, and offspring growth responses of grazing beef heifers. Heifers receiving a supplement had greater body weight gain, ribeye area, and fat measurements after the supplement period, and their offspring tended to be heavier through pasture turnout. In addition, their blood metabolite responses were consistent with improved nutrient status, indicating that strategic supplementation can help maintain heifer performance when forage quality is declining.
Summary
Maternal nutrition during gestation plays a central role in regulating dam performance, placental function, fetal development, and offspring productivity (Funston et al., 2010). The objective of this study was to evaluate the effects of protein and energy supplementation during mid-gestation on dam and offspring performance, including body weight (BW), blood metabolites, and body composition. The study was conducted at North Dakota State University’s Central Grassland Research Extension Center (CGREC) in Streeter, North Dakota. Pregnant crossbred Angus-based heifers (n = 46) each carrying a male fetus from a single artificial insemination sire were used for the study. Heifers were randomly assigned to either a control treatment (CON; n = 22) or a supplemented treatment (SUPP; n = 24). Supplemented heifers received supplement, at 0.6% of body weight (as-fed basis; dry matter adjusted), delivered individually through SmartFeed Pro trailers (C-Lock Inc., Rapid City, South Dakota), during a 90-day grazing period. Body weight and blood samples were evaluated at four intervals throughout the trial, and body composition, including rump fat, rib fat, ribeye area (REA) and intramuscular fat (IMF), was determined via ultrasound at the beginning and end of the trial. Supplemented heifers had greater final body weight than control heifers (493.8 ± 8.35 vs. 440.0 ± 7.76 kg; P < 0.0001). At the end of the trial, supplemented heifers also had more (P < 0.0001) rump fat and rib fat and greater REA than control heifers, whereas IMF did not differ. Blood results supported these performance responses, as supplemented heifers had greater (P < 0.0001) glucose and blood urea nitrogen (BUN) at selected sampling times, while control heifers had greater nonesterified fatty acids (NEFA) on day 56 of the trial and tended to remain greater on day 90. Overall, these findings indicate that protein and energy supplementation during mid-gestation can potentially improve growth, body condition and metabolic status of grazing beef heifers. Calves from supplemented dams tended to be heavier at birth, at turnout and at breeding than calves from control dams, indicating potential developmental programming effects that could persist postnatally.
Introduction
In forage-based beef production systems, maternal nutrition during gestation can influence fetal development and subsequent offspring performance (Shokrollahi et al., 2025). This issue is especially relevant at the CGREC in the Missouri Coteau region of central North Dakota, where grazing cattle rely on native mixed-grass prairie and forage quality declines as the season advances. Previous work from this region has shown that advancing season is associated with increased forage fiber and reduced nitrogen and digestibility, indicating a progressive decline in nutritive value of grazed forage (Chilcoat et al., 2016). Similarly, McCarthy et al. (2023) characterized this seasonal trajectory at CGREC by tracking forage crude protein, fiber and mineral composition across a late-summer to early-fall grazing period on native mixed prairie and relating those changes to heifer performance and supplementation responses. As the grazing season progresses, forage crude protein declines and fiber increases, which may reduce forage nutritive value enough to increase the need for supplementation in grazing cattle (McCarthy et al., 2023; Chilcoat et al., 2016). For spring calving cows in North Dakota, the late-summer to early-fall pasture quality decline overlaps with mid-gestation. Inadequate maternal nutrition at this stage is broadly understood to alter fetal development and to carry over to the calf at birth and through the early postnatal period (Shokrollahi et al., 2025).
Therefore, the objective of this study was to evaluate the effects of maternal protein and energy supplementation during midgestation on body weight, growth performance, body composition, blood metabolites and offspring outcomes of grazing beef heifers over a 90-day feeding period. We hypothesized that supplemented heifers would have greater weight gain, heavier final BW, improved body composition and blood metabolite responses consistent with improved nutrient status compared with nonsupplemented control heifers. Along with this, we also hypothesized that calves from supplemented heifers would have improved birth weight, vigor, and early postnatal growth compared to calves from nonsupplemented control heifers.
Procedures
Pregnant crossbred Angus-based heifers located at CGREC were used to evaluate a mid-gestation supplementation program. Prior to treatment assignment, all heifers were managed together under the same conditions through breeding and early gestation. A total of 150 heifers were artificially inseminated with male-sexed semen from a single sire. After pregnancy confirmation and a two-week acclimation period to SmartFeed Pro trailers, 46 heifers carrying male fetuses were assigned to either a control treatment (CON; n = 22) or a supplemented treatment (SUPP; n = 24) and grazed pasture for 90 days (d). Supplemented heifers received a pelleted protein and energy supplement at 0.6% of their BW, delivered through SmartFeed Pro trailers. The supplement was composed primarily of wheat middlings, cracked corn, DDGS ethanol and ground fine corn. Guaranteed analysis from the manufacturer indicated a minimum of 16.0% crude protein (CP) and 7.5% crude fat, with a maximum of 5.6% crude fiber, calcium ranging from 0.01 to 0.51%, and phosphorus ranging from 0.65 to 0.74%. Nutrient analysis conducted by the NDSU Nutrition Laboratory was similar, reporting 16.12% CP, 8.29% crude fat, 5.50% crude fiber, 0.07% calcium, and 0.65% phosphorus.
During the 90-day supplementation period, heifers remained at CGREC but were managed in a separate pasture from the remainder of the herd. Body weights and blood samples were collected on days 0, 27, 56 and 90 using a two-day consecutive weighing procedure, and body weight gain and average daily gain (ADG) were calculated. Forage samples were collected at three sampling intervals during the grazing period at days 0, 27 and 56 of the trial. At each interval, forage was clipped from 16 plots within the pasture to a height of 3.75 cm above ground (Undi et al., 2008), and each sample was weighed and oven dried in a forced-air oven at 60 degrees Celsius for at least 48 hours. Dried samples were ground through a 2-mm screen using a Wiley mill (Arthur H. Thomas, Philadelphia, PA). Following grinding, 5.0-gram subsamples from each of the 16 samples were combined to form one composite sample for laboratory analysis at each collection interval. Ultrasound measurements were taken at the beginning and end of the feeding period to evaluate rump fat, rib fat, ribeye area (REA) and intramuscular fat (IMF). Blood serum samples were analyzed for glucose, blood urea nitrogen (BUN) and nonesterified fatty acids (NEFA).
Following the 90-day supplementation period, all heifers were recombined with original herd and managed together through calving. Additional body weights and blood samples were collected from dams on day 263 of gestation. Calf body weights were recorded at calving (n = 41) and again at pasture turnout (approximately 2 months of age) and at dam breeding (approximately 3 months of age) to assess early offspring performance associated with dam treatment. After calving, all cow-calf pairs were managed together as a single group until pasture turnout at day 59 postpartum (PP), body weights and blood samples were collected from dams, and body weights were collected from calves.
Statistical Analysis
Data were analyzed using SAS 9.4 (SAS Inst. Inc., Cary, NC). For heifer variables, the individual heifer served as the experimental unit. Blood metabolite data were analyzed using the MIXED procedure of SAS with treatment, collection day, and the treatment × day interaction included as fixed effects. Day was treated as a repeated measure, with heifer ID as the subject and an autoregressive covariance structure [AR(1)] applied. For calf BW data, the individual calf served as the experimental unit. Calf BW was analyzed using the MIXED procedure with dam treatment, day, and the dam treatment × day interaction as fixed effects, and day treated as a repeated measure with calf ID as the subject. Denominator degrees of freedom were adjusted using the Kenward-Roger method. Results are presented as least squares means (LSMEANS) with standard error (SE). Significance was declared at P ≤ 0.05 and tendencies at 0.05 ≤ P ≤ 0.10.
Results and Discussion
Forage composition of composite pasture samples indicated changes in nutritional value across the grazing period (Table 1). Total digestible nutrients (TDN) remained relatively stable, ranging from 60.5 to 62.0%. However, crude protein (CP) declined from 9.02% in September to 7.1% in October and 6.8% in November. Neutral detergent fiber (NDF) and acid detergent fiber (ADF) were lowest in October (59.1% and 34.1% respectively), suggesting greater intake potential and digestibility in October than in September or November. In contrast, the lower CP concentration observed in November indicates that forage quality declined later in the grazing season.
Heifer body weight was impacted by a treatment × day interaction (Figure 1). Though similar at the initiation of treatments, (416.7 ± 73 vs. 426.7 ± 7.84 kg for CON and SUPP, respectively) the SUPP heifers became heavier by the end of the feeding period compared with CON heifers (493.8 ± 8.35 vs. 440.0 ± 7.76 kg; P < 0.0001). Average daily gain over the feeding period was greater for SUPP than CON heifers (0.73 ± 0.03 vs. 0.24 ± 0.03 kg/day; adjusted P < 0.0001). Daily gain over each of the individual periods showed a similar pattern: gains did not differ from day 0 to 27 (1.14 vs 1.02 kg/d; P = 0.2041), but SUPP heifers gained more during each of the weight intervals through the end of the experiment. Interestingly, during the period from day 57 to 90, CON heifers lost weight whereas SUPP heifers maintained a slight gain (0.09 vs. -0.64 kg/d; P < 0.0001). These results suggest supplementation became more important as the trial progressed and pasture conditions became less favorable.
Ultrasound measurements also indicated that body composition changed through the feeding period (Table 2). At the end of the trial, SUPP heifers had greater rump fat (1.93 ± 0.14 vs. 1.16 ± 0.11 cm; P < 0.001), rib fat (1.22 ± 0.07 vs. 0.81 ± 0.05 cm; P < 0.0001), and REA (67.35 ± 1.81 vs. 55.10 ± 1.42 cm2; P < 0.001) than CON heifers, whereas IMF did not differ (5.18 ± 0.24 vs. 5.64 ± 0.16 %; P = 0.113). Changes over the feeding period followed the same pattern. Together, these results suggest that supplementation results in greater deposition of muscle and external fat during the study period, while IMF was not affected.
Blood metabolite responses were affected by treatment × day interactions for glucose, BUN, and NEFA (Figure 2). Glucose concentrations were greater in SUPP than CON heifers on day 27 (64.0 vs. 58.9 mg/dL; P = 0.025) and day 56 (65.5 vs 55.2 mg/dL; P < 0.0001) but did not differ on day 0 or 90 of the trial nor day 263 of gestation. Likewise, BUN concentrations were greater in SUPP than CON heifers on day 27 (11.4 vs. 7.2 mg/dL; P < 0.0001), day 56 (17.6 vs. 12.8 mg/dL; P < 0.0001), and day 90 (15.7 vs. 10.3 mg/dL; P < 0.0001), with no differences on day 0 of trial or day 263 of gestation. In contrast, NEFA concentrations were greater in CON than SUPP heifers on day 56 (408.4 vs. 189.9 mEq/L; P < 0.0001) and day 90 (622.4 vs. 529.0 mEq/L; P = 0.13) but did not differ on day 0 or 27 of trial nor 263 of gestation. These blood metabolite results suggest supplemented heifers were in a more favorable nutritional state during the trial, which is consistent with their improved BW gain and body composition.
Calf BW was not affected by dam treatment × day interaction (P = 0.35). Calf BW tended to be greater for calves born to SUPP dams than calves born to CON dams (P = 0.06). Across all calves, average BW was 34.7 kg at birth, 85.3 kg at turnout and 130.3 kg at breeding. Numerically, calves from supplemented dams were heavier at each time point, averaging 35.5 kg to 34.06 kg at birth, 87.99 kg to 82.70 kg at pasture turnout and 134.62 kg to 126.02 kg at mid-summer for SUPP and CON dams. These results suggest that maternal protein and energy supplementation during mid-gestation may have slightly improved early calf growth, but further post-natal evaluations are needed to confirm whether body weight changes persist toward sexual maturity.
Conclusion
Overall, these results suggest that protein and energy supplementation during mid-gestation helps grazing beef heifers maintain growth, body condition, and muscle area when pasture quality is declining. Supplemented heifers finished the trial heavier, had greater ADG, and showed greater rump fat, rib fat, and REA than CON heifers, while IMF did not differ between treatments. Blood metabolite responses supported this interpretation, indicating that SUPP heifers were in a more favorable nutritional state during the trial. In addition, calves born to SUPP dams tended to be heavier through pasture turnout and mid-summer than calves born to CON dams. Together, these findings suggest that strategic supplementation during mid-gestation may be a useful management practice for producers when forage alone does not meet nutrient requirements and that impacts may extend into the postnatal period for calves gestated in this paradigm.
References
Chilcoat, K. E., M. S. Crouse, B. W. Neville, and J. S. Caton. 2016. effects of grazing intensity and advancing season on dietary chemical composition and in vitro organic matter digestibility in steers grazing mixed-grass prairie. J. Anim. Sci. 87:375–383.
Funston, R.N., Martin, J.L., Adams, D.C., & Larson, D.M. (2010). Winter grazing system and supplementation of beef cows during late gestation: Effects on progeny performance. J. Anim. Sci. 88:4094–4101.
McCarthy, K. L., S. R. Underdahl, M. Undi, and C. R. Dahlen. 2023. Using precision tools to manage and evaluate the effects of mineral and protein/energy supplements fed to grazing beef heifers. Transl. Anim. Sci. 7:txad013.
Shokrollahi, B., M. Park, G. S. Jang, S. Jin, S. J. Moon, K. H. Um, S. S. Jang, and Y. C. Baek. 2025. Maternal overnutrition in beef cattle: effects on fetal programming, metabolic health, and postnatal outcomes. Biology (Basel). 14:14060645.
Undi, M., C. Wilson, K. H. Ominski, K. M. Wittenberg, and K. Wittenberg. 2008. Comparison of techniques for estimation of forage dry matter intake by grazing beef cattle. Can. J. Anim. Sci. 88:693-701.
Table 1. Forage analysis of representative sample composites of pasture grazed by beef heifers during the grazing period.1, 4
| Item | Grazing period2 | ||
|---|---|---|---|
| September | October | November | |
| 1Clipped forage samples from 16 different locations reported herein are composite over all locations within the representative sampling dates. 2Values presented are mean values of the representative sampling dates within the given month: September (n = 1), October (n = 1), and November (n = 1). 3TDN = 88.9 – (0.79 × ADF%); Holland and Kezar, 1995 4SUPP = heifers grazing pasture receiving protein and energy supplementation; CON = heifers grazing pasture without supplementation. | |||
| TDN3 | 54.39 | 51.96 | 53.50 |
| CP, % | 8.80 | 6.90 | 8.11 |
| Ash | 10.57 | 10.72 | 11.00 |
| NDF, % | 67.16 | 74.25 | 72.54 |
| ADF, % | 43.68 | 46.76 | 44.81 |
| Ca, % | 0.51 | 0.43 | 0.48 |
| P, % | 0.10 | 0.08 | 0.10 |
| S, % | 0.33 | 0.29 | 0.31 |
| N, % | 1.41 | 1.10 | 1.30 |
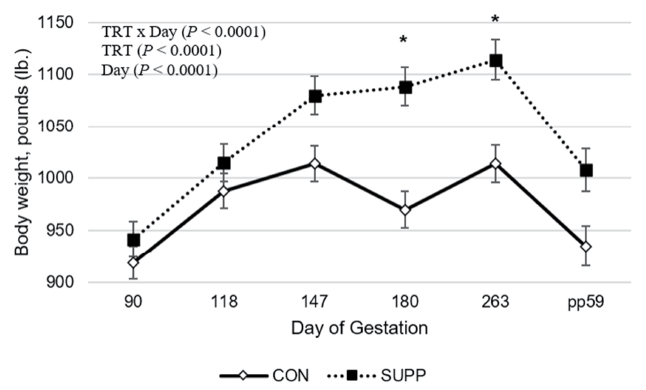
| Table 2. Ultrasound body composition characteristics at the beginning and end of the 90-day feeding period. | ||||
| Item | Treatment1 | SEM | P-value | |
| CON | SUPP | |||
| Rump fat, in | ||||
| Beginning | 0.19 | 0.20 | 0.02 | 0.5398 |
| End | 0.18 | 0.31 | 0.02 | 0.0001 |
| Change2 | -0.002 | 0.109 | 0.01 | <0.0001 |
| Rib fat, in | ||||
| Beginning | 0.14 | 0.14 | 0.01 | 0.9988 |
| End | 0.13 | 0.19 | 0.01 | <0.0001 |
| Change | -0.018 | 0.049 | 0.009 | <0.0001 |
| REA, in2 | ||||
| Beginning | 9.46 | 9.33 | 1.71 | 0.726 |
| End | 8.45 | 10.41 | 1.80 | <0.0001 |
| Change | -1.018 | 1.074 | 1.07 | <0.0001 |
| IMF, % | ||||
| Beginning | 4.89 | 4.81 | 0.19 | 0.7655 |
| End | 5.58 | 5.23 | 0.209 | 0.2568 |
| Change | 0.686 | 0.426 | 0.148 | 0.2221 |
| 1Treatment 2Change = measurement at end of experiment – measurement at beginning of experiment | ||||
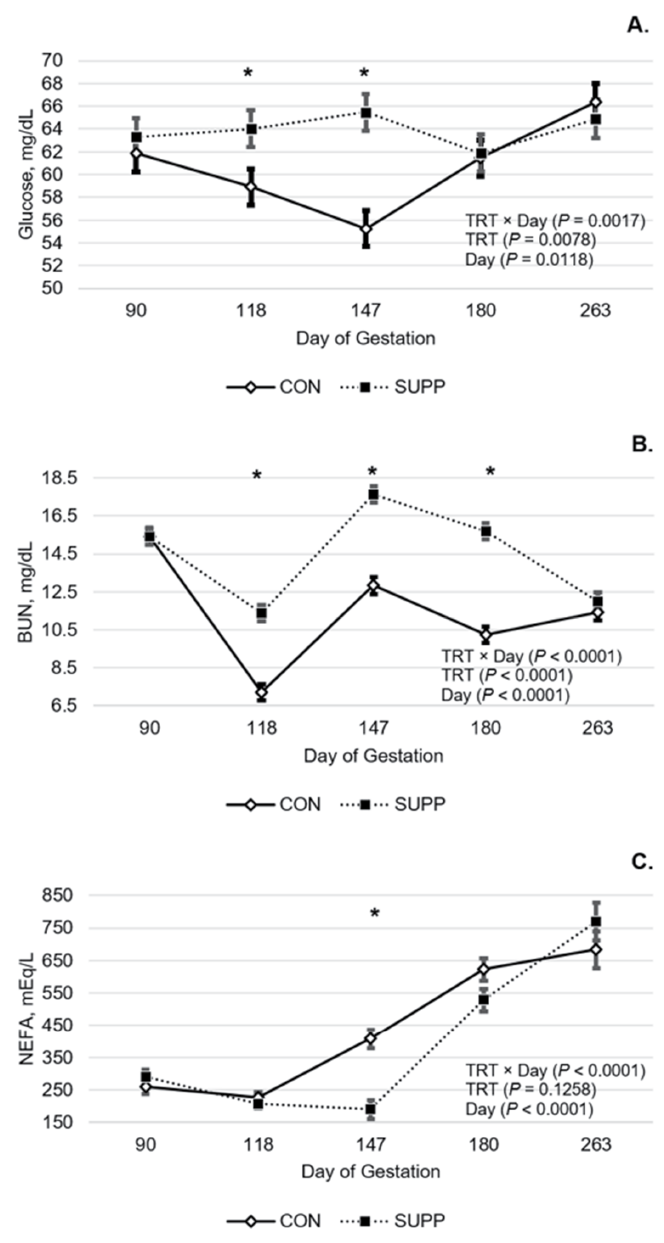
Reproductive Physiology
AS2304-15 • Placental vascular development, cellular proliferation and angiogenic factor expression in beef heifers throughout gestation
Chutikun Kanjanaruch1, Bethania J. Dávila Ruiz1, Jennifer L. Hurlbert1, Kyle J. McLean2,
Matthew S. Crouse٣, Kacie L. McCarthy٤, Friederike Baumgaertner1, Joel S. Caton1, Pawel P. Borowicz١,
Carl R. Dahlen1 and Lawrence P. Reynolds1
١Department of Animal Sciences and Center for Nutrition and Pregnancy, North Dakota State University, Fargo, ND, USA
٢University of Tennessee, Knoxville, TN ٣٧٩٩٦
٣USDA, ARS, U.S. Meat Animal Research Center, Clay Center, NE 68933, USA.
٤Department of Animal Sciences, University of Nebraska-Lincoln, Lincoln, NE 68588, USA
The objective of this study was to characterize placental vascular development, cellular proliferation and angiogenic factor expression throughout gestation in beef heifers. Distinct expression patterns of VEGFR1 and VEGFR2 suggest complementary roles in maternal and fetal placental vascular development. These findings provide a baseline for future studies evaluating the effects of maternal nutrition and management on placental function and fetal growth.
Summary
Placental vascular development is essential for fetal growth, but the temporal regulation of angiogenic signaling throughout gestation in beef cattle is not well understood. Therefore, the objective of this study was to characterize placental vascular development, cellular proliferation and angiogenic factor expression throughout gestation in beef heifers. Placentomes were collected from 80 primiparous crossbred Angus beef heifers at 10 gestational stages (days 34, 50, 63, 83, 161, 181, 250, 260, 272 and parturition). Immunofluorescence was used to evaluate vascular development (CD31 and CD34), cellular proliferation (Ki67), and angiogenic and vasoactive factors (VEGF, VEGFR1, VEGFR2, endothelial nitric oxide synthase (eNOS) and soluble guanylyl cyclase [sGC]). Capillary area density (CAD), capillary number density (CND) and protein expression were quantified in the maternal caruncle (CAR) and fetal cotyledon (COT). Placental vascularity increased throughout gestation, with CAD increasing from 1.00 ± 0.77% to 12.47 ± 0.61% in the COT and from 3.76 ± 0.77% to 8.62 ± 0.61% in the CAR (P < 0.01). Cellular proliferation also increased during gestation and remained greater in the CAR than the COT during late pregnancy. Expression of eNOS increased during early to midgestation before declining during late gestation, whereas sGC expression was highest during early gestation and increased again near term. Distinct regional differences were observed in VEGF receptor expression, with VEGFR1 predominating in the maternal CAR and VEGFR2 in the fetal COT. Strong VEGF immunostaining was also observed in binucleate giant cells (BNGCs), suggesting a potential role in placental angiogenesis and maternal-fetal communication. Overall, placental vascular development, endothelial proliferation and angiogenic signaling changed dynamically throughout gestation, providing baseline information for future studies evaluating placental function, maternal nutrition and fetal growth in beef cattle. Observed in VEGF receptor expression. VEGFR1 was greater in the maternal CAR, particularly at days 63 and 181 (P < 0.01), whereas VEGFR2 was greater in the fetal COT, peaking at day 83 and remaining elevated during late gestation. In conclusion, placental vascular development, endothelial proliferation and angiogenic signaling changed dynamically throughout gestation. VEGFR1 predominated in maternal placental tissue, whereas VEGFR2 predominated in fetal placental tissue, and strong VEGF expression in binucleate giant cells (BNGCs) suggests these specialized trophoblasts cells may contribute to placental angiogenesis and maternal-fetal communication.
Introduction
The placenta is a transient but highly specialized organ that supports fetal growth by facilitating the exchange of oxygen, nutrients and metabolic waste between the maternal and fetal circulations (Reynolds and Redmer, 2001). As gestation progresses, placental vascular development must increase to meet the growing metabolic demands of the fetus. In ruminants, the placentome, composed of the maternal caruncle (CAR) and fetal cotyledon (COT), is the primary site of maternal-fetal exchange; therefore, proper vascular development is essential for placental function, fetal growth and pregnancy success (Borowicz et al., 2007). Placental vascular development is regulated through coordinated processes of angiogenesis and cellular proliferation. Endothelial cell markers CD31 and CD34 are widely used to identify placental capillaries and quantify vascular development, whereas Ki67 is a reliable marker of cellular proliferation (Scholzen and Gerdes, 2000). Angiogenesis is primarily regulated by vascular endothelial growth factor (VEGF) and its receptors, VEGFR1 and VEGFR2, while placental vascular function is further controlled by the nitric oxide pathway through endothelial nitric oxide synthase (eNOS) and soluble guanylyl cyclase (sGC), which regulate placental blood flow (Reynolds and Redmer, 2001). Although placental vascular development has been extensively studied in sheep, relatively little information is available regarding placental vascularity, cellular proliferation and angiogenic factor expression throughout gestation in beef cattle. Therefore, the objective of this study was to characterize placental vascular development, cellular proliferation and the expression of key angiogenic and vasoactive factors throughout gestation in beef heifers, providing a baseline for future studies of placental function, fetal growth and maternal nutrition.
Procedures
The study included 80 pregnant crossbred Angus beef heifers managed at the North Dakota State University Beef Cattle Research Complex. Placental tissues were collected throughout gestation (approximately 280 days) on days 34 (n = 5), 50 (n = 5), 63 (n = 8), 83 (n = 8), 161 (n = 7), 181 (n = 10), 250 (n = 7), 260 (n = 9), 272 (n = 8) and at parturition (n = 13). At tissue collection, fetal and placental weights were recorded, and placentomes were dissected for histological evaluation. Placentomes were fixed in 10% neutral-buffered formalin, embedded in paraffin, sectioned at 5 μm and mounted on microscope slides. Tissue sections were stained using immunofluorescence to evaluate placental vascular development, cellular proliferation and angiogenic factor expression. Endothelial cells were identified using CD31 and CD34. Cellular proliferation was assessed using the nuclear proliferation marker Ki67. Angiogenic and vasoactive proteins evaluated included VEGF red1, VEGFR1, VEGFR2, eNOS and sGC. Images were captured using a Mica Microhub fluorescence microscope (Leica Microsystems Inc., Buffalo Grove, Illinois), and quantitative image analysis was performed using Image-Pro Premier software (Version 9.0.1; Media Cybernetics, Inc., Silver Spring, MD). Capillary area density (CAD) and capillary number density (CND) were measured separately in the fetal cotyledon (COT) and maternal caruncle (CAR) of each placentome. Protein expression and Ki67 labeling index were quantified as the percentage of positively stained areas within each region. Data was analyzed using the PROC GLM and PROC REG procedures of SAS (Version 9.4; SAS Institute Inc., Cary, NC). Differences among days of gestational and placental regions were considered statistically significant at P ≤ 0.05, with P ≤ 0.01 indicating stronger statistical evidence,and regression analyses were performed to characterize changes in placental vascularity and angiogenic factor expression throughout gestation.
Results and Discussion
Placental and fetal weights increased throughout gestation, following a sigmoidal (S-shaped) growth pattern characterized by slow early growth, rapid mid-gestation growth, and leveling off near term, with excellent model fit (placental weight, R² = 0.9388; fetal weight, R² = 0.9827; Figure 1). Placental growth occurred earlier and increased gradually, whereas fetal growth accelerated after approximately day 160. This pattern indicates that placental development precedes rapid fetal growth, increasing the capacity for nutrient and oxygen exchange. Similar growth patterns have been reported in sheep and other ruminants (Reynolds and Redmer, 2001; Reynolds et al., 2005).
During early gestation (days 34-83), CAD was greater in the CAR than in the COT (P < 0.05), whereas by late gestation (days 250-272), both CAD and CND were greater in the COT (P < 0.01; Table 1). Capillary area density increased approximately 12-fold in the COT compared with 2.3-fold in the CAR, while CND increased more than 11-fold in the COT and 4-fold in the CAR. Cellular proliferation (Ki67) also increased throughout gestation and was greater in the CAR from days 63 to 272 (P < 0.05), indicating continued maternal placental remodeling. Together, these findings demonstrate a developmental shift from the maternal placenta during early gestation to rapid fetal placental vascular expansion during late gestation, supporting the increasing nutrient demands of fetal growth (Reynolds et al., 2023).
In the COT, eNOS expression increased from 14.08 ± 4.02% on day 34 to 22.31 ± 3.68% on day 181 before declining during late gestation (P ≤ 0.01; Figure 2). In contrast, sGC expression was highest during early gestation (35.09 ± 10.34% on day 34), decreased during midgestational and increased again near term (15.60 ± 4.27% on day 272), indicating dynamic regulation of nitric oxide signaling. VEGF was expressed throughout gestation in both placental regions, with particularly strong immunostaining in binucleate giant cells (BNGCs). Because BNGCs are specialized trophoblast cells involved in placental development and maternal-fetal communication (Klisch and Leiser, 2003), their strong VEGF expression suggests a role in placental angiogenesis and vascular remodeling, consistent with the established roles of VEGF and nitric oxide signaling in placental vascular function (Reynolds and Redmer, 2001).
As shown in Figure 3, VEGFR1 and VEGFR2 exhibited distinct regional expression patterns. VEGFR1 expression was greater in the maternal CAR than in the fetal COT, particularly at days 63 and 181 (P < 0.01). In contrast, VEGFR2 predominated in the fetal COT, peaking at day 83 (35.50 ± 8.17%) and remaining elevated during late gestation (P < 0.01). Because VEGFR2 is the primary receptor mediating VEGF-induced angiogenesis, whereas VEGFR1 regulates VEGF signaling and vascular organization, these expression patterns suggest active angiogenesis in the fetal placenta and vascular stabilization in the maternal placenta, consistent with previous reports in ruminants (Reynolds and Redmer, 2001).
Overall, placental vascular development, endothelial proliferation and angiogenic signaling changed dynamically throughout gestation. A developmental shift from the maternal caruncle during early gestation to the fetal cotyledon during mid- and late gestation was accompanied by predominant VEGFR1 expression in the maternal placenta and VEGFR2 expression in the fetal placenta. Strong VEGF expression in binucleate giant cells further suggests that these specialized trophoblast cells may contribute to placental angiogenesis and maternal-fetal communication.
Acknowledgments
This research was supported by the USDA National Institute of Food and Agriculture through Grant Nos. 2021-67015-34277 (L.P. Reynolds), 2021-67016-33389, and 2022-67016-36479.
Literature Cited
Borowicz, P. P., D. R. Arnold, M. L. Johnson, A. T. Grazul-Bilska, D. A. Redmer, and L. P. Reynolds. 2007. Placental growth throughout the last two-thirds of pregnancy in sheep: Vascular development and angiogenic factor expression. Biol. Reprod. 76:259–267.
Klisch, K., and R. Leiser. 2003. In bovine binucleate trophoblast giant cells, pregnancy-associated glycoproteins and placental prolactin-related protein-I are conjugated to asparagine-linked N-acetylgalactosaminyl glycans. Histochem. Cell Biol. 119:211–217.
Reynolds, L. P., P. P. Borowicz, D. R. Dahlen, A. K. Ward, M. S. Crouse, B. J. Dávila-Ruiz, C. Kanjanaruch, K. J. McLean, K. L. McCarthy, A. C. B. Menezes, W. J. S. Diniz, R. A. Cushman, and J. S. Caton. 2023. Role of the placenta in developmental programming: Observations from models using large animals. Anim. Reprod. Sci. 257:107322.
Reynolds, L. P., and D. A. Redmer. 2001. Angiogenesis in the placenta. Biol. Reprod. 64:1033–1040.
Scholzen, T., and J. Gerdes. 2000. The Ki-67 protein: From the known and the unknown. J. Cell. Physiol. 182:311–322.
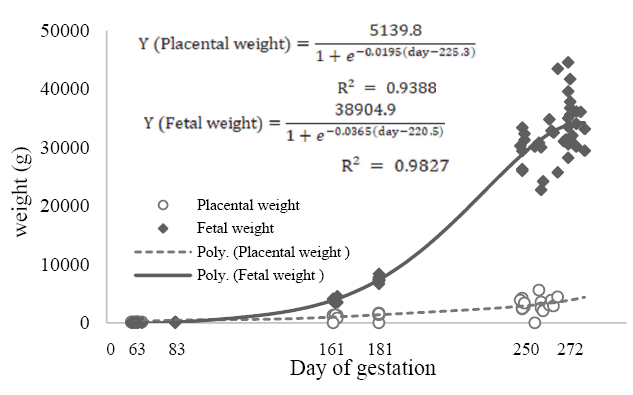
Table 1. Changes in placental vascularity and cellular proliferation throughout gestation.
| Measurement | Days of gestation | Region1 | P-value2 of region | |
| COT | CAR | |||
(CD31&CD34) Capillary Area Density, % | 34 | 1.003 ± 0.768 | 3.757 ± 0.768 | 0.0007 |
| 50 | 2.223 ± 0.768 | 5.244 ± 0.768 | 0.0002 | |
| 63 | 3.505 ± 0.701 | 6.438 ± 0.701 | <0.0001 | |
| 83 | 5.546 ± 0.701 | 7.079 ± 0.701 | 0.0352 | |
| 161 | 7.955 ± 0.649 | 7.349 ± 0.649 | 0.3639 | |
| 181 | 8.521 ± 0.543 | 7.518 ± 0.543 | 0.0741 | |
| 250 | 11.528 ± 0.649 | 8.373 ± 0.649 | <0.0001 | |
| 260 | 12.021 ± 0.551 | 8.541 ± 0.574 | <0.0001 | |
| 272 | 12.466 ± 0.607 | 8.623 ± 0.607 | <0.0001 | |
| Parturition | 18.275 ± 0.716 | N/A | ||
(CD31&CD34) Capillary Number Density, % | 34 | 0.055 ± 0.034 | 0.081 ± 0.034 | 0.4870 |
| 50 | 0.068 ± 0.031 | 0.184 ± 0.031 | 0.0022 | |
| 63 | 0.097 ± 0.031 | 0.211 ± 0.031 | 0.0010 | |
| 83 | 0.123 ± 0.029 | 0.231 ± 0.029 | 0.0017 | |
| 161 | 0.231 ± 0.024 | 0.265 ± 0.024 | 0.2782 | |
| 181 | 0.260 ± 0.029 | 0.276 ± 0.029 | 0.5349 | |
| 250 | 0.512 ± 0.027 | 0.323 ± 0.027 | <0.0001 | |
| 260 | 0.598 ± 0.049 | 0.328 ± 0.032 | <0.0001 | |
| 272 | 0.618 ± 0.021 | 0.319 ± 0.021 | <0.0001 | |
| Parturition | 0.419 ± 0.02 | N/A | ||
| Ki-67 (%Li) | 34 | 3.302 ± 3.751 | 6.391 ± 3.751 | 0.5618 |
| 50 | 14.999 ± 3.751 | 18.991 ± 3.751 | 0.4536 | |
| 63 | 16.434 ± 3.424 | 34.649 ± 3.424 | 0.0003 | |
| 83 | 21.646 ± 3.424 | 41.611 ± 3.424 | <0.0001 | |
| 161 | 27.527 ± 3.424 | 50.220 ± 3.424 | <0.0001 | |
| 181 | 29.222 ± 2.652 | 54.482 ± 2.652 | <0.0001 | |
| 250 | 38.352 ± 3.170 | 59.265 ± 3.170 | <0.0001 | |
| 260 | 32.487 ± 2.145 | 41.528 ± 2.458 | <0.0001 | |
| 272 | 27.958 ± 2.965 | 36.847 ± 2.965 | 0.0368 | |
1CAR = caruncle; COT = cotyledon;
2P-values in bold indicate significant differences between COT and CAR.
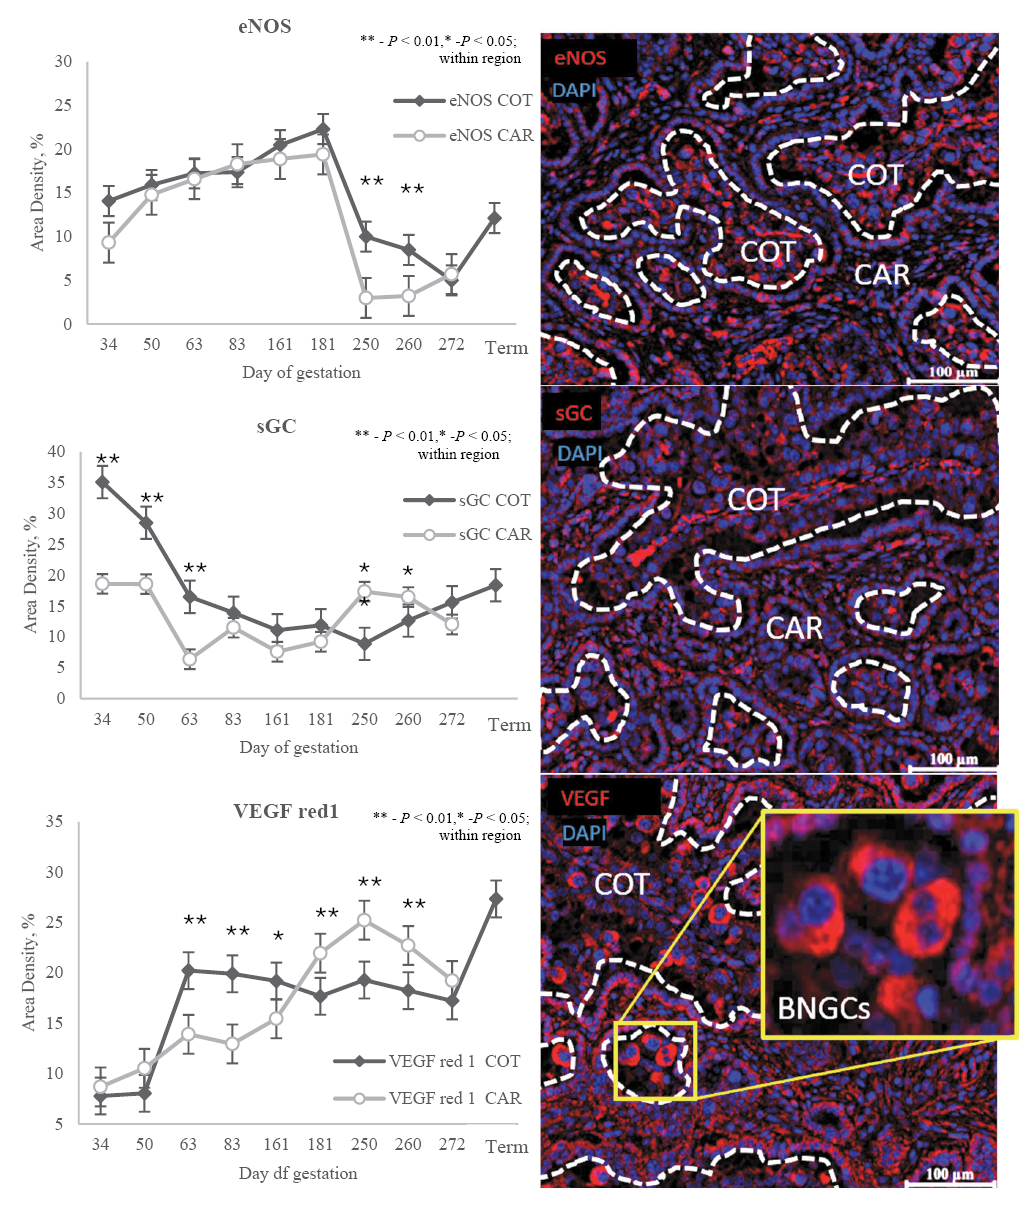
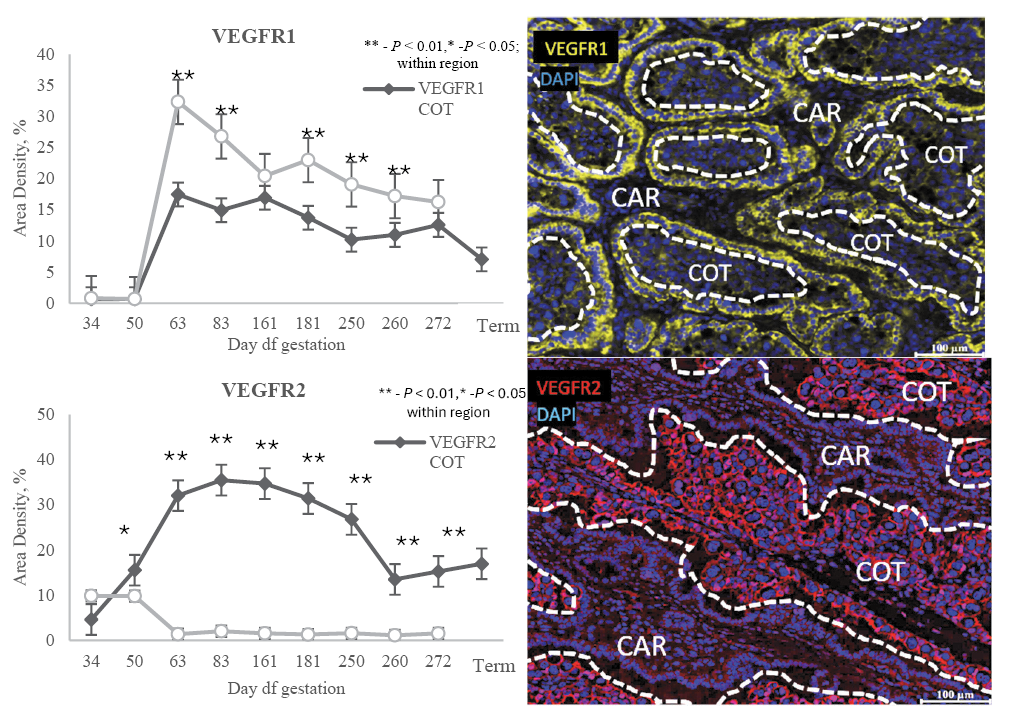
Swine
AS2304-16 • The effects of oxidizing air purification on swine barn air quality and pig health, performance, and behavior during the farrowing phase of production
Keara J. Leong-Machielse1, Jennifer M. Young1, Xiaoyu Feng2, Samat Amat1 and Christopher J. Byrd1
1Department of Animal Sciences, North Dakota State University, Fargo, ND
2Department of Agricultural and Biosystems Engineering, North Dakota State University, Fargo, ND
Oxidizing air purification (OAP) technology did not affect air quality parameters in a commercial-like sow nursing environment. However, OAP did differentially affect piglet performance and behavior. More work is needed to determine whether OAP has meaningful beneficial effects on pig health, performance, and welfare.
Summary
This study investigated the effects of a novel oxidizing air purification (OAP) technology on swine barn air quality and piglet performance and behavior during the farrowing (i.e., nursing) phase of production. Shortly before farrowing, sows were randomly assigned to a room that contained two OAP mobile units or a room that did not. Concentrations of particulate matter size 10 microns or smaller (PM10), ammonia (NH3) and hydrogen sulfide (H2S) were measured weekly. Piglets were weighed every six days during the farrowing phase to determine body weights and average daily gain (ADG). Piglet behavior was evaluated from video recorded throughout the experimental period. Particulate matter, NH3 and H2S were not significantly different between the OAP and control rooms. Despite air quality parameters not being different, piglets exposed to OAP spent more time nursing on days 1 and 10 of age. Control piglets tended to be heavier at weaning than OAP piglets. These results suggest that OAP may affect pig welfare, as indicated by some differences in behavior and performance, but the mechanism is not clear. Further work is needed to fully elucidate the effect of OAP on piglet health, performance and behavior.
Introduction
Particulate matter (i.e., dust), ammonia (NH3) and hydrogen sulfide (H2S) present in air at high concentrations have the potential to negatively affect pig health, performance and welfare. Therefore, mitigation of these contaminants is important to the swine industry. The most common method of managing air quality in swine facilities is ventilation; however, none of the widely used ventilation systems provide full control over the environmental air quality of the barn. Several supplemental strategies for improving indoor air quality have been developed and tested, but their use is not widespread, and concerns about particulate matter and gas emission exposures within swine facilities remain. Therefore, there is a need to identify novel strategies to mitigate indoor air quality challenges.
One potential alternative method is oxidizing air purification (OAP) technology, which uses ozone to oxidize and reduce common air-quality emissions of concern. Early studies have shown ozone to be effective at reducing indoor gas emissions (Priem, 1977; Elenbaas-Thomas et al., 2005; Banhazi, 2011); however, humans and animals cannot be directly exposed to ozone without risk to their health. The OAP technology used in this study (CerroZone Mobile Units; now owned and marketed by Micron Pure, LLC.; St. Louis, MO) mitigates this issue by utilizing a closed purification environment to perform the following: 1) intake room air, 2) convert the oxygen contained within room air to ozone, 3) allow ozone to oxidize and remove pathogens and volatile compounds of concern from the air, and 4) exhaust the purified air back into the barn. The objective of this study was to evaluate the use of OAP on swine barn air quality and swine welfare, as indicated by performance and behavior traits.
Procedures
Animals were housed in the farrowing rooms at the NDSU Swine Research and Teaching Center. This study took place during two repeated trials (i.e., one winter trial and one summer trial). In trial one (winter), sows were randomly assigned to the OAP treatment farrowing room (n = 4 sows) or the control treatment farrowing room (n = 5 sows). In trial two (summer), three sows were randomly assigned to each treatment room. Oxidizing air purification mobile units were powered on in the OAP treatment rooms when sows entered the rooms. Environmental air samples were collected on days 0 (when sows entered the farrowing rooms), 7, 14, 21, and 28 to analyze for NH3 and H2S. Particulate matter (PM10) was collected on the same days. During lactation, piglets were weighed every six days to calculate average daily gain (ADG). Video cameras positioned above each gestation stall recorded piglet behavior. Six hours of behavioral data (0800-1000, 1100-1300, 1400-1600 h) when piglets were one, two, three, seven, 10, and 14 days of age were analyzed for nursing duration and frequency and postural traits of lying, standing and sitting. Piglets were weaned at 23.7 ± 4.8 days of age.
Results and Discussion
Environmental air quality parameters were not significantly different between treatments on any day; however, NH3 and PM10 tended to be higher on day 14 in the OAP rooms compared to the control rooms (Table 1). The lack of differences between rooms may be due to the low concentrations of each parameter already present in the farrowing rooms compared with those typically observed in large commercial facilities. A repeated trial effect was observed for NH3 and H2S, with NH3 concentration being lower during the summer trial compared to the winter trial (0.70 ± 0.80 ppm vs. 10.07 ± 0.80 ppm; P < 0.0001) and H2S concentration being lower during the summer trial compared to the winter trial (0.04 ± 0.02 ppm vs. 0.15 ± 0.02 ppm; P = 0.0005). These repeated-trial effects were expected, given the likelihood of increased NH3 and H2S concentrations during winter months when ventilation within the barn is minimized to maintain acceptable room temperature.
Although no meaningful differences in air quality between treatment rooms were observed, we did identify differences in piglet behavior and performance between treatments. Piglets exposed to OAP spent more time nursing on days 1 and 10 of age (Figure 1; P = 0.01 and 0.01, respectively) and tended to spend more time nursing on days 2, 7, and 14 of age (P = 0.06, 0.09, and 0.07, respectively). This resulted in OAP piglets spending more time nursing compared to control piglets overall (126.1 ± 13.1 min vs. 77.6 ± 11.7 min; P = 0.007). For nursing frequency, OAP piglets nursed more frequently than control piglets (8.48 ± 1.00 vs. 5.56 ± 0.98; P = 0.04), which was largely driven by OAP piglets performing more nursing bouts at one day of age compared to control piglets (11.6 ± 1.8 vs. 5.4 ± 1.7 bouts; P = 0.01).
Effective nursing during the first 24-48 hours postfarrowing is required for ensuring adequate piglet colostrum intake. The nursing results presented here provide some evidence that OAP improved piglets’ ability to nurse during this critical period, which may have future immunity and health benefits. However, regardless of increased OAP piglet nursing duration and frequency during this period, control piglets tended to be heavier than OAP treatment piglets at weaning (Figure 2; P = 0.07) and tended to have greater overall ADG compared to OAP piglets (0.72 ± 0.03 vs. 0.63 ± 0.04 lb/d; P = 0.097).
Postural data is presented in Table 2. No main treatment effects were observed for lying (P = 0.58) or standing (P = 0.68). However, there was a tendency for increased lying exhibited by control pigs compared to OAP pigs at 10 days of age (P = 0.09). No treatment differences for standing were observed at any time point (P > 0.10). There was a main effect of treatment on the percentage of piglets sitting per day (P = 0.0003), with OAP piglets exhibiting a greater percentage of sitting per day compared to CON-f piglets (3.20 ± 0.27 vs. 1.79 ± 0.29). This result was largely driven by OAP piglets exhibiting greater sitting percentages at one and three days of age (P = 0.0006 and 0.04, respectively) and tending to exhibit a greater sitting percentage at 14 days of age (P = 0.053) compared to control piglets. The increased sitting behavior performed by OAP piglets on days 1 and 3 may be related to common postural changes associated with nursing duration and frequency, which were also increased in the OAP treatment. However, more work is needed to confirm this potential interpretation.
Conclusion
In conclusion, oxidizing air purification (OAP) did not affect air quality parameters in a commercial-like sow nursing environment. However, OAP did differentially affect piglet performance and behavior. Continuing work in this area will evaluate the effect of OAP on pig health, as well as the environmental and pig microbiomes.
Acknowledgments
Funding for this project was provided by the North Dakota Agricultural Experiment Station and the North Dakota State Board of Agricultural Research and Education. We thank Micron Pure LLC, Univox LLC, and CerroZone LLC for their technical assistance and for lending the oxidizing air purification mobile units. We also thank Megan Kavanagh, staff, and students at the NDSU Swine Research and Teaching Center for their assistance during this project.
Literature Cited
Banhazi, T. 2011. Treatment of airborne pollutants in livestock buildings with ozone as potential abatement option. Aust. J. Multi-Discip. Eng. 8:147–156.
Elenbaas-Thomas, A. M., L. Y. Zhao, Y. Hyun, X. Wang, B. Anderson, G. L. Riskowski, M. Ellis, and A. J. Heber. 2005. Effects of room ozonation on air quality and pig performance. Trans. ASAE. 48:1167–1173.
Priem, R. 1977. Deodorization by means of ozone. Agric. Environ. 3:229–237.
| Table 1. Least squares means for air quality parameters by treatment (oxidizing air purification [OAP] and control) and day of study (day 0 is when sows were moved into farrowing). | |||||
| Trait | Day | OAP | Control | SED1 | P-value2 |
| Ammonia (NH3), ppm | |||||
| 0 | 5.70 | 2.80 | 1.79 | 0.14 | |
| 7 | 5.87 | 5.50 | 1.79 | 0.84 | |
| 14 | 8.47 | 4.43 | 1.79 | 0.05 | |
| 21 | 4.74 | 4.72 | 1.79 | 0.99 | |
| 28 | 5.87 | 5.73 | 1.79 | 0.94 | |
| Hydrogen sulfide (H2S), ppm | |||||
| 0 | 0.128 | 0.090 | 0.046 | 0.44 | |
| 7 | 0.146 | 0.092 | 0.046 | 0.27 | |
| 14 | 0.063 | 0.038 | 0.046 | 0.59 | |
| 21 | 0.112 | 0.108 | 0.046 | 0.92 | |
| 28 | 0.087 | 0.080 | 0.046 | 0.88 | |
| Particulate matter size 10 microns or smaller (PM10), µg/m3 | |||||
| 0 | 59.1 | 11.4 | 234.9 | 0.84 | |
| 7 | 175.6 | 579.9 | 241.6 | 0.11 | |
| 14 | 496.8 | 47.7 | 242.3 | 0.07 | |
| 21 | 17.0 | 151.5 | 242.3 | 0.58 | |
| 28 | 43.6 | 30.4 | 242.3 | 0.96 | |
1 Standard error of the difference between the two treatments on a day is reported. 2 P-value is for the difference between treatments on the same day. | |||||
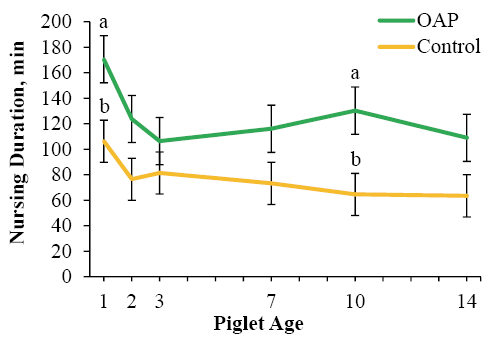
a,b Time points with differing superscripts differ between treatments at P < 0.05.
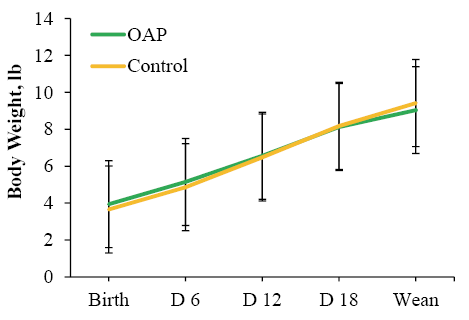
| Table 2. Least squares means for piglet postural data by treatment (oxidizing air purification [OAP] and control) and day of age. | |||||
| Trait | Day | OAP | Control | SED1 | P-value2 |
| Percentage of pigs lying per day | |||||
| 1 | 68.1 | 63.3 | 5.1 | 0.36 | |
| 2 | 67.4 | 66.5 | 5.3 | 0.87 | |
| 3 | 70.2 | 72.2 | 5.3 | 0.71 | |
| 7 | 76.2 | 76.7 | 6.5 | 0.93 | |
| 10 | 66.6 | 77.0 | 5.8 | 0.09 | |
| 14 | 64.5 | 70.1 | 7.8 | 0.48 | |
| Percentage of pigs standing per day | |||||
| 1 | 19.3 | 27.3 | 4.7 | 0.10 | |
| 2 | 21.6 | 28.3 | 4.9 | 0.18 | |
| 3 | 19.1 | 23.0 | 4.9 | 0.43 | |
| 7 | 19.2 | 18.9 | 5.6 | 0.96 | |
| 10 | 27.4 | 20.5 | 5.2 | 0.20 | |
| 14 | 29.0 | 27.2 | 6.6 | 0.78 | |
| Percentage of pigs sitting per day | |||||
| 1 | 4.90 | 2.52 | 0.59 | 0.0006 | |
| 2 | 3.00 | 2.29 | 0.63 | 0.27 | |
| 3 | 2.81 | 1.44 | 0.63 | 0.04 | |
| 7 | 2.87 | 1.58 | 0.76 | 0.11 | |
| 10 | 3.06 | 2.33 | 0.69 | 0.31 | |
| 14 | 2.56 | 0.59 | 0.96 | 0.05 | |
1 Standard error of the difference between the two treatments on a day is reported. 2 P-value is for the difference between treatments on the same day. | |||||
Grazing Management
AS2304-17 • Winter cereal cover crops as an alternative forage source for extended season grazing
Katrina Kratzke1, Joshua Wianecki1, Miranda Meehan1, Kevin Sedivec1,2, Lindsay Chamberlain Malone1 and Zachary Carlson3
1School of Natural Resource Sciences, North Dakota State University, Fargo, ND.
2Central Grasslands Research Extension Center, North Dakota State University, Streeter, ND.
3IFF, Fargo, ND.
Winter cereal cover crops are a high-quality forage source for extended season grazing. Rye has superior winter hardiness and produces greater early-spring biomass when planted late in the fall compared to triticale and wheat.
Summary
Winter cereal cover crops are increasingly used for their ecological benefits and are a potential forage source for livestock. This study evaluated winter rye, triticale and wheat cover crops as alternative forage sources for extended season grazing of beef heifers. Triticale provided the highest quality forage but insufficient biomass to support grazing. Rye had superior winter hardiness and biomass production compared to triticale and wheat. Grazing was heavily dependent on planting date, temperature and precipitation.
Introduction
Cover crops have gained popularity as a practice implemented across the United States. Producers are incorporating cover crops to improve soil health, increase crop yields, reduce soil erosion, manage water and increase forage options for livestock (CTIC 2025). Cereal rye, also called winter rye, is the most frequently grown cover crop, with the winter cereals of wheat and triticale also being common. Winter cereals are typically planted in the fall following a cash crop. They will initiate growth in the fall, undergo vernalization in the winter and transition to reproductive growth in the spring. Winter cereal cover crops provide ecological benefits such as protecting organic matter, enhancing soil pore development, reducing erosion and lowering nitrate concentrations in runoff. Economic returns from these ecological benefits are slow and difficult to track. Incorporating livestock may provide additional economic benefits while adding additional soil benefits (Kumar et al., 2019). In recent years, producers have expressed increased interest in livestock integration. The 2024-25 National Cover Crop Survey revealed 32.2% of crop advisors surveyed anticipate they will start to see more cover crops being grazed (CTIC, SARE and ASTA, 2025).
Dual-purpose CC practices often use winter cereals, such as rye or triticale, planted in the fall and then used for spring grazing (Drewnoski et al., 2018). Winter rye is commonly selected due to its winter hardiness, high biomass production and low cost. However, triticale and select winter wheat varieties produce higher-quality forage (Sedivec et al., 2021). Due to the short growing season in the northern Great Plains, it can be difficult to establish a cover crop as part of a dual crop system. In other regions, these species are dual-harvested (fall and spring) with grazing in addition to a cash crop. Currently, there is limited research evaluating the potential to dual graze a winter cereal for livestock forage in the northern Great Plains and assessing the economic and ecological benefits of integrated crop-livestock systems.
The objective of this study was to determine the impacts of long-term livestock integration and cover crop management on crop production, soil health and system profitability. This project compared management of winter rye, triticale and wheat cover crops and livestock integration through dual season (fall and spring) grazing, spring grazing, no grazing or no cover crop. The study evaluated cover crop production by biomass and nutritional value, as well as livestock performance in terms of grazing days.
Procedures (materials and methods)
A 40-acre site at the NDSU Central Grasslands Research Extension Center was selected. The site was divided into nine paddocks and randomly assigned one of three grazing treatments: dual season (fall and spring) grazing (DG), spring grazing (SG) or no grazing (NG). The NG plots included a split-plot no-cover-crop (NCC) treatment. Treatments were established in fall 2022, and the site was converted to no-till management (Wianecki, 2025). In 2024 and 2025, cover crop treatments were subdivided into winter rye (Secale cereale L.), triticale (x Triticosecale Wittmack) and winter wheat (Triticum aestivum L.).
Prior to and following every grazing period, cover crop biomass samples were collected to determine production, set stocking rates and evaluate utilization; cattle’s two-day weights were also recorded. Four 0.82 ft2 frames were clipped to ground level per winter cereal per plot. Forage samples were dried at 122 degrees Fahrenheit for 48 hours and weighed to determine biomass production. Samples were ground to 2 mm and submitted to the North Dakota State University Nutrition Laboratory (Fargo, North Dakota) for analysis of crude protein (CP), total minerals (Ash), neutral detergent fiber (NDF), acid detergent fiber (ADF), in vitro organic matter digestibility (IVOMD) and in vitro dry matter digestibility (IVDMD). Forage biomass samples were not collected in fall 2025 due to limited growth. Nutritional analyses were not conducted in spring 2026 due to inadequate sample size.
Winter cereals were grazed spring of 2025 at 0.13 AUM ac-1 and in the fall at 1.06 AUM ac-1. In fall 2025, cows were additionally provided liquid protein supplement due to low nutritional value of corn stalk residue and lack of winter cereal biomass. In spring 2026, there was no grazing period due to insufficient forage production.
All statistical differences were determined by analysis of variance (ANOVA) within R v4.6.0 using the aov() function. Fixed effects included grazing period, treatment, cereal type and all associated interactions. Comparison of means was performed using Tukey’s HSD through the emmeans() package (Lenth, 2024). Significance was determined at P ≤ 0.05.
Results and Discussion
In spring of 2025, cover crop biomass production varied by treatment and cereal type (Figure 1). Pre grazing, SG rye produced greater biomass than triticale and wheat. The NG rye produced greater biomass than grazed rye, grazed and NG triticale, and wheat. There were no post grazing differences between DG and SG, as treatments were grazed at the same stocking rates to achieve the same level of utilization. In 2026, rye produced greater biomass than triticale and wheat (Figure 2). Triticale and wheat did not start growing as early or quickly as rye.
Nutritional analysis of winter cereals was completed in spring 2025 (Table 1). Triticale had lower NDF and ADF than wheat and rye. Rye had lower CP than triticale. Wheat had lower IVDMD and IVOMD than rye and triticale. This indicates that triticale had the highest forage quality, while winter wheat had the lowest. Rye was intermediate quality but produced the greatest biomass. This is consistent with the findings of Sedivec (2021). Winter kill was observed in the wheat and triticale, along with a delay in spring emergence compared to rye, resulting in differences in growth at sampling. Post graze forage was lower in IVDMD than pre graze forage. This is expected, as forage continues to grow and mature; digestibility typically decreases.
Average daily gain (ADG) for 2025 spring graze was -2.55lbs day-1, and fall graze was -3.58lbs day-1. Although the nutritional value of forage was high, these short grazing periods resulted in a loss of gain. This can be attributed to the grazing periods of less than two weeks, which do not allow adequate time for livestock to adjust to the new diet. Drewnoski (2018) reported fall-weaned calves that grazed a fall cover crop for a 48–64-day period had an ADG of 1.32 to 2.43 lbs.
Grazing cover crops is heavily dependent on planting date, temperature and precipitation but can provide a high-quality forage source. Of the three winter cereals evaluated, triticale produced the highest quality forage but insufficient biomass to support grazing. If planting a cover crop late in the fall, we recommend using winter rye, as it produces the greatest spring biomass to support a short grazing period.
Acknowledgments
Thank you to North Dakota Soybean Council and North Dakota Corn Council for project funding, and the staff and technicians at the NDSU Central Grasslands Research Extension Center for their assistance.
Literature Cited
CTIC, SARE, and ASTA, 2025. National Cover Crop Survey Report 2024-2025. Joint publication of the Conservation Technology Information Center, Sustainable Agriculture Research & Education, and American Seed Trade Association.
Drewnoski, M., J. Parsons, H. Blanco, D. Redfearn, K. Hales, and J. MacDonald. 2018. Forages and pastures symposium: cover crops in livestock production: whole-system approach. Can cover crops pull double duty: conservation and profitable forage production in the Midwestern United States?. J. Anim. Sci.. 96:3503-3512.
Kumar, S., H. Sieverding, L. Lai, N. Thandiwe, B. Wienhold, D. Redfearn, D. Archer, D. Ussiri, D. Faust, D. Landblom, E. Grings, J. J. Stone, J. Jacquet, K. Pokharel, M. Liebig, M. Schmer, P. Sexton, R. Mitchell, S. Smalley, S. Osborne, S. Ali, S. Şentürklü, S. Sehgal, V. Owens, and V. Jin. 2019. Facilitating crop–livestock reintegration in the northern great plains. Agron. J. 111:2141-2156.
Sedivec, K., S. Alm, M. Undi, and J. Leier. 2021. Forage production and quality, livestock performance and cost comparison for winter cereal forages. NDSU Central Grasslands Research Extension Center 2020 Annual Report.
Wianecki, J.V. 2025, Enhancing Winter Cover Crop Practices Through Integrated Crop Livestock Systems, M.S. Thesis, North Dakota State University.
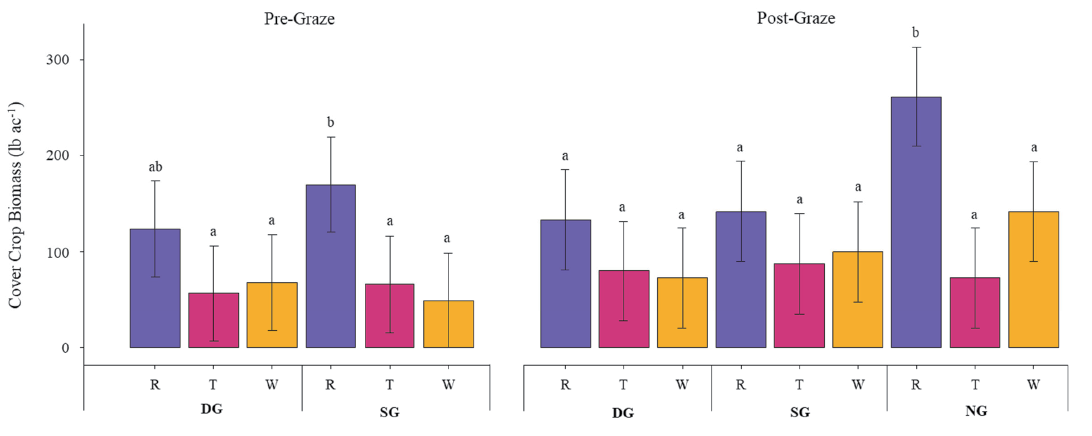
abc Means not connected by the same letters are significantly different within grazing period (P ≤0.05).
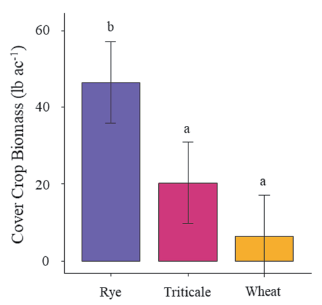
abc Means not connected by the same letters are significantly different within grazing period (P ≤0.05).
Table 1. 2025 winter cereal nutirional analysis results pre- and post-grazing
| Period | Trt | Cereal | Ash% | NDF% | ADF% | CP% | IVDMD% | IVOMD % |
| Pre-Graze | DG | Rye | 13.307 | 46.084 | 23.171 | 18.024 | 80.447 | 80.800 |
| Triticale | 14.056 | 43.321 | 21.994 | 18.909 | 81.567 | 81.927 | ||
| Wheat | 17.657 | 49.680 | 29.364 | 16.932 | 64.986 | 66.873 | ||
| SG | Rye | 13.329 | 50.394 | 26.798 | 13.302 | 77.329 | 77.818 | |
| Triticale | 10.706 | 46.801 | 22.406 | 16.162 | 84.012 | 83.212 | ||
| Wheat | 14.771 | 49.376 | 28.064 | 17.738 | 72.957 | 73.032 | ||
| Post-Graze | DG | Rye | 28.000 | 58.074 | 35.151 | 15.068 | 66.990 | 75.321 |
| Triticale | 18.186 | 47.014 | 25.813 | 23.873 | 75.613 | 79.303 | ||
| Wheat | 23.328 | 50.450 | 29.740 | 21.564 | 60.669 | 68.540 | ||
| NG | Rye | 10.435 | 51.047 | 25.810 | 17.975 | 78.529 | 78.970 | |
| Triticale | 14.032 | NaN | NaN | 30.630 | 83.512 | 85.005 | ||
| Wheat | 28.164 | 50.931 | 31.839 | 22.535 | 65.310 | 74.261 | ||
| SG | Rye | 27.914 | 54.460 | 32.561 | 15.505 | 66.781 | 75.182 | |
| Triticale | 19.468 | 46.562 | 23.642 | 25.325 | 75.341 | 78.726 | ||
| Wheat | 25.121 | 57.315 | 33.886 | 19.272 | 59.949 | 72.485 | ||
| P-value | Period | ≤ 0.001* | 0.002* | 0.010* | 0.053 | 0.003* | 0.187 | |
| Trt | 0.244 | 0.375 | 0.207 | 0.153 | 0.012 | 0.066 | ||
| Cereal | 0.210 | 0.015* | 0.024* | 0.005* | 0.001* | ≤ 0.001* | ||
| Period*Trt | 0.717 | 0.183 | 0.386 | 0.277 | 0.899 | 0.733 | ||
| Period*Cereal | 0.353 | 0.1 62 | 0.372 | 0.083 | 0.777 | 0.342 | ||
| Trt*Cereal | 0.205 | 0.915 | 0.402 | 0.921 | 0.705 | 0.407 | ||
| Period*Trt*Cereal | 0.891 | 0.105 | 0.361 | 0.554 | 0.554 | 0.653 |
AS2304-18 • Calf grazing patterns and performance under virtual fence management
Sallie Sherman1, Miranda Meehan1, Christopher Byrd2, Travis Seaborn1, Christopher Augustin3 and Kevin Sedivec1,4
1School of Natural Resource Sciences, NDSU
2Department of Animal Sciences, NDSU
3Dickinson Research Extension Center, NDSU
4Central Grasslands Research Extension Center, NDSU
When utilizing virtual fence to manage cow-calf pairs, we found no difference in containment within the virtual fence boundary between collared cows and their uncollared calves. However, the distance that calves grazed from their dams increased as the grazing season progressed. Additionally, calves in the virtual fence patch graze treatment group had increased average daily gains than calves in a continuous grazing system.
Summary
Virtual fence systems are a growing option for livestock grazing management, but there is little information on how efficient they are at managing cows with calves and the distance calves will creep graze without physical fences restricting their movement. A subset of cow-calf pairs in a virtual fence-managed patch grazing trial was tagged with 701x ear tags to track cow and calf movement throughout the grazing season. There was no difference between containment with the virtual fence boundary between the dam and calf overall, but there was a significant difference between cow-calf pair containment and period within the grazing season, indicating an uptick in creep grazing. Calves did graze significantly farther from their dams as the grazing season progressed. Calves in the virtual fence treatment group also gained approximately 0.57 lbs. more per day compared to continuous-graze calves. While more research is needed to better understand how the cow/calf relationship interacts with virtual fence management, our data indicate improved calf performance in a virtual fence patch-grazing system compared to a continuous-grazing system.
Introduction
Virtual fencing systems utilize digital fence boundaries and global positioning system (GPS) that enable collars or ear tags to manage the movement of grazing animals. Auditory and electrical stimuli are used to keep individual animals within the boundaries designated by virtual fences. Most virtual fence technologies are not recommended for calves because they would require constant monitoring and adjustment to account for their growth, and the electrical stimuli is designed for animals over 500 lbs. Therefore, virtual fence technologies are commonly evaluated to determine their effects on livestock production outcomes on stocker or dairy cattle.
There is minimal information on the behavior of calves grazing with their dams managed by virtual fence. Preliminary research from Utsumi et al (2023) found that cows managed by virtual fence received more virtual fence cues preweaning and were more responsive to virtual fence cues postweaning (Utsumi et al. 2023). The purpose of this study is to understand calf creep-grazing behavior when managing cows with virtual fence and to document the performance of calves during creep grazing by utilizing virtual fence collars on cows and GPS ear tags on calves.
Procedures
One hundred and ten cow/calf pairs were turned out in three replications of patch grazing with virtual fence from June 11 to Oct. 6 (116 days) during the 2025 grazing season at Schnell Recreation Area. Cows were trained on the virtual fence system for four days prior to turnout using a standardized system training protocol. Three pastures were divided into quadrants using virtual fence, and cows were permitted to graze ¼ of the pasture for the first 50 days, ½ the next 50 days and ¾ of the pasture for the remainder of the grazing season, resting ¼ of the pasture (Figure 1). This pattern created a gradient of disturbance by varying grazing intensity over space and time, impacting vegetation structure. Pastures ranged from 440 to 532 acres, and within the pastures, the patches ranged from 110 to 133 acres. Forty-six cow/calf pairs were continuously grazed as a control treatment.
According to protocol, only the cows were collared, as collars are not recommended for calves because of growth and weight restrictions. Of the 110 cows, a subset of 38 cows received 701xPro ear tags and their calves received 701xLite ear tags. Of the cow/calf pairs tagged, GPS data for the entire grazing season was recorded and recovered for 12 sets of tags.
All data cleaning and analysis was conducted in R Studio. Containment within the virtual fence boundary was determined by the time spent inside and outside the boundary, based on GPS points and timestamps. The daily containment averages were used in a t-test after testing for assumptions to identify differences in cow and calf containment within the virtual fence boundary.
To determine the degree to which calves engaged in creep grazing, GPS points were used to determine the average distance of a calf from its dam over time. The first GPS point for each hour was used to determine the distance between each dam and her calf to overcome inconsistencies in datapoint timestamps. These data were used in a linear model to capture any change in that occurred outside of the virtual fence boundary as the grazing season progressed. An ANOVA and Tukey test determined variance between months.
Two-day weights were collected pre- and postgrazing for all calves in the virtual fence patch graze treatment group (n = 104) as well as for calves continuously grazed at the same site (n = 46). The impact of virtual fence patch grazing on calf performance was determined by comparing average daily gain between the two groups using an ANOVA.
Results and Discussion
The difference in containment time between cow and calf containment was used to determine how much cow-calf pairs spent inside and outside of the virtual fence boundary. Positive differences indicate that the calf spent less time within the virtual fence boundary and, therefore, presumably creep grazing, and negative values indicate the time the calf spent within the virtual fence boundary while the dam was not contained. Values closer to zero indicate similar grazing behavior in cow and calf. Cow-calf containment between pairs did not differ across the grazing season. The majority of variance in cow containment is driven by individual cow behavior (P < 0.001) and timepoint during the grazing season (P = 0.003) (Figure 2). Variance in cow containment was not related to calf containment (P = 0.34). Calves spent more time outside of the virtual fence boundary than their dams every month, with the highest incidence of creep grazing occurring in August.
The distance between calves and their dams increased as the grazing season progressed (P < 0.001). On average, calves grazed 289.9 feet from their dam in June, 413.3 feet in July, 434.0 feet in August and 380.5 feet in September (Figure 3). Calves continued to graze farther from their dams over time.
Calves in the virtual fence patch graze treatment performed better than those in the continuous grazing group (P < 0.001) (Figure 4). Virtual fence treatment calves gained approximately 0.57 lbs/day more than calves in the continuous grazing group.
In this study, we found no difference (P > 0.05) in containment within the virtual fence boundary between cows and calves. Calves did creep graze more and farther from their dams as the grazing season progressed, even as cows were granted a larger virtual fence boundary over time. This complements preliminary findings from Utsumi et al (2023) that calves of cows managed by virtual fence graze further away from their dams as the grazing season progresses.
Our results indicate that patch grazing with virtual fence can improve calf performance outcomes. Additionally, our results align with previously published literature that reported creep feeding, including creep grazing, is correlated with improved calf weight gain (Lardy et al. 2007). While virtual fence patch grazing has been shown to improve calf performance, further research is needed to better understand the cow and calf drivers to cross a virtual fence boundary, to better inform virtual fence management decision-making and to further improve production outcomes.
Acknowledgments
Special thanks to the NDSU Dickinson Research Extension Center team. This work is supported by the NRCS’s Conservation Innovation Grant (CIG) Classic Program award no. NR243A750011G019 from the U.S. Department of Agriculture’s National Institute of Food and Agriculture.
Literature Cited
Lardy, G. P., and T. D. Maddock. 2007. Creep feeding nursing beef calves. Vet.Clin. N. Amer.: Food Anim. Pract. 23:21-28.
Utsumi, S., S. Nyamuryekung’e, M. Spetter, A. Cox, L. Macon, R. Estell, and G. C. Duff, 2023. Virtual fencing of rangeland cows during late lactation and following weaning. J. Anim. Sci. 101(suppl.3):478-479.