Estimating Distances Between Genes
Estimating Linkage From Three-Point Crosses
Recombination and Estimating the Distance Between Genes
Physical crossing over during meiosis I is a normal event. The effect of this event is to rearrange heterozygous homologous chromsomes into new combinations. The term used for crossing over is recombination. Recombination can occur between any two genes on a chromosome, the amount of crossing over is a function of how close the genes are to each other on the chromosome. If two genes are far apart, for example at opposite ends of the chromosome, crossover and non-crossover events will occur in equal frequency. Genes that are closer together undergo fewer crossing over events and non-crossover gametes will exceed than the number of crossover gametes. The figure below shows this concept.
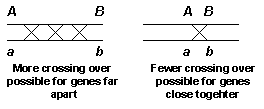
Finally, for two genes are right next to each other on the chromosome crossing over will be a very rare event.
Two types of gametes are possible when following genes on the same chromosomes. If crossing over does not occur, the products are parental gametes. If crossing over occurs, the products are recombinant gametes. The allelic composition of parental and recombinant gametes depends upon whether the original cross involved genes in coupling or repulsion phase. The figure below depicts the gamete composition for linked genes from coupling and repulsion crosses.
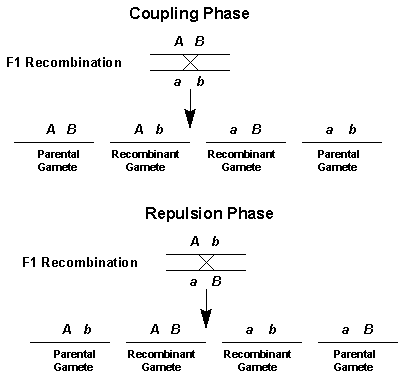
It is usually a simple matter to determine which of the gametes are recombinant. These are the gametes that are found in the lowest frequency. This is the direct result of the reduced recombination that occurs between two genes that are located close to each other on the same chromosome. Also by looking at the gametes that are most abundant you will be able to determine if the original cross was a coupling or repulsion phase cross. For a coupling phase cross, the most prevalent gametes will be those with two dominant alleles or those with two recessive alleles. For repulsion phase crosses, gametes containing one dominant and one recessive allele will be most abundant. Understanding this fact will be important when you actually calculate a linkage distance estimate from your data.
The important question is how many recombinant chromosomes will be produced. If the genes are far apart on the chromosome a cross over will occur every time that pairing occurs and an equal number of parental and recombinant chromosomes will be produced. Test cross data will then generate a 1:1:1:1 ratio. But as two genes are closer and closer on the chromosome, fewer cross over events will occur between them and thus fewer recombinant chromosomes will be derived. We then see a deviation from the expected 1:1:1:1 ratio.
How can we decide how close two genes are on a chromosome? Because fewer crossover events are seen between two genes physically close togehter on a chromosome, the lower the percentage of recombinant phenotypes will be seen in the testcross data. By definition, one map unit (m.u.) is equal to one percent recombinant phenotypes. In honor of the work performed by Morgan, one m.u. is also called one centimorgan (cM).
Now let's determine the linkage distance between the genes pr and vg. We can actually make two estimates because we have the results from coupling and repulsion phases crosses. The coupling phase analyzed a total of 2839 gametes, and of these gametes 305 (151 pr+ vg+ 154 pr vg+) gametes were recombinant. To determine the linkage distance simply divide the number of recombinant gametes into the total gametes analyzed. So the linkage distance is equal to 10.7 cM [(305/2839)*100)].
We can also perform the same calculations with the results from the repulsion phase cross. For this experiment, a total of 2335 gametes were analyzed, and 303 (151 pr+ vg++ 154 pr vg) of these were the result of recombination. The estimate of the linkage distance between pr and vgfrom these experiments is 13.0 cM [(303/2335)*100].
Obviously, we can conclude that the two genes are linked on the same chromosome. But what is the true linkage distance, the 10.7 cM value from the coupling experiment or the 13.0 value from the repulsion experiment? Actually neither is correct or wrong. These again are two estimates. Only by repeating this experiments many times using a number of different independent crosses can we settle on a value.
Once we have settled on a value, these genes can then be graphically displayed. Let's say that the true distance between the pr and vg genes is 11.8 cM, that is the average of our two estimates. We can next display them along a chromosome in the manner shown below. (Note that it is customary to use the allelic designantions of the mutant phenotype when drawing these maps.)

The final point that we need to make regards the maximum distance that we can measure. Because of the way in which the calculations are performed, we can never have more that 50% recombinant gametes. Therefore the maxmimum distance that two genes can be apart and still measure that distance is just less that 50 cM. If two genes are greater than 50 cM apart, then we can not determine if they reside on the same chromosome or are on different chromosomes. In practice though, when experimental error is considered, as distances approach 50 cM it is difficult to determine if two genes are linked on the same chromosome. Therefore, other mapping techniques must be used to determine thelinkage relationship among distantly associated genes. One method that allows us to deal with distantly related genes and to order genes is the three-point cross.
Copyright © 1997. Phillip McClean