Soil Fertility Recommendations for Corn
(SF722, Revised Dec. 2022)These recommendations are updated to include new potassium recommendations based on recent research.
Nitrogen
The nitrogen (N) recommendations in this publication were developed from data accumulated during 2010 through 2021 from 90 North Dakota corn N rate experiments. In addition, data from recent N rate studies in northwestern Minnesota, southern Manitoba and the northern tier of counties in South Dakota were used to augment the NDSU dataset.
A fall soil test to 2 feet in depth for residual nitrate-N is a very important component of the N recommendation. There is a poor relationship between N rate and relative corn yield if soil test nitrate-N and previous crop N credits are not included in the analysis. Including soil test nitrate-N value of the 2-foot cores and previous crop N credits produces the “total known available N” relating available N to relative corn yield, with the resulting formula used to produce supplemental N recommendations.
Nitrogen recommendations are based on an economic production function which includes the yield response of corn to added N, less the cost of the N. This recommendation system is called the “Return to N” approach, as defined by Sawyer and Nafziger (2005).
In these recommendations, the relationship between total available N to yield for each recommendation category (region, soil texture, tillage management) is considered. As available N increases, yield increases until the cost of an additional pound of N equals the income benefit for the fraction of a bushel of corn the additional N is expected to produce.
At some rate of N, yield can decrease with added N. The yield decrease is related to greater lodging, “green snap,” which is caused by unusually rapid stalk elongation and poor stalk structure that results in stalk breakage during a high wind event, or other physiological factors.
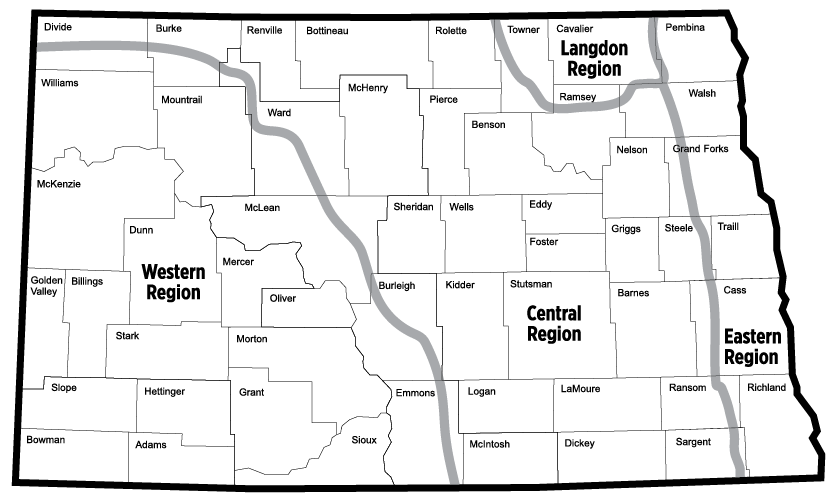
N recommendation categories
Western region
The response of corn to N is different between western region soils and soils east of the Missouri River. Part of this difference may be due to the tendency for productive corn acres west of the Missouri River to be in long-term no-till, but some is due to the soils and the warmer and drier climate of the west-river region (Table 1).
Central region and eastern region
This revision of recommendations differs from the previous publications (Franzen, 2017) because of the new “Central North Dakota” designation of a large eastern North Dakota region (Table 3). The central region has characteristics of the eastern region, but yield potential is not as great, and N loss from denitrification and leaching is not nearly as common, nor as severe as N losses in the eastern region. In the eastern region, certain fields with a history of lower yields are urged to incorporate side-dressing a portion of their N into their fertilization system, while in the central region, yield restriction is due not so much from N loss as from limitations of the soil and climate in that region, so side-dressing is neither encouraged nor discouraged.
Langdon region
Since corn is now commonly grown in the Langdon region, separate recommendations are included for Langdon region long-term no-till management and conventional-till fields (Tables 4 and 5). The Langdon region is different in N-supplying power from the rest of central/eastern North Dakota due to the abundance of ammonium-rich shale in this region. The Langdon region soils perform as a slow-release fertilizer to all crops.
recommendations.
Eastern region and central region long-term no-till
In eastern North Dakota and central North Dakota, long-term no-till, defined as continuous no-till six years or longer, is segregated from conventional-tillage sites (Table 2). The need to include a separate category for long-term no-till in these regions is also incorporated into the North Dakota spring wheat and durum recommendations and North Dakota sunflower recommendations, where research found that less N is required in long-term no-till compared to conventional-till. In the corn N rate studies, the difference in N recommendation between long-term no-till and conventional-till soils was between 40 and 50 pounds less N per acre for long-term no-till soils. However, rather than incorporate a credit, a separate return-to-N analysis was prepared.
Eastern region
Within the conventional-till soils in eastern North Dakota, soils are divided into high-clay and medium textures. High clays include the textures of clay, clay loam and silty clay loam. Bearden, Fargo, Hegne and Viking soils are some of many soils in eastern North Dakota that would fall into this high-clay category, with clay greater than 35% by weight of the total soil mineral material. These soils have a high susceptibility for denitrification, which is a soil bacteria-led process in which nitrate is converted to nitrous oxide and nitrogen gas and is lost from the soil into the atmosphere.
Denitrification proceeds when soil pores are filled with water and soil oxygen levels are low. Denitrification can be found anytime that the soil is flooded, but in high-clay soils, significant denitrification occurs, even when the soil is muddy or saturated but not flooded. Tiling or no tiling made little difference in our N rate experiments regarding N efficiency in high-clay soils. Water takes a long time to percolate through high-clay soils. Some estimates of downward water movement are 0.015 inch per hour, or about 1/3 of an inch per day, in a Fargo series soil.
High-clay soils in eastern North Dakota are divided into those at high or low risk to early season N loss (Tables 6 and 7). In lower loss risk high-clay soils, side-dress N is encouraged due to denitrification susceptibility; however, these soils have better internal drainage than those with higher risk, and growers might be able to achieve maximum economic yield with a greater portion of their total N applied preplant (Table 3). The high risk high-clay soils (Table 4) are likely to benefit most years from a side-dress N application.
The N rate specified in the high risk recommendation tables of high-clay soils at a certain N cost and corn price is the maximum to practically apply preplant to these soils. To apply enough preplant N in wet years to these soils to support yields similar to those soils with low loss risk would result in impractical N rates of more than 400 pounds N per acre, which is not economically or environmentally responsible.
The answer to higher yield in high loss risk soils is not an increase in rate, but improved application timing. Application of half or more of the recommended N at V6 to V8 growth stages would increase yield and N efficiency greatly in wetter years. Considering the tendency for high-clay soil to have sticky, mucky characteristics beneath the surface in wet conditions, the use of a coulter UAN (solution of urea and ammonium nitrate in water) side-dress applicator is strongly encouraged.
Eastern medium-textured soils include fine sandy loams, silt loams, loams, sandy loams, loamy sands and sands. The medium-textured soils with low risk to early-season N losses (Table 8) were the most productive and N-efficient soils in the eastern North Dakota conventional tillage category. Soils with low risk of N loss do not require side-dress N to be N efficient.
However, the high loss risk medium-textured soils were the most N-inefficient soils in North Dakota studies (Table 9). These soils are highly susceptibility to leaching and would benefit greatly from side-dressing part of the N. Soils in this category can be side-dressed using an anhydrous ammonia applicator, although a coulter UAN side-dress applicator would also work well.
For any subsurface-applied side-dress applicator, application may be made in every other row, rather than every row. An alternative side-dress application would be UAN streamed between each row. The efficiency of this alternative is high except in drier years, where surface dryness leads to greater N inefficiency.
A riskier post-emergence N application method is application of up to 100 pounds of urea (46 pounds of N per acre) broadcast over the whorl using a granular ground applicator or by air. The urea used in an over-the-top application should include a NBPT coating (such as in Agrotain, Koch Industries, Inc., Wichita, Kansas).
The N recommendations for irrigated corn are included in Table 10. These are the total N rates recommended through a “Return to N” model based on data collected in the Oakes area by Knighton, Derby and Albus in the 1990s.
The total N recommended for irrigated corn should be divided into preplant, side-dress and the remaining N, which should be applied through the irrigation pivot (fertigation) up until tassel initiation. An additional 20 to 30 pounds of N could be applied if yield conditions are exceptional after pollination. No N is recommended through the pivot during pollination.
For the interactive North Dakota Corn Nitrogen Calculator, go to https://www.ndsu.edu/pubweb/soils/FourCropsNitrogenCalculatorWebApp/.
Table 1. Corn N recommendation table for western region soils, considering maximum return to N using corn N price and N cost.
Corn $ per bu | N cost $ per pound | ||||||||||||||||||
|---|---|---|---|---|---|---|---|---|---|---|---|---|---|---|---|---|---|---|---|
| 0.20 | 0.30 | 0.40 | 0.50 | 0.60 | 0.70 | 0.80 | 0.90 | 1.00 | |||||||||||
| Nitrogen Recommended, pounds per acre | |||||||||||||||||||
| 2 | 150 | 125 | 100 | 80 | 60 | 30 | 16 | 0 | 0 | ||||||||||
| 3 | 182 | 159 | 135 | 111 | 87 | 63 | 40 | 16 | 0 | ||||||||||
| 4 | 195 | 176 | 159 | 139 | 124 | 106 | 87 | 70 | 51 | ||||||||||
| 5 | 201 | 187 | 173 | 159 | 144 | 130 | 116 | 101 | 87 | ||||||||||
| 6 | 206 | 194 | 182 | 170 | 159 | 147 | 135 | 123 | 111 | ||||||||||
| 7 | 210 | 199 | 189 | 179 | 169 | 159 | 148 | 138 | 128 | ||||||||||
| 8 | 212 | 203 | 194 | 186 | 176 | 167 | 159 | 150 | 141 | ||||||||||
| 9 | 214 | 206 | 198 | 191 | 182 | 174 | 166 | 159 | 151 | ||||||||||
| 10 | 216 | 209 | 201 | 194 | 187 | 180 | 173 | 166 | 159 | ||||||||||
| 11 | 217 | 210 | 204 | 197 | 191 | 184 | 178 | 172 | 165 | ||||||||||
| 12 | 218 | 212 | 206 | 200 | 194 | 188 | 184 | 176 | 170 | ||||||||||
Corn $ per bu | N cost $ per pound | ||||||||||||||||||
|---|---|---|---|---|---|---|---|---|---|---|---|---|---|---|---|---|---|---|---|
| 1.10 | 1.20 | 1.30 | 1.40 | 1.50 | 1.60 | 1.70 | 1.80 | 1.90 | 2.00 | ||||||||||
| Nitrogen Recommended, pounds per acre | |||||||||||||||||||
| 2 | 0 | 0 | 0 | 0 | 0 | 0 | 0 | 0 | 0 | 0 | |||||||||
| 3 | 0 | 0 | 0 | 0 | 0 | 0 | 0 | 0 | 0 | 0 | |||||||||
| 4 | 33 | 16 | 0 | 0 | 0 | 0 | 0 | 0 | 0 | 0 | |||||||||
| 5 | 73 | 60 | 44 | 30 | 16 | 0 | 0 | 0 | 0 | 0 | |||||||||
| 6 | 99 | 87 | 75 | 63 | 51 | 40 | 28 | 16 | 0 | 0 | |||||||||
| 7 | 118 | 107 | 97 | 87 | 77 | 67 | 57 | 46 | 36 | 26 | |||||||||
| 8 | 132 | 123 | 114 | 105 | 96 | 87 | 78 | 69 | 60 | 51 | |||||||||
| 9 | 143 | 135 | 127 | 119 | 111 | 103 | 95 | 87 | 79 | 71 | |||||||||
| 10 | 151 | 144 | 137 | 130 | 123 | 116 | 109 | 101 | 94 | 87 | |||||||||
| 11 | 158 | 152 | 145 | 139 | 133 | 126 | 120 | 113 | 107 | 100 | |||||||||
| 12 | 164 | 159 | 153 | 147 | 141 | 135 | 129 | 123 | 117 | 111 | |||||||||
Table 2. Corn N recommendation table for eastern and central long-term no-till soils, considering maximum return to N using corn N price and N cost.
Corn $ per bu | N cost $ per pound | ||||||||||||||||||
|---|---|---|---|---|---|---|---|---|---|---|---|---|---|---|---|---|---|---|---|
| 0.20 | 0.30 | 0.40 | 0.50 | 0.60 | 0.70 | 0.80 | 0.90 | 1.00 | |||||||||||
| Nitrogen Recommended, pounds per acre | |||||||||||||||||||
| 2 | 173 | 147 | 121 | 95 | 70 | 42 | 17 | 0 | 0 | ||||||||||
| 3 | 190 | 172 | 155 | 136 | 120 | 102 | 85 | 68 | 50 | ||||||||||
| 4 | 200 | 187 | 1173 | 161 | 148 | 134 | 121 | 108 | 95 | ||||||||||
| 5 | 205 | 197 | 184 | 173 | 162 | 152 | 142 | 135 | 122 | ||||||||||
| 6 | 210 | 202 | 191 | 184 | 1731 | 163 | 156 | 147 | 138 | ||||||||||
| 7 | 212 | 204 | 197 | 190 | 182 | 173 | 165 | 158 | 151 | ||||||||||
| 8 | 214 | 206 | 201 | 194 | 188 | 181 | 174 | 167 | 161 | ||||||||||
| 9 | 215 | 209 | 203 | 195 | 192 | 183 | 181 | 173 | 167 | ||||||||||
| 10 | 217 | 210 | 205 | 198 | 195 | 188 | 184 | 179 | 174 | ||||||||||
| 11 | 218 | 212 | 207 | 203 | 198 | 193 | 189 | 184 | 178 | ||||||||||
| 12 | 218 | 213 | 209 | 204 | 201 | 196 | 191 | 187 | 183 | ||||||||||
Corn $ per bu | N cost $ per pound | ||||||||||||||||||
|---|---|---|---|---|---|---|---|---|---|---|---|---|---|---|---|---|---|---|---|
| 1.10 | 1.20 | 1.30 | 1.40 | 1.50 | 1.60 | 1.70 | 1.80 | 1.90 | 2.00 | ||||||||||
| Nitrogen Recommended, pounds per acre | |||||||||||||||||||
| 2 | 0 | 0 | 0 | 0 | 0 | 0 | 0 | 0 | 0 | 0 | |||||||||
| 3 | 33 | 16 | 0 | 0 | 0 | 0 | 0 | 0 | 0 | 0 | |||||||||
| 4 | 82 | 69 | 55 | 44 | 31 | 17 | 0 | 0 | 0 | 0 | |||||||||
| 5 | 110 | 100 | 90 | 79 | 69 | 58 | 48 | 37 | 27 | 18 | |||||||||
| 6 | 131 | 121 | 112 | 103 | 96 | 87 | 78 | 70 | 61 | 52 | |||||||||
| 7 | 143 | 136 | 128 | 121 | 113 | 106 | 99 | 91 | 84 | 77 | |||||||||
| 8 | 154 | 147 | 141 | 135 | 127 | 121 | 114 | 108 | 102 | 95 | |||||||||
| 9 | 162 | 157 | 151 | 145 | 138 | 133 | 128 | 122 | 116 | 110 | |||||||||
| 10 | 169 | 163 | 158 | 152 | 147 | 142 | 137 | 131 | 126 | 121 | |||||||||
| 11 | 174 | 169 | 164 | 160 | 154 | 149 | 144 | 140 | 135 | 130 | |||||||||
| 12 | 179 | 173 | 169 | 164 | 161 | 156 | 151 | 147 | 143 | 138 | |||||||||
Table 3. Corn N recommendation table for the central region of North Dakota, considering maximum return to N using corn N price and N cost.
Corn $ per bu | N cost $ per pound | ||||||||||||||||||
|---|---|---|---|---|---|---|---|---|---|---|---|---|---|---|---|---|---|---|---|
| 0.20 | 0.30 | 0.40 | 0.50 | 0.60 | 0.70 | 0.80 | 0.90 | 1.00 | |||||||||||
| Nitrogen Recommended, pounds per acre | |||||||||||||||||||
| 2 | 214 | 179 | 147 | 114 | 79 | 46 | 13 | 0 | 0 | ||||||||||
| 3 | 238 | 214 | 192 | 170 | 148 | 125 | 103 | 81 | 62 | ||||||||||
| 4 | 248 | 232 | 213 | 197 | 180 | 163 | 147 | 130 | 113 | ||||||||||
| 5 | 250 | 241 | 226 | 213 | 200 | 186 | 173 | 160 | 146 | ||||||||||
| 6 | 250 | 248 | 237 | 224 | 213 | 202 | 191 | 180 | 169 | ||||||||||
| 7 | 250 | 250 | 243 | 233 | 223 | 212 | 203 | 194 | 185 | ||||||||||
| 8 | 250 | 250 | 248 | 239 | 231 | 222 | 213 | 207 | 197 | ||||||||||
| 9 | 250 | 250 | 250 | 244 | 237 | 229 | 221 | 213 | 206 | ||||||||||
| 10 | 250 | 250 | 250 | 248 | 241 | 234 | 228 | 222 | 213 | ||||||||||
| 11 | 250 | 250 | 250 | 250 | 245 | 239 | 232 | 225 | 219 | ||||||||||
| 12 | 250 | 250 | 250 | 250 | 248 | 242 | 237 | 213 | 224 | ||||||||||
Corn $ per bu | N cost $ per pound | ||||||||||||||||||
|---|---|---|---|---|---|---|---|---|---|---|---|---|---|---|---|---|---|---|---|
| 1.10 | 1.20 | 1.30 | 1.40 | 1.50 | 1.60 | 1.70 | 1.80 | 1.90 | 2.00 | ||||||||||
| Nitrogen Recommended, pounds per acre | |||||||||||||||||||
| 2 | 0 | 0 | 0 | 0 | 0 | 0 | 0 | 0 | 0 | 0 | |||||||||
| 3 | 37 | 14 | 0 | 0 | 0 | 0 | 0 | 0 | 0 | 0 | |||||||||
| 4 | 97 | 80 | 63 | 47 | 30 | 13 | 0 | 0 | 0 | 0 | |||||||||
| 5 | 133 | 119 | 106 | 94 | 81 | 67 | 53 | 40 | 26 | 13 | |||||||||
| 6 | 158 | 147 | 136 | 124 | 113 | 192 | 91 | 80 | 69 | 58 | |||||||||
| 7 | 175 | 166 | 157 | 146 | 137 | 128 | 118 | 109 | 99 | 90 | |||||||||
| 8 | 188 | 180 | 172 | 163 | 155 | 147 | 138 | 130 | 122 | 113 | |||||||||
| 9 | 198 | 191 | 184 | 176 | 169 | 161 | 154 | 146 | 139 | 132 | |||||||||
| 11 | 213 | 207 | 201 | 195 | 189 | 183 | 177 | 171 | 165 | 159 | |||||||||
| 12 | 219 | 213 | 208 | 202 | 197 | 191 | 186 | 180 | 174 | 169 | |||||||||
Table 4. Corn N recommendation table for the Langdon region of North Dakota, considering maximum return to N using corn N price and N cost.
Corn $ per bu | N cost $ per pound | ||||||||||||||||||
|---|---|---|---|---|---|---|---|---|---|---|---|---|---|---|---|---|---|---|---|
| 0.20 | 0.30 | 0.40 | 0.50 | 0.60 | 0.70 | 0.80 | 0.90 | 1.00 | |||||||||||
| Nitrogen Recommended, pounds per acre | |||||||||||||||||||
| 2 | 184 | 149 | 117 | 84 | 49 | 16 | 0 | 0 | 0 | ||||||||||
| 3 | 208 | 184 | 162 | 130 | 118 | 95 | 73 | 51 | 32 | ||||||||||
| 4 | 218 | 202 | 183 | 167 | 150 | 133 | 117 | 100 | 83 | ||||||||||
| 5 | 220 | 211 | 196 | 183 | 170 | 156 | 143 | 130 | 116 | ||||||||||
| 6 | 220 | 218 | 207 | 194 | 183 | 172 | 161 | 150 | 139 | ||||||||||
| 7 | 220 | 220 | 213 | 203 | 193 | 182 | 173 | 164 | 155 | ||||||||||
| 8 | 220 | 220 | 218 | 209 | 201 | 192 | 183 | 177 | 167 | ||||||||||
| 9 | 220 | 220 | 220 | 214 | 207 | 199 | 191 | 183 | 176 | ||||||||||
| 10 | 220 | 220 | 220 | 218 | 211 | 204 | 198 | 192 | 183 | ||||||||||
| 11 | 220 | 220 | 220 | 220 | 215 | 209 | 202 | 195 | 189 | ||||||||||
| 12 | 220 | 220 | 220 | 220 | 220 | 212 | 207 | 201 | 194 | ||||||||||
Corn $ per bu | N cost $ per pound | ||||||||||||||||||
|---|---|---|---|---|---|---|---|---|---|---|---|---|---|---|---|---|---|---|---|
| 1.10 | 1.20 | 1.30 | 1.40 | 1.50 | 1.60 | 1.70 | 1.80 | 1.90 | 2.00 | ||||||||||
| Nitrogen Recommended, pounds per acre | |||||||||||||||||||
| 2 | 0 | 0 | 0 | 0 | 0 | 0 | 0 | 0 | 0 | 0 | |||||||||
| 3 | 0 | 0 | 0 | 0 | 0 | 0 | 0 | 0 | 0 | 0 | |||||||||
| 4 | 67 | 50 | 33 | 17 | 0 | 0 | 0 | 0 | 0 | 0 | |||||||||
| 5 | 103 | 89 | 76 | 64 | 51 | 37 | 23 | 10 | 0 | 0 | |||||||||
| 6 | 128 | 117 | 106 | 94 | 83 | 72 | 61 | 50 | 39 | 28 | |||||||||
| 7 | 145 | 136 | 127 | 116 | 107 | 98 | 88 | 79 | 69 | 60 | |||||||||
| 8 | 158 | 150 | 142 | 133 | 125 | 117 | 108 | 100 | 92 | 83 | |||||||||
| 9 | 168 | 161 | 154 | 146 | 139 | 131 | 124 | 116 | 109 | 102 | |||||||||
| 10 | 177 | 171 | 163 | 157 | 152 | 143 | 137 | 130 | 123 | 117 | |||||||||
| 11 | 183 | 177 | 171 | 165 | 159 | 153 | 147 | 141 | 135 | 129 | |||||||||
| 12 | 189 | 183 | 178 | 172 | 167 | 161 | 156 | 150 | 144 | 139 | |||||||||
Table 5. Corn N recommendation table for long-term no-till fields in the Langdon region of North Dakota, considering maximum return to N using corn N price and N cost.
Corn $ per bu | N cost $ per pound | ||||||||||||||||||
|---|---|---|---|---|---|---|---|---|---|---|---|---|---|---|---|---|---|---|---|
| 0.20 | 0.30 | 0.40 | 0.50 | 0.60 | 0.70 | 0.80 | 0.90 | 1.00 | |||||||||||
| Nitrogen Recommended, pounds per acre | |||||||||||||||||||
| 2 | 144 | 109 | 77 | 44 | 9 | 0 | 0 | 0 | 0 | ||||||||||
| 3 | 168 | 144 | 122 | 90 | 78 | 55 | 33 | 11 | 0 | ||||||||||
| 4 | 178 | 162 | 143 | 127 | 110 | 93 | 77 | 60 | 43 | ||||||||||
| 5 | 180 | 171 | 156 | 143 | 120 | 116 | 103 | 90 | 76 | ||||||||||
| 6 | 180 | 178 | 167 | 154 | 143 | 132 | 121 | 110 | 99 | ||||||||||
| 7 | 180 | 180 | 173 | 163 | 153 | 142 | 133 | 124 | 115 | ||||||||||
| 8 | 180 | 180 | 178 | 169 | 161 | 152 | 143 | 137 | 127 | ||||||||||
| 9 | 180 | 180 | 180 | 174 | 167 | 159 | 151 | 143 | 136 | ||||||||||
| 10 | 180 | 180 | 180 | 178 | 171 | 164 | 158 | 152 | 143 | ||||||||||
| 11 | 180 | 180 | 180 | 180 | 175 | 169 | 162 | 155 | 149 | ||||||||||
| 12 | 180 | 180 | 180 | 180 | 180 | 172 | 167 | 161 | 154 | ||||||||||
Corn $ per bu | N cost $ per pound | ||||||||||||||||||
|---|---|---|---|---|---|---|---|---|---|---|---|---|---|---|---|---|---|---|---|
| 1.10 | 1.20 | 1.30 | 1.40 | 1.50 | 1.60 | 1.70 | 1.80 | 1.90 | 2.00 | ||||||||||
| Nitrogen Recommended, pounds per acre | |||||||||||||||||||
| 2 | 0 | 0 | 0 | 0 | 0 | 0 | 0 | 0 | 0 | 0 | |||||||||
| 3 | 0 | 0 | 0 | 0 | 0 | 0 | 0 | 0 | 0 | 0 | |||||||||
| 4 | 27 | 10 | 0 | 0 | 0 | 0 | 0 | 0 | 0 | 0 | |||||||||
| 5 | 63 | 49 | 36 | 24 | 11 | 0 | 0 | 0 | 0 | 0 | |||||||||
| 6 | 88 | 77 | 66 | 54 | 43 | 32 | 21 | 10 | 0 | 0 | |||||||||
| 7 | 105 | 96 | 87 | 76 | 67 | 58 | 48 | 39 | 29 | 20 | |||||||||
| 8 | 118 | 110 | 102 | 93 | 85 | 77 | 68 | 60 | 52 | 43 | |||||||||
| 9 | 128 | 121 | 114 | 106 | 99 | 91 | 84 | 76 | 69 | 62 | |||||||||
| 10 | 137 | 131 | 123 | 117 | 112 | 103 | 97 | 90 | 83 | 77 | |||||||||
| 11 | 143 | 137 | 131 | 125 | 119 | 113 | 107 | 101 | 95 | 89 | |||||||||
| 12 | 149 | 143 | 138 | 132 | 127 | 121 | 116 | 110 | 104 | 99 | |||||||||
Table 6. Corn N recommendation table for eastern high-clay soils with low risk of early-season N loss, considering maximum return to N using corn N price and N cost.
Corn $ per bu | N cost $ per pound | ||||||||||||||||||
|---|---|---|---|---|---|---|---|---|---|---|---|---|---|---|---|---|---|---|---|
| 0.20 | 0.30 | 0.40 | 0.50 | 0.60 | 0.70 | 0.80 | 0.90 | 1.00 | |||||||||||
| Nitrogen Recommended, pounds per acre | |||||||||||||||||||
| 2 | 250 | 223 | 196 | 168 | 140 | 124 | 85 | 57 | 29 | ||||||||||
| 3 | 250 | 234 | 206 | 187 | 169 | 150 | 132 | 113 | 95 | ||||||||||
| 4 | 250 | 250 | 226 | 211 | 197 | 183 | 169 | 155 | 141 | ||||||||||
| 5 | 250 | 250 | 250 | 224 | 213 | 202 | 191 | 180 | 169 | ||||||||||
| 6 | 250 | 250 | 250 | 235 | 224 | 215 | 206 | 197 | 187 | ||||||||||
| 7 | 250 | 250 | 250 | 241 | 233 | 224 | 217 | 209 | 201 | ||||||||||
| 8 | 250 | 250 | 250 | 246 | 239 | 232 | 224 | 217 | 210 | ||||||||||
| 9 | 250 | 250 | 250 | 250 | 244 | 238 | 232 | 224 | 218 | ||||||||||
| 10 | 250 | 250 | 250 | 250 | 250 | 242 | 237 | 231 | 224 | ||||||||||
| 11 | 250 | 250 | 250 | 250 | 250 | 246 | 241 | 236 | 230 | ||||||||||
| 12 | 250 | 250 | 250 | 250 | 250 | 250 | 244 | 239 | 235 | ||||||||||
Corn $ per bu | N cost $ per pound | ||||||||||||||||||
|---|---|---|---|---|---|---|---|---|---|---|---|---|---|---|---|---|---|---|---|
| 1.10 | 1.20 | 1.30 | 1.40 | 1.50 | 1.60 | 1.70 | 1.80 | 1.90 | 2.00 | ||||||||||
| Nitrogen Recommended, pounds per acre | |||||||||||||||||||
| 2 | 0 | 0 | 0 | 0 | 0 | 0 | 0 | 0 | 0 | 0 | |||||||||
| 3 | 75 | 58 | 39 | 21 | 0 | 0 | 0 | 0 | 0 | 0 | |||||||||
| 4 | 127 | 113 | 99 | 86 | 72 | 58 | 44 | 30 | 16 | 0 | |||||||||
| 5 | 158 | 147 | 136 | 124 | 113 | 102 | 91 | 80 | 69 | 58 | |||||||||
| 6 | 178 | 169 | 160 | 150 | 141 | 132 | 124 | 113 | 104 | 95 | |||||||||
| 7 | 193 | 185 | 177 | 169 | 161 | 153 | 145 | 137 | 129 | 121 | |||||||||
| 8 | 204 | 197 | 190 | 183 | 176 | 169 | 162 | 155 | 148 | 141 | |||||||||
| 9 | 212 | 206 | 200 | 194 | 187 | 181 | 175 | 169 | 163 | 157 | |||||||||
| 10 | 219 | 213 | 208 | 202 | 197 | 191 | 186 | 180 | 174 | 169 | |||||||||
| 11 | 224 | 219 | 214 | 209 | 204 | 199 | 194 | 189 | 184 | 179 | |||||||||
| 12 | 230 | 224 | 220 | 215 | 211 | 206 | 201 | 197 | 192 | 187 | |||||||||
Table 7. Corn N recommendation table for eastern high-clay soils with high risk of early-season N loss, considering maximum return to N using corn N price and N cost.
Corn $ per bu | N cost $ per pound | ||||||||||||||||||
|---|---|---|---|---|---|---|---|---|---|---|---|---|---|---|---|---|---|---|---|
| 0.20 | 0.30 | 0.40 | 0.50 | 0.60 | 0.70 | 0.80 | 0.90 | 1.00 | |||||||||||
| Nitrogen Recommended, pounds per acre | |||||||||||||||||||
| 2 | 150* | 150 | 150 | 150 | 140 | 124 | 85 | 57 | 29 | ||||||||||
| 3 | 150 | 150 | 150 | 150 | 150 | 150 | 132 | 113 | 95 | ||||||||||
| 4 | 150 | 150 | 150 | 150 | 150 | 150 | 150 | 150 | 141 | ||||||||||
| 5 | 150 | 150 | 150 | 150 | 150 | 150 | 150 | 150 | 150 | ||||||||||
| 6 | 150 | 150 | 150 | 150 | 150 | 150 | 150 | 150 | 150 | ||||||||||
| 7 | 150 | 150 | 150 | 150 | 150 | 150 | 150 | 150 | 150 | ||||||||||
| 8 | 150 | 150 | 150 | 150 | 150 | 150 | 150 | 150 | 150 | ||||||||||
| 9 | 150 | 150 | 150 | 150 | 150 | 150 | 150 | 150 | 150 | ||||||||||
| 10 | 150 | 150 | 150 | 150 | 150 | 150 | 150 | 150 | 150 | ||||||||||
| 11 | 150 | 150 | 150 | 150 | 150 | 150 | 150 | 150 | 150 | ||||||||||
| 12 | 150 | 150 | 150 | 150 | 150 | 150 | 150 | 150 | 150 | ||||||||||
Corn $ per bu | N cost $ per pound | ||||||||||||||||||
|---|---|---|---|---|---|---|---|---|---|---|---|---|---|---|---|---|---|---|---|
| 1.10 | 1.20 | 1.30 | 1.40 | 1.50 | 1.60 | 1.70 | 1.80 | 1.90 | 2.00 | ||||||||||
| Nitrogen Recommended, pounds per acre | |||||||||||||||||||
| 2 | 0 | 0 | 0 | 0 | 0 | 0 | 0 | 0 | 0 | 0 | |||||||||
| 3 | 75 | 58 | 39 | 21 | 0 | 0 | 0 | 0 | 0 | 0 | |||||||||
| 4 | 127 | 113 | 99 | 86 | 72 | 58 | 44 | 30 | 16 | 0 | |||||||||
| 5 | 150 | 150 | 136 | 124 | 113 | 102 | 91 | 80 | 69 | 58 | |||||||||
| 6 | 150 | 150 | 150 | 150 | 141 | 132 | 124 | 113 | 104 | 95 | |||||||||
| 7 | 150 | 150 | 150 | 150 | 150 | 150 | 145 | 137 | 129 | 121 | |||||||||
| 8 | 150 | 150 | 150 | 150 | 150 | 150 | 150 | 150 | 148 | 141 | |||||||||
| 9 | 150 | 150 | 150 | 150 | 150 | 150 | 150 | 150 | 150 | 150 | |||||||||
| 10 | 150 | 150 | 150 | 150 | 150 | 150 | 150 | 150 | 150 | 150 | |||||||||
| 11 | 150 | 150 | 150 | 150 | 150 | 150 | 150 | 150 | 150 | 150 | |||||||||
| 12 | 150 | 150 | 150 | 150 | 150 | 150 | 150 | 150 | 150 | 150 | |||||||||
*The 150 pound N per acre limit on N rate recognizes that increasing rate is not the way to achieve higher yields in these soils. When a split N application is used (side-dress), use Table 6 for the total rate of preplant plus side-dress.
Table 8. Corn N recommendation table for eastern medium-textured soils with low risk of early season N loss, considering maximum return to N using corn N price and N cost.
Corn $ per bu | N cost $ per pound | ||||||||||||||||||
|---|---|---|---|---|---|---|---|---|---|---|---|---|---|---|---|---|---|---|---|
| 0.20 | 0.30 | 0.40 | 0.50 | 0.60 | 0.70 | 0.80 | 0.90 | 1.00 | |||||||||||
| Nitrogen Recommended, pounds per acre | |||||||||||||||||||
| 2 | 231 | 226 | 161 | 126 | 92 | 57 | 22 | 0 | 0 | ||||||||||
| 3 | 250 | 232 | 207 | 184 | 161 | 138 | 115 | 92 | 68 | ||||||||||
| 4 | 250 | 250 | 232 | 213 | 196 | 178 | 161 | 144 | 126 | ||||||||||
| 5 | 250 | 250 | 245 | 232 | 216 | 203 | 189 | 175 | 161 | ||||||||||
| 6 | 250 | 250 | 250 | 243 | 232 | 219 | 207 | 196 | 184 | ||||||||||
| 7 | 250 | 250 | 250 | 250 | 241 | 232 | 221 | 211 | 201 | ||||||||||
| 8 | 250 | 250 | 250 | 250 | 250 | 241 | 232 | 222 | 213 | ||||||||||
| 9 | 250 | 250 | 250 | 250 | 250 | 250 | 239 | 232 | 223 | ||||||||||
| 10 | 250 | 250 | 250 | 250 | 250 | 250 | 245 | 238 | 232 | ||||||||||
| 11 | 250 | 250 | 250 | 250 | 250 | 250 | 250 | 244 | 238 | ||||||||||
| 12 | 250 | 250 | 250 | 250 | 250 | 250 | 250 | 250 | 243 | ||||||||||
Corn $ per bu | N cost $ per pound | ||||||||||||||||||
|---|---|---|---|---|---|---|---|---|---|---|---|---|---|---|---|---|---|---|---|
| 1.10 | 1.20 | 1.30 | 1.40 | 1.50 | 1.60 | 1.70 | 1.80 | 1.90 | 2.00 | ||||||||||
| Nitrogen Recommended, pounds per acre | |||||||||||||||||||
| 2 | 0 | 0 | 0 | 0 | 0 | 0 | 0 | 0 | 0 | 0 | |||||||||
| 3 | 45 | 22 | 0 | 0 | 0 | 0 | 0 | 0 | 0 | 0 | |||||||||
| 4 | 111 | 92 | 74 | 57 | 41 | 22 | 0 | 0 | 0 | 0 | |||||||||
| 5 | 147 | 133 | 119 | 106 | 92 | 78 | 64 | 50 | 36 | 22 | |||||||||
| 6 | 173 | 161 | 150 | 138 | 126 | 115 | 103 | 92 | 80 | 69 | |||||||||
| 7 | 191 | 181 | 171 | 161 | 151 | 141 | 131 | 121 | 111 | 102 | |||||||||
| 8 | 204 | 196 | 187 | 178 | 170 | 161 | 152 | 144 | 135 | 126 | |||||||||
| 9 | 215 | 207 | 200 | 192 | 184 | 176 | 169 | 161 | 153 | 146 | |||||||||
| 10 | 226 | 217 | 210 | 203 | 196 | 189 | 182 | 175 | 168 | 161 | |||||||||
| 11 | 232 | 226 | 218 | 212 | 207 | 199 | 193 | 186 | 180 | 174 | |||||||||
| 12 | 237 | 232 | 226 | 219 | 213 | 207 | 202 | 196 | 190 | 184 | |||||||||
Table 9. Corn N recommendation table for eastern medium-textured soils with high risk for early season N loss, considering maximum return to N using corn N price and N cost.
Corn $ per bu | N cost $ per pound | ||||||||||||||||||
|---|---|---|---|---|---|---|---|---|---|---|---|---|---|---|---|---|---|---|---|
| 0.20 | 0.30 | 0.40 | 0.50 | 0.60 | 0.70 | 0.80 | 0.90 | 1.00 | |||||||||||
| Nitrogen Recommended, pounds per acre | |||||||||||||||||||
| 2 | 150* | 150 | 150 | 126 | 92 | 57 | 22 | 0 | 0 | ||||||||||
| 3 | 150 | 150 | 150 | 150 | 150 | 138 | 115 | 92 | 68 | ||||||||||
| 4 | 150 | 150 | 150 | 150 | 150 | 150 | 150 | 144 | 126 | ||||||||||
| 5 | 150 | 150 | 150 | 150 | 150 | 150 | 150 | 150 | 150 | ||||||||||
| 6 | 150 | 150 | 150 | 150 | 150 | 150 | 150 | 150 | 150 | ||||||||||
| 7 | 150 | 150 | 150 | 150 | 150 | 150 | 150 | 150 | 150 | ||||||||||
| 8 | 150 | 150 | 150 | 150 | 150 | 150 | 150 | 150 | 150 | ||||||||||
| 9 | 150 | 150 | 150 | 150 | 150 | 150 | 150 | 150 | 150 | ||||||||||
| 10 | 150 | 150 | 150 | 150 | 150 | 150 | 150 | 150 | 150 | ||||||||||
| 11 | 150 | 150 | 150 | 150 | 150 | 150 | 150 | 150 | 150 | ||||||||||
| 12 | 150 | 150 | 150 | 150 | 150 | 150 | 150 | 150 | 150 | ||||||||||
Corn $ per bu | N cost $ per pound | ||||||||||||||||||
|---|---|---|---|---|---|---|---|---|---|---|---|---|---|---|---|---|---|---|---|
| 1.10 | 1.20 | 1.30 | 1.40 | 1.50 | 1.60 | 1.70 | 1.80 | 1.90 | 2.00 | ||||||||||
| Nitrogen Recommended, pounds per acre | |||||||||||||||||||
| 2 | 0 | 0 | 0 | 0 | 0 | 0 | 0 | 0 | 0 | 0 | |||||||||
| 3 | 45 | 22 | 0 | 0 | 0 | 0 | 0 | 0 | 0 | 0 | |||||||||
| 4 | 111 | 92 | 74 | 57 | 41 | 22 | 0 | 0 | 0 | 0 | |||||||||
| 5 | 147 | 133 | 119 | 106 | 92 | 78 | 64 | 50 | 36 | 22 | |||||||||
| 6 | 150 | 150 | 150 | 138 | 126 | 115 | 103 | 92 | 80 | 69 | |||||||||
| 7 | 150 | 150 | 150 | 150 | 150 | 141 | 131 | 121 | 111 | 102 | |||||||||
| 8 | 150 | 150 | 150 | 150 | 150 | 150 | 150 | 144 | 135 | 126 | |||||||||
| 9 | 150 | 150 | 150 | 150 | 150 | 150 | 150 | 150 | 150 | 146 | |||||||||
| 10 | 150 | 150 | 150 | 150 | 150 | 150 | 150 | 150 | 150 | 150 | |||||||||
| 11 | 150 | 150 | 150 | 150 | 150 | 150 | 150 | 150 | 150 | 150 | |||||||||
| 12 | 150 | 150 | 150 | 150 | 150 | 150 | 150 | 150 | 150 | 150 | |||||||||
*The 150 pound N per acre limit on N rate recognizes that increasing rate is not the way to achieve higher yields in these soils. When a split N application is used (side-dress), use Table 8 for the total rate of preplant plus side-dress.
Table 10. Corn N recommendation table for irrigated soils, considering maximum return to N using corn N price and N cost. This is the total N rate for the season, which includes several split-N applications.
Corn $ per bu | N cost $ per pound | ||||||||||||||||||
|---|---|---|---|---|---|---|---|---|---|---|---|---|---|---|---|---|---|---|---|
| 0.20 | 0.30 | 0.40 | 0.50 | 0.60 | 0.70 | 0.80 | 0.90 | 1.00 | |||||||||||
| Nitrogen Recommended, pounds per acre | |||||||||||||||||||
| 2 | 255 | 241 | 228 | 215 | 201 | 188 | 175 | 162 | 149 | ||||||||||
| 3 | 263 | 254 | 245 | 237 | 228 | 219 | 210 | 201 | 194 | ||||||||||
| 4 | 268 | 262 | 256 | 250 | 244 | 238 | 232 | 226 | 220 | ||||||||||
| 5 | 272 | 267 | 262 | 257 | 252 | 247 | 242 | 237 | 232 | ||||||||||
| 6 | 273 | 268 | 263 | 258 | 253 | 248 | 243 | 238 | 233 | ||||||||||
| 7 | 274 | 269 | 264 | 259 | 254 | 249 | 244 | 239 | 234 | ||||||||||
| 8 | 275 | 270 | 265 | 260 | 255 | 250 | 245 | 240 | 235 | ||||||||||
| 9 | 276 | 271 | 266 | 261 | 256 | 251 | 246 | 241 | 236 | ||||||||||
| 10 | 277 | 272 | 267 | 262 | 257 | 252 | 247 | 242 | 237 | ||||||||||
| 11 | 278 | 273 | 268 | 263 | 258 | 253 | 248 | 243 | 238 | ||||||||||
| 12 | 279 | 274 | 269 | 264 | 259 | 254 | 249 | 244 | 239 | ||||||||||
Corn $ per bu | N cost $ per pound | ||||||||||||||||||
|---|---|---|---|---|---|---|---|---|---|---|---|---|---|---|---|---|---|---|---|
| 1.10 | 1.20 | 1.30 | 1.40 | 1.50 | 1.60 | 1.70 | 1.80 | 1.90 | 2.00 | ||||||||||
| Nitrogen Recommended, pounds per acre | |||||||||||||||||||
| 2 | 136 | 123 | 109 | 96 | 83 | 70 | 57 | 44 | 30 | 17 | |||||||||
| 3 | 184 | 175 | 166 | 158 | 149 | 140 | 131 | 123 | 114 | 105 | |||||||||
| 4 | 208 | 201 | 195 | 188 | 183 | 175 | 169 | 162 | 155 | 149 | |||||||||
| 5 | 223 | 217 | 212 | 207 | 201 | 196 | 191 | 186 | 180 | 175 | |||||||||
| 6 | 230 | 226 | 223 | 219 | 215 | 210 | 206 | 201 | 197 | 193 | |||||||||
| 7 | 231 | 227 | 225 | 223 | 221 | 218 | 216 | 213 | 209 | 205 | |||||||||
| 8 | 232 | 228 | 226 | 224 | 222 | 219 | 217 | 214 | 210 | 206 | |||||||||
| 9 | 233 | 229 | 227 | 225 | 223 | 220 | 218 | 215 | 211 | 207 | |||||||||
| 10 | 234 | 230 | 228 | 226 | 224 | 221 | 219 | 216 | 212 | 208 | |||||||||
| 11 | 235 | 231 | 229 | 227 | 225 | 222 | 220 | 217 | 213 | 209 | |||||||||
| 12 | 236 | 232 | 230 | 228 | 226 | 223 | 221 | 218 | 214 | 210 | |||||||||
*The 150 pound N per acre limit on N rate recognizes that increasing rate is not the way to achieve higher yields in these soils. When a split N application is used (side-dress), use Table 6 for the total rate of preplant plus side-dress.
Potassium
Soil test potassium (K) values have been high for most soils in North Dakota until recently. With greater K removal with soybean and corn grain, soil test K levels have decreased in eastern North Dakota.
Recent K-rate research in North Dakota has shown that consideration of the clay chemistry in the soil is very important in predicting whether corn yield will increase with K if the soil test is lower than the critical level. The magnitude of yield increases in our K-rate studies probably was moderated by the amount of potassium feldspar as a portion of total minerals in the soil in the eastern part of North Dakota, where the studies were conducted (Figure 1).
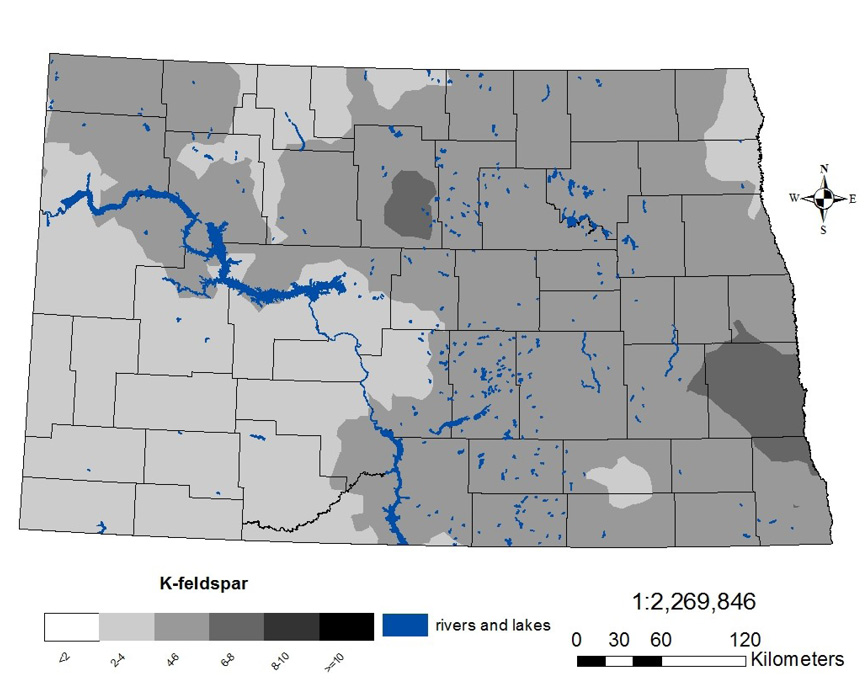

in spring 2017. Dark gray regions are greater than 3.5. White areas are less than 3.5.
Three major clay chemistries in the clay-fraction of North Dakota soils influence K availability: smectite, illite, and kaolinite and other related clays. Smectite and illite are referred to as “2:1” clays; in addition to their small size, clay particles also have a specific crystalline structure. The 2:1 clays have two sheets of silicon oxide; one above one sheet of aluminum hydroxide and one below the sheet of aluminum hydroxide, like a sandwich.
In Illites, the clay sheets are held rather tightly together with K+ ions. The edges of the illite can expand and contract with soil moisture differences, but most of the sheets are held together relatively tightly. Whether the soil is moist or dry, K+ ions are free to escape into the soil solution to maintain an equilibrium.
Smectite clays are also 2:1 clays, but the sheets are not held tightly by K+ ions; K+ ions are free to move in and out of the clay inter-layers. In moist soil conditions, K+ moves freely into the soil solution to maintain equilibrium, but when the soil dries, the clay layers collapse and draw K+ ions into the inter-layers, rendering them temporarily unavailable to plants.
Without using consideration of smectite and illite clays, the presently used dry K soil test only predicted corn yield response to K half of the time. If a smectite/illite ratio of 3.5 was used to separate sites, the dry K soil test predicted the K response in nearly all sites.
The new critical K soil test level for soils with a smectite-to-illite ratio greater than 3.5 is 200 ppm. The critical K soil test for soils with a smectite-to-illite ratio of less than 3.5 is 150 ppm. Figure 2 is a map showing regions in North Dakota where the smectite-to-illite ratio of the clay fraction of soil is less than or greater than 3.5.
The general recommendations for K fertilizer based on soil test for corn can be found in Tables 13, 14, 15 and 16. Our studies also found that rates of K2O greater than 120 pounds per acre resulted in lower yield than rates of 90 and 120 pounds per acre K2O; therefore, rates of K2O recommended are capped at 120 pounds K2O per acre.
Soybean harvest usually removes more K each year than corn, but corn is much more susceptible to K deficiency than soybean. Lower rates of K than those recommended in the tables will not result in the most economically achievable corn yield. Banding K in subsurface bands, such as those possible in strip-till shank applications, have been found beneficial in highly smectitic soils but not in soils with non-smectitic chemistry.
Potassium recommendations sometimes are given by sources other than NDSU based on the ratio of calcium and magnesium to potassium. These recommendations are based on poor soil fertility research and interpretation in Missouri and New Jersey in the late 1940s and early 1950s.
Despite the general soil fertility scientific community discarding these results, the concept of a “balanced soil” persists. Studies in several states indicate that the K extraction method, although not flawless, is a much better predictor of K requirement, compared with the balanced cation approach.
Growers should be aware that extraction of K in our soils often extracts calcium (Ca) and magnesium (Mg) from soluble salts and free lime in our soils, unrelated to Ca and Mg on the clay and organic matter particles. This will result in unreasonable cation-exchange capacity (CEC) values.
For example, a CEC test for a loam soil may be 30 millimhos per centimeter (mmhos/cm), where a true CEC value would be about 15 mmhos/cm. A very good review of the poor basis for the use of base exchange ratios for fertilization is available in Kopittke and Menzies (2007).
Table 13. Potassium recommendations for corn in soils with clay chemistry having a smectite-to-illite ratio greater than 3.5 and soil test K levels 150 ppm or less.
|
Corn price, $ per bushel |
Price per pound K2O, $ per pound |
|||||||||
|
0.125 |
0.20 |
0.30 |
0.40 |
0.50 |
0.60 |
0.70 |
0.80 |
0.90 |
1.00 |
|
|
Recommended pounds K2O per acre |
||||||||||
|
2 |
90 |
90 |
90 |
90 |
60 |
60 |
0 |
0 |
0 |
0 |
|
3 |
90 |
90 |
90 |
90 |
60 |
60 |
60 |
60 |
60 |
0 |
|
4 |
90 |
90 |
90 |
90 |
90 |
90 |
90 |
90 |
90 |
60 |
|
5 |
90 |
90 |
90 |
90 |
90 |
90 |
90 |
90 |
90 |
90 |
|
6 |
120 |
120 |
120 |
120 |
90 |
90 |
90 |
90 |
90 |
90 |
|
7 |
120 |
120 |
120 |
120 |
120 |
120 |
120 |
120 |
120 |
90 |
|
8 |
120 |
120 |
120 |
120 |
120 |
120 |
120 |
120 |
120 |
120 |
|
9 |
120 |
120 |
120 |
120 |
120 |
120 |
120 |
120 |
120 |
120 |
|
10 |
120 |
120 |
120 |
120 |
120 |
120 |
120 |
120 |
120 |
120 |
Table 14. Potassium recommendations for corn in soils with clay chemistry having a smectite-to-illite ratio greater than 3.5 and soil test K levels from 151 to 199 ppm.
|
Corn price, $ per bushel |
Price per pound K2O, $ per pound |
|||||||||
|
0.125 |
0.20 |
0.30 |
0.40 |
0.50 |
0.60 |
0.70 |
0.80 |
0.90 |
1.00 |
|
|
Recommended pounds K2O per acre |
||||||||||
|
2 |
90 |
90 |
60 |
60 |
60 |
0 |
0 |
0 |
0 |
0 |
|
3 |
90 |
90 |
90 |
90 |
60 |
60 |
60 |
0 |
0 |
0 |
|
4 |
90 |
90 |
90 |
90 |
90 |
90 |
90 |
60 |
60 |
0 |
|
5 |
90 |
90 |
90 |
90 |
90 |
90 |
90 |
90 |
90 |
60 |
|
6 |
120 |
120 |
120 |
120 |
90 |
90 |
90 |
90 |
90 |
90 |
|
7 |
120 |
120 |
120 |
120 |
120 |
120 |
120 |
120 |
120 |
90 |
|
8 |
120 |
120 |
120 |
120 |
120 |
120 |
120 |
120 |
120 |
120 |
|
9 |
120 |
120 |
120 |
120 |
120 |
120 |
120 |
120 |
120 |
120 |
|
10 |
120 |
120 |
120 |
120 |
120 |
120 |
120 |
120 |
120 |
120 |
Table 15. Potassium recommendations for corn in soils with clay chemistry having a smectite-to-illite ratio less than 3.5 and soil test K levels 100 ppm or less.
|
Corn price, $ per bushel |
Price per pound K2O, $ per pound |
|||||||||
|
0.125 |
0.20 |
0.30 |
0.40 |
0.50 |
0.60 |
0.70 |
0.80 |
0.90 |
1.00 |
|
|
Recommended pounds K2O per acre |
||||||||||
|
2 |
90 |
90 |
90 |
90 |
60 |
60 |
0 |
0 |
0 |
0 |
|
3 |
90 |
90 |
90 |
90 |
60 |
60 |
60 |
60 |
60 |
0 |
|
4 |
90 |
90 |
90 |
90 |
90 |
90 |
90 |
90 |
90 |
60 |
|
5 |
90 |
90 |
90 |
90 |
90 |
90 |
90 |
90 |
90 |
90 |
|
6 |
120 |
120 |
120 |
120 |
90 |
90 |
90 |
90 |
90 |
90 |
|
7 |
120 |
120 |
120 |
120 |
120 |
120 |
120 |
120 |
120 |
90 |
|
8 |
120 |
120 |
120 |
120 |
120 |
120 |
120 |
120 |
120 |
120 |
|
9 |
120 |
120 |
120 |
120 |
120 |
120 |
120 |
120 |
120 |
120 |
|
10 |
120 |
120 |
120 |
120 |
120 |
120 |
120 |
120 |
120 |
120 |
Table 16. Potassium recommendations for corn in soils with clay chemistry having a smectite-to-illite ratio less than 3.5 and soil test K levels from 101 to 149 ppm.
|
Corn price, $ per bushel |
Price per pound K2O, $ per pound |
|||||||||
|
0.125 |
0.20 |
0.30 |
0.40 |
0.50 |
0.60 |
0.70 |
0.80 |
0.90 |
1.00 |
|
|
Recommended pounds K2O per acre |
||||||||||
|
2 |
90 |
90 |
60 |
60 |
60 |
0 |
0 |
0 |
0 |
0 |
|
3 |
90 |
90 |
90 |
90 |
60 |
60 |
60 |
0 |
0 |
0 |
|
4 |
90 |
90 |
90 |
90 |
90 |
90 |
90 |
60 |
60 |
0 |
|
5 |
90 |
90 |
90 |
90 |
90 |
90 |
90 |
90 |
90 |
60 |
|
6 |
120 |
120 |
120 |
120 |
90 |
90 |
90 |
90 |
90 |
90 |
|
7 |
120 |
120 |
120 |
120 |
120 |
120 |
120 |
120 |
120 |
90 |
|
8 |
120 |
120 |
120 |
120 |
120 |
120 |
120 |
120 |
120 |
120 |
|
9 |
120 |
120 |
120 |
120 |
120 |
120 |
120 |
120 |
120 |
120 |
|
10 |
120 |
120 |
120 |
120 |
120 |
120 |
120 |
120 |
120 |
120 |
Corn Nutrient Deficiency Symptoms
A deficiency symptom is an indication that the crop is not well, but it is not a nutrient diagnosis by itself. For example, corn may show purpling of leaves early in the season, which can be a P deficiency symptom, but the purpling also can be any soil or environmental condition that reduces the rate of root growth, such as spring compaction, cold soils, very wet soil conditions and a tendency of purpling of certain hybrids. Therefore, a plant analysis, most often accompanied by a soil sample, except in the case of sulfur, from a “good” area and the “not-as-good” area most often will result in a diagnostic analysis.
Nitrogen Deficiency
Nitrogen deficiency symptoms can occur at any growth stage through ear development. Symptoms are yellowing lower leaves, starting at the leaf tip and following the midvein in a “V” pattern.

Phosphorus Deficiency
Phosphorus deficiency symptoms are purpling of leaves, with the lowest leaves most affected.

yellowing of lower leaf margins.
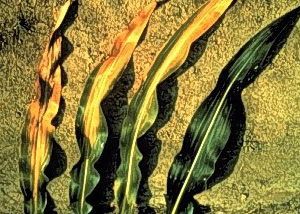
Potassium Deficiency Symptoms
Potassium deficiency symptoms are the result of low soil K, and they are intensified by dry soil conditions. The symptoms are yellowing of the leaf margins on older leaves. As the deficiency intensifies, the yellowing moves toward the leaf midvein, with the midvein the last leaf part to be affected.

Sulfur Deficiency
Sulfur deficiency symptoms are yellowing of upper leaves, often with a striped appearance.

Zinc Deficiency Symptoms
Zinc deficiency symptoms are stunted plants with broad striping on upper leaves.
References
Franzen, D. 2017. Soil Fertility Recommendations for Corn. NDSU Extension publication SF722.
Kopittke, P.M., and N.W. Menzies. 2007. A review of the use of the basic cation saturation ratio and the ‘ideal’ soil. Soil Science Society of America Journal 71:259-265.
Whitney, D.A. 1998. Micronutrients: zinc, iron, manganese and copper. In Recommended Chemical Soil Test Procedures for the North Central Region. North Central Regional Research Publication No. 221 (Revised).

The NDSU Extension Service does not endorse commercial products or companies even though reference may be made to trade names, trademarks or service names.
For more information on this and other topics, see https://www.ndsu.edu/agriculture/extension
NDSU encourages you to use and share this content, but please do so under the conditions of our Creative Commons license.
You may copy, distribute, transmit and adapt this work as long as you give full attribution, don’t use the work for commercial purposes
and share your resulting work similarly. For more information, visit www.ag.ndsu.edu/agcomm/creative-commons.
County commissions, North Dakota State University and U.S. Department of Agriculture cooperating. NDSU does not discriminate in its programs and activities on the basis of age, color, gender expression/identity, genetic information, marital status, national origin, participation in lawful off-campus activity, physical or mental disability, pregnancy, public assistance status, race, religion, sex, sexual orientation, spousal relationship to current employee, or veteran status, as applicable. Direct inquiries to Vice Provost for Title IX/ADA Coordinator, Old Main 201, NDSU Main Campus, 701-231-7708, ndsu.eoaa.ndsu.edu. This publication will be made available in alternative formats for people with disabilities upon request, 701-231-7881.