Title

Soil Testing Unproductive Areas

(SF1809, Revised November 2021)
File
Publication File:
Summary

This publication explains the soil health issues that turn productive areas into unproductive, how to correctly sample and test affected areas and interpret the soil results.

Lead Author
Lead Author:
Naeem Kalwar, Area Extension Soil Health Specialist
Other Authors

Tom DeSutter, Associate Professor; David Franzen, Extension Soil Science Specialist; Chris Augustin, Area Extension Soil Health Specialist

Availability
Availability:
Available in print from the NDSU Distribution Center.

Contact your county NDSU Extension office to request a printed copy.
NDSU staff can order copies online (login required).

Publication Sections

Is This Soil Saline, Sodic or Saline and Sodic?

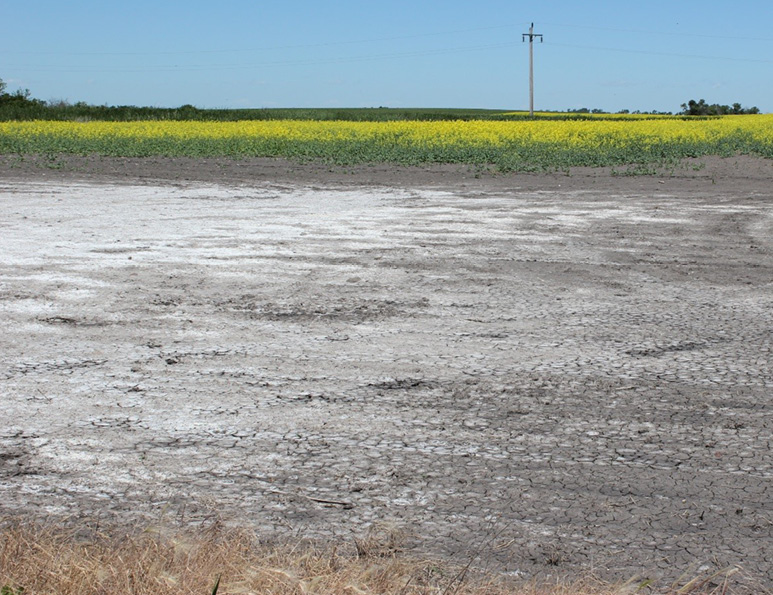
Most producers have areas in their fields that are not productive (Figure 1). High soluble salt levels (soil salinity) or excessive sodium levels (soil sodicity) are usually the cause.

salt affected soil
Figure 1. A salt-affected unproductive area next to productive land with canola in Walsh County, N.D.

A soil can be mapped as very fertile; however, it may not be productive due to high salinity and/or sodicity. Soils with high salinity and sodicity usually have adequate levels of essential plant nutrients because the nutrients are not being removed due to poor or no plant growth and low grain/fodder production, compared with more productive areas of the field.

The problem is not the low nutrient levels but an excess of soluble salts that restricts crop growth and accumulation of excessive sodium, causing sodicity that deteriorates soil structure.

The recent wet weather cycle experienced in this region since the early 1990s had led to high groundwater depths and, in many cases, resulted in saturated soils. Saturated soils do not allow for increased infiltration, so surface runoff will occur. Also, the soil environment is not conducive for plants and microorganisms because they require oxygen to respire, and the oxygen is limited due to the saturated conditions.

Because the groundwater in our region naturally contains high levels of soluble salts (CaSO4, MgSO4, Na2SO4), the ions of these salts (Ca2+, Mg2+, Na+, SO42-) either move with groundwater or wick with capillary water close to the soil surface. Once the water content becomes less than the solubility of the salts, the ions recrystallize and can be seen as “salts” on the soil surface or within the soil profile. High groundwater depths and saturated soil conditions happen frequently under wet weather, whereas increased capillary water movement, lower groundwater depths and drier surface soils are more prominent under dry weather.

In addition, under wet weather the gap narrows between total annual potential evapotranspiration and rain, which mostly results in more leaching of water-soluble salts and less movement of capillary water, whereas a wider gap between total annual potential evapotranspiration and rain generally result in less leaching and increased capillary water movement.

The increase in soil salinity and sodicity are serious soil health issues that result in poor crop yields and frequently leave affected areas bare of plant growth. Understanding how high salt and high sodium levels affect plants and soils, learning to recognize the visual symptoms, properly sampling the affected areas, knowing what soil tests and methods to ask for and understanding the results are crucial steps to remediate these areas for profitable crop production.

What Do Excessive Salts and Sodium Do to Plants and Soils?

Effect of High Soluble Salt Levels

Soluble salts are a combination of positively and negatively charged ions (for example, table salt, Na+Cl-). High levels of ions (both positive and negative) from soluble salts restrict normal water uptake by plant roots, even when soils are visibly wet, resulting in drought-stressed plants.

The underlying process that produces drought symptoms in the presence of normally adequate water is called the “osmotic effect.” Soil water moves from higher osmotic potential (lower or diluted salt levels) to lower osmotic potential (higher salt levels). Osmotic potential reflects how freely soil water can move from one point to another.

Water molecules have two positive charges supplied by two hydrogen (H+) atoms and one negative charge provided by one oxygen (O2-) atom. With their negative side, water molecules get attracted to positively charged ions and positive side of other water molecules (called cohesion). With their positive side, they get attracted to the negatively charged ions and soil particles such as clay and humus (called adhesion). High levels of soluble salts pull water molecules strongly toward them, thus resulting in lower osmotic potential.

In soils with low soluble salt levels, plant roots accumulate more salts in their root cell membrane than soil water and are able to pull (absorb) water. However, in soils with high salt levels (saline soils), the pull for water is strong within the soil itself and water doesn’t readily move toward plant roots.

Unlike sodic soils, saline soils having higher levels of calcium (Ca2+)-based salts will have good structure (high “tilth” qualities), resulting in considerably improved water movement through the soil profile. That happens as calcium (Ca2+) ions encourage aggregation of soil particles called flocculation (clumping together), resulting in well-defined pores through which water can move.

Effect of High Sodium Levels

In contrast to saline soils, pure sodic soils have extremely poor physical conditions (poor soil structure) with dense soil layers, resulting in very slow permeability of water and air through the soil profile.

The poor structure of sodic soils is due to three reasons:

■ High sodium levels in combination with low salt levels can promote “soil dispersion,” which is the opposite of flocculation. Ions such as sodium (Na+), cause the breakdown of soil aggregates (soil dispersion), resulting in poor soil structure (low “tilth” qualities). Forces that hold clay particles together with soil aggregates are weakened greatly when excessive sodium (Na+) ions are attached to the clay particles and when wet clay particles break away easily from soil aggregates.

■ As excessive sodium (Na+) ions attract clay and humus, more soil aggregates tend to disperse and released clay and humus particles then wash down the soil profile and clog soil pores.

■ When highly saturated with sodium (Na+) ions, the degree of the swelling of expanding-type clays (smectite) such as we have in the region increases. As these soils swell (expand), the larger pores responsible for water drainage are constricted (Brady, C.B., and Weil, R.R. 2008. Pages 420 and 422, Chapter 10, “The Nature and Properties of Soils,” 14th edition, revised).

Due to poor soil structure, when wet, sodic soils will be saturated longer than the non-sodic areas and when dry, they can be very hard.

Is My Soil Saline or Sodic?

Soils with very high soluble salt levels may show a white salt crust at the soil surface. When these soils are wet, the white crust does not show. Soils with a sodium problem usually do not have a white crust at the surface unless the soils also are affected by high soluble salts (saline and sodic soils).

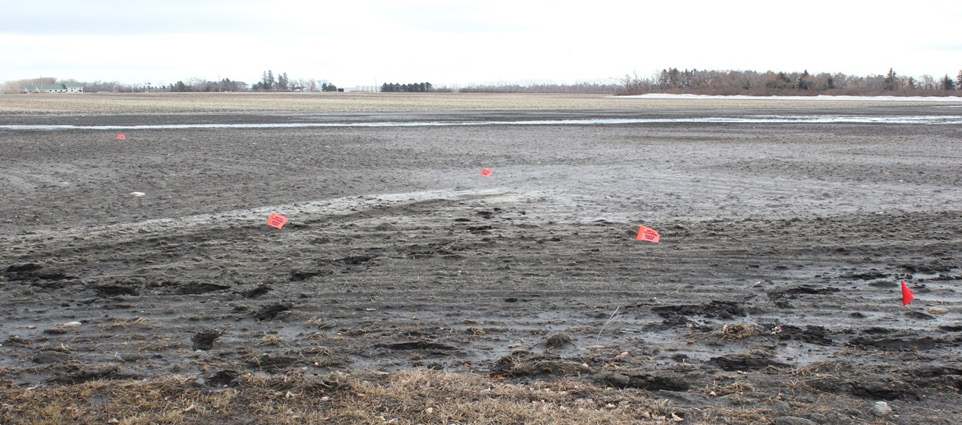
Soil sodicity doesn’t necessarily show clear symptoms at the soil surface, making it more difficult to diagnose casually (Figure 2). The best way to know if a field has sodicity issues is to take a soil sample and have it analyzed by a soil testing laboratory.

Saline-sodic field
Figure 2. This field near Langdon, N.D., has a saline-sodic area with no clear visual symptom
of sodicity at the soil surface.

Historically, ESP (exchangeable sodium percentage) or SAR (sodium adsorption ratio) tests have been used to analyze soils for sodicity, especially for research purposes. The ESP (exchanger phase) test, which is the amount of actual sodium (Na+), calcium (Ca2+), potassium (K+) and magnesium (Mg2+) adsorbed on the soil clay exchange sites, has been replaced by SAR in most of the regional soil laboratories through time. As a result, SAR values can be substituted for ESP (Oster et al., 1999).

However, because most soil testing laboratories in the northern Great Plains analyze samples for percentage of sodium (%Na), using %Na is an acceptable test to measure soil sodicity at the farm level (DeSutter et al., 2015). To determine soil salinity, samples are analyzed for electrical conductivity (EC).

How to Sample Problem Areas

Divide the Areas Into Zones

Before sampling, separate a field with problematic areas into zones based on visual observations and history of plant stands or crop yields (Figure 3). Some areas may support marginal stands, whereas some may be barren. They should be sampled separately based on their unique characteristics.

aerial photo with zone overlays based on visual observations for salinity and sodicity
Figure 3. An unproductive area with varying levels of salinity and sodicity divided into four zones based on visual observations, differences in elevation and cropping history at the Langdon Research Extension Center.

Separate samples should also be taken from areas that vary in elevation because the depths of topsoil and groundwater and levels of salts and sodium will vary from high to low areas. Mixing the samples from areas that are not similar will confound the results and only will provide an average for salt and sodium levels, which will not reflect the true characteristics of each area.

Sampling in zones will provide soil test results specific to each zone, which will contribute to the strategy needed to address the reclamation of the soils within each zone.

Sampling Method

Depending upon the size of a zone, each sample should consist of three to eight soil cores to adequately represent the zone (Figure 4). All cores representing a zone should be obtained from similar areas within that zone for the same depths in a soil profile. For example, if we are taking 4-foot deep samples in each zone, all three to eight cores should be from the 4-foot depth.

soil sampling using a hand-held auger
Figure 4. A soil core is being taken from a saline-sodic zone with a hand-held auger.

Regardless of the depth of sampling, the cores should be separated by no more than 12-inch increments. If taking a 4-foot sample and separating each by 1 foot, use four buckets: the first for mixing the 1-foot depth, the second for the 2-foot depth, third for the 3-foot depth and the fourth for the 4-foot depth. Each zone then will consist of four samples: a subsample from the three to eight cores at the 1-foot depth, the second from the 2-foot depth, the third for the 3-foot depth and fourth for the 4-foot depth.

Sampling Depth

Salts and sodium levels vary with soil depth. Sampling by depth within zones will help determine where the salt and sodium issue are (Figure 5).

soil samples in buckets
Figure 5. Soil depth is being separated in 12-inch increments.

Generally, salt and sodicity levels are higher in the first foot compared to the deeper depths; however, it can vary from site to site. In addition, soil depths having higher sodicity levels generally have high salt levels as well. That is due to poor soil water infiltration leading to reduced leaching of excess salts. Considering the rooting depth of most crops, areas with high salt and sodium levels should be sampled at least 3-feet deep in 12-inch increments. Sampling 4-feet deep in 12-inch increments would be better (Figure 6).

Four buckets of soil samples marked with depth they were taken
Figure 6. A 4-feet-deep sample is being separated in 12-inch increments.

For tiling, the sampling depth should match the deepest depth of the tiles (generally not more than 4-feet) in 12-inch increments. For detailed information, refer to the NDSU Extension publication SF1617, “Evaluation of Soils for Suitability for Tile Drainage Performance” (Revised July 2020).

What to Test For

Some soil properties, such as texture, do not change with time. However, other properties such as soil salinity and sodicity can change with time due to changes in climate, weather, rising groundwater depths, crop choices and tillage practices. The basic test needed to determine the levels of soluble salts is EC. For soil sodicity levels, researchers use the SAR test. Because the SAR test is time-consuming and expensive, at the farm level, %Na is an acceptable test to assess soil sodicity levels (DeSutter et al., 2015).

Other tests that help in developing a remediation strategy are soil pH, chloride (Cl-), sulfate (SO42-), carbonates (CO32-) and bicarbonates (HCO3-). Analyzing the samples for pH also is beneficial because it is a good indicator of the availability of plant nutrients and soil chemical properties. Soil pH results also will help determine a suitable amendment such as gypsum versus lime to remediate sodicity.

Because most of the soils in North Dakota are shrinking and swelling type of clays, if soil results for SAR are more than 5 and the EC is less than 2 millimhos per centimeter (mmhos/cm), movement of soil water may be restricted due to dispersion.

Remediating soil sodicity will require application of amendments that add free calcium (Ca2+) to the soils to raise Ca2+ levels versus Na+. For example, agricultural grade gypsum (CaSO4.2H2O) and lime (CaCO3) add Ca2+ directly to the soils, whereas elemental sulfur (S°) first gets oxidized to sulfate (SO42-) and then coverts into sulfuric acid (H2SO4) that dissolves Ca2+ already present in the soil.

To calculate the rates of soil amendments, soil cation exchange capacity (CEC) test also will be required in addition to SAR. Soil CEC values can be obtained from the Natural Resources Conservation Service’s Web Soil Survey or by analyzing the soil samples for the CEC test by using Na+ saturation and ammonium (NH4+) extraction method. Soil CEC values of areas with salinity issues analyzed by the summation or addition method generally will be much higher than the CEC values analyzed by the Na+ saturation and NH4+ extraction method and should not be used to calculate the rates of soil amendments. That is due to the addition of ions coming out of the excess salts.

Methods of Analysis

There are different methods to analyze soil samples for soluble salt and sodium-causing sodicity levels. For salts, for example, the EC values measured with the 1-to-1 soil-to-water method will result in lower values than the saturated paste extract method.

Depending upon soil texture, generally EC values determined through the saturated paste extract method are twice or more than the values obtained through the 1-to-1 method. However, the 1-to-1 method is much easier and less expensive to use, and it is the method most used by soil laboratories to evaluate soil salinity levels.

If soil textural values are known, then the formulas in Table 1 can be used as rough estimate to convert EC values determined through one method to the other. However, considerable variability exits around the conversion values.

Table 1. General conversion from 1-to-1 soil-to-water slurry method used by many commercial labs to the saturated paste extract method used in research applications.

X = EC of saturated paste extract Y = EC of 1:1 soil:water slurry

Soil Texture  Coarse Medium Fine
  X = 3.01y – 0.06 X = 3.01y – 0.77 X = 2.96y – 0.95
  Y = 0.33x + 0.06 Y = 0.33x + 0.77 Y = 0.375x + 0.97

Hogg, T.J., and Henry, J.L. 1984. Comparison of 1:1 And 1:2 Suspensions and Extracts with the Saturation Extract in Estimating Salinity in Saskatchewan Soils. Canadian Journal of Soil Science, 1984, 64(4): 699-704, 10.4141/cjss84-069.

For soil sodicity levels, researchers use the SAR test.

The SAR is a measure of the ratio of sodium (Na+) relative to calcium (Ca2+) and magnesium (Mg2+) in the water extract (solution phase) from a saturated soil paste (Eq. 1). The units of Ca2+, Mg2+ and Na+ are milliequivalent/liter [meq/L) or mmol(c)/L].

Equation 1

SAR =

[Na+]
------------------------
([Ca2+] + [Mg2+]) 
{------------------------

2} 1/2


The SAR test is laborious, time-consuming, costly and not performed on a routine basis. To make it cost- and time-effective, NDSU soil scientists conducted a study consisting of 1,974 soil samples in which SAR values were correlated against the %Na values (DeSutter et al., 2015). Research findings suggested a very strong correlation between SAR and %Na tests (r2 = 0.88), especially with SAR values of 20 or less by using the following formula (Eq. 2):

Equation 2

SAR = 1.15 * %Na – 0.91 (Eq. 2)

Considering the fact that the %Na test is performed on a routine basis for regular farm use (excluding research studies) apart from SAR, %Na test can be used to assess soil sodicity.

The %Na (solution + exchange phase) is the amount of sodium (Na+) in the 1M ammonium acetate extract from dissolved salts and adsorbed on soil
clay exchange sites, compared with the salt-derived and exchanger-derived base cations (Eq. 3). The units for Na+, Ca2+, Mg2+ and Kare cmol(+)/kg or meq/100g.

Equation 3

100 * Na+

%Na =
100 * Na+
—————————— 
Ca2+ + Mg2+ K+ Na+

Another example of analyzing a soil property by using different methods is the soil cation exchange capacity (CEC). The method used for true CEC determination (Na+ saturation and NH4+ extraction) is more expensive and complex, compared with the routine method used by soil testing laboratories (CEC by addition) in our region. However, cation exchange capacity analyzed by the addition method is artificially high when soluble salts are present as ions coming out of the salts are added.

Interpreting Soil Analysis Results

Soil Salinity

For classification purposes, a soil is considered as saline if the saturated paste extract electrical conductivity (EC) equals or exceeds 4 deciSiemens per meter (dS/m). However, in terms of crop production, even an EC of less than 4 dS/m can result in considerable yield loss, for example in the case of soybeans.

Soil EC is a measure of the concentration of ions from water-soluble salts in soils, and the test results are indicative of soil salinity. EC is the ability of a material to conduct an electrical current and it commonly is expressed as dS/m or millimhos/centimeter (mmhos/cm). One dS/m = 1 mmhos/cm.

Soil EC is inversely proportional to the electrical resistance in soil solution. EC is measured by passing an electrical current through the soil solution. Water-soluble salts in the solution enhance the transfer of electric current (electric conductance).

Note: An ohm is a unit of resistance and a mho is a unit of conductance. “Siemens” was adopted as a scientific representation of mho in an 1881 conference in England to honor a prominent scientist of the period who studied electrical conductance. Mho usually is used by lay soil scientists today, although dS usually is used in peer-reviewed scientific journals instead of mho.

Soil Sodicity

Soil SAR and %Na tests measure the levels of Na+ ions in soil water or at soil particle exchange sites and are indicative of soil sodicity.

Because most of the soils throughout North Dakota are shrinking and expanding type of clays, based on NDSU research, soils may start dispersing at a SAR of 5 or more, especially when EC is less than 2 mmhos/cm. Soil dispersion will result in slow soil water infiltration due to the deterioration of soil structure. Analyzing soils for sodium levels before installing tile drainage systems also is very important because dispersion could seal soil layers above or around tiles.

Note: Alternatively, %Na can be substituted for SAR (DeSutter et al., 2015) and SAR can be substituted for ESP in the range of 0 < SAR < 50 (Oster et al., 1999).

Management of Soil Salinity and Sodicity

Under wet weather, remediation of soil salinity and sodicity require lowering of groundwater depths. Once groundwater depths are lowered due to natural or artificially-installed drainage systems (tile drainage) and/or a salt-tolerant crop or perennial grass mix, excessive salts can be leached out of the saline soils with good soil structure and rainfall or snowmelt water. Under dry weather, groundwater depths generally lower naturally; however, it is important to reduce evaporation by establishing a suitable salt-tolerant vegetative cover and catch some timely rains. Sodic soils will require an extra step of applying soil amendments that supply calcium (Ca2+) to displace sodium (Na+) from the soil exchange sites and help leach it below the rooting zone.

Note: In order to create the desired chemical reaction for remediating sodicity, soil amendments need adequate rainfall and snowmelt water. If extreme dry weather persists, there may not be considerable reduction in soil sodicity even after the application of amendments.

In addition, areas that do not support crop growth may still allow salt/sodium-tolerant weeds, such as kochia and foxtail barley, to grow. These weeds can be allowed to grow and should be mowed or hayed before flowering to prevent them from going to seed. They will use excess water and lower groundwater depths under wet weather and reduce evaporation and intercept capillary water moving towards topsoil under dry weather.

Where to Send Soil Samples

Producers can send their samples to a commercial soil testing lab or the NDSU Soil Testing Laboratory for analysis.

The mailing address and phone number of the NDSU Soil Testing Laboratory is:
1360 Bolley Drive, Fargo, ND 58102

Phone: 701-231-8942

Email: ndsu.stl@ndsu.edu

For more information, visit the NDSU Soil Testing Laboratory

More information

For detailed information on the management of soil salinity and sodicity, we recommend these resources:

• “Managing Saline Soils in North Dakota” by Franzen et al., revised September 2019. (NDSU Extension publication SF1087)

• “Sodicity and Remediation of Sodic Soils in North Dakota” by Franzen et al., 2019. (NDSU Extension Publication SF1941)

• “Saline and Sodic Soils” by Naeem Kalwar, 2012.

• Extension soil and fertilizer publications

• :NDSU Soil Health 

References

Brady, C.B., and Weil, R.R. 2008. The Nature and Properties of Soils, 14th edition (revised), Chapter 10, p-420 and 422.

DeSutter, T., Franzen, D.W., He, Y., Wick, A., Lee, J., Deutsch, B., and Clay, D. 2015. Relating Sodium Percentage to Sodium Adsorption Ratio and Its Utility in the Northern Great Plains. Soil Sci. Soc. Am. J. doi:10.2136/sssaj2015.01.0010n.

Franzen, D.W. 2012. Managing saline soils in North Dakota. NDSU Extension publication 1087. Fargo, N.D.

Hogg, T.J., and Henry, J.L. 1984. Comparison of 1:1 and 1:2 Suspensions and Extracts with the Saturation Extract in Estimating Salinity in Saskatchewan Soils. Can. J. Soil Sci. 64: 699-704.

Oster, J.D., I. Shainberg and I.P. Abrol. 1999. Reclamation of salt-affected soils. Agricultural drainage. Agron. Monogr. 38. ASA, CSSA, SSSA, Madison, Wis.

Ray E.L., and David, A.W. 1992. Management of Saline and Sodic Soils. Kansas State University Agricultural Experiment Station and Cooperative Extension Service MF-1022.

Seelig, B.D. 2000. Salinity and Sodicity in North Dakota Soils. NDSU Extension publication 57.

Soil Survey Staff. 1999. Soil taxonomy: A basic system of soil classification for making and interpreting soil surveys. USDA NRCS Agric. Handbook 436. 2nd ed. U.S. Gov. Print. Office, Washington, D.C. Available at www.nrcs.usda.gov/Internet/FSE_DOCUMENTS/nrcs142p2_051232.pdf (verified November 29, 2021).

U.S. Salinity Laboratory Staff. 1954. L.A. Richards, editor, Diagnosis and improvement of saline and alkali soils. USDA Agric. Handbook 60. U.S. Gov. Print. Office, Washington, D.C.