2025: Comparing Conventional-Till vs No-Till in NE North Dakota
(Research Report, Langdon REC, December 2025)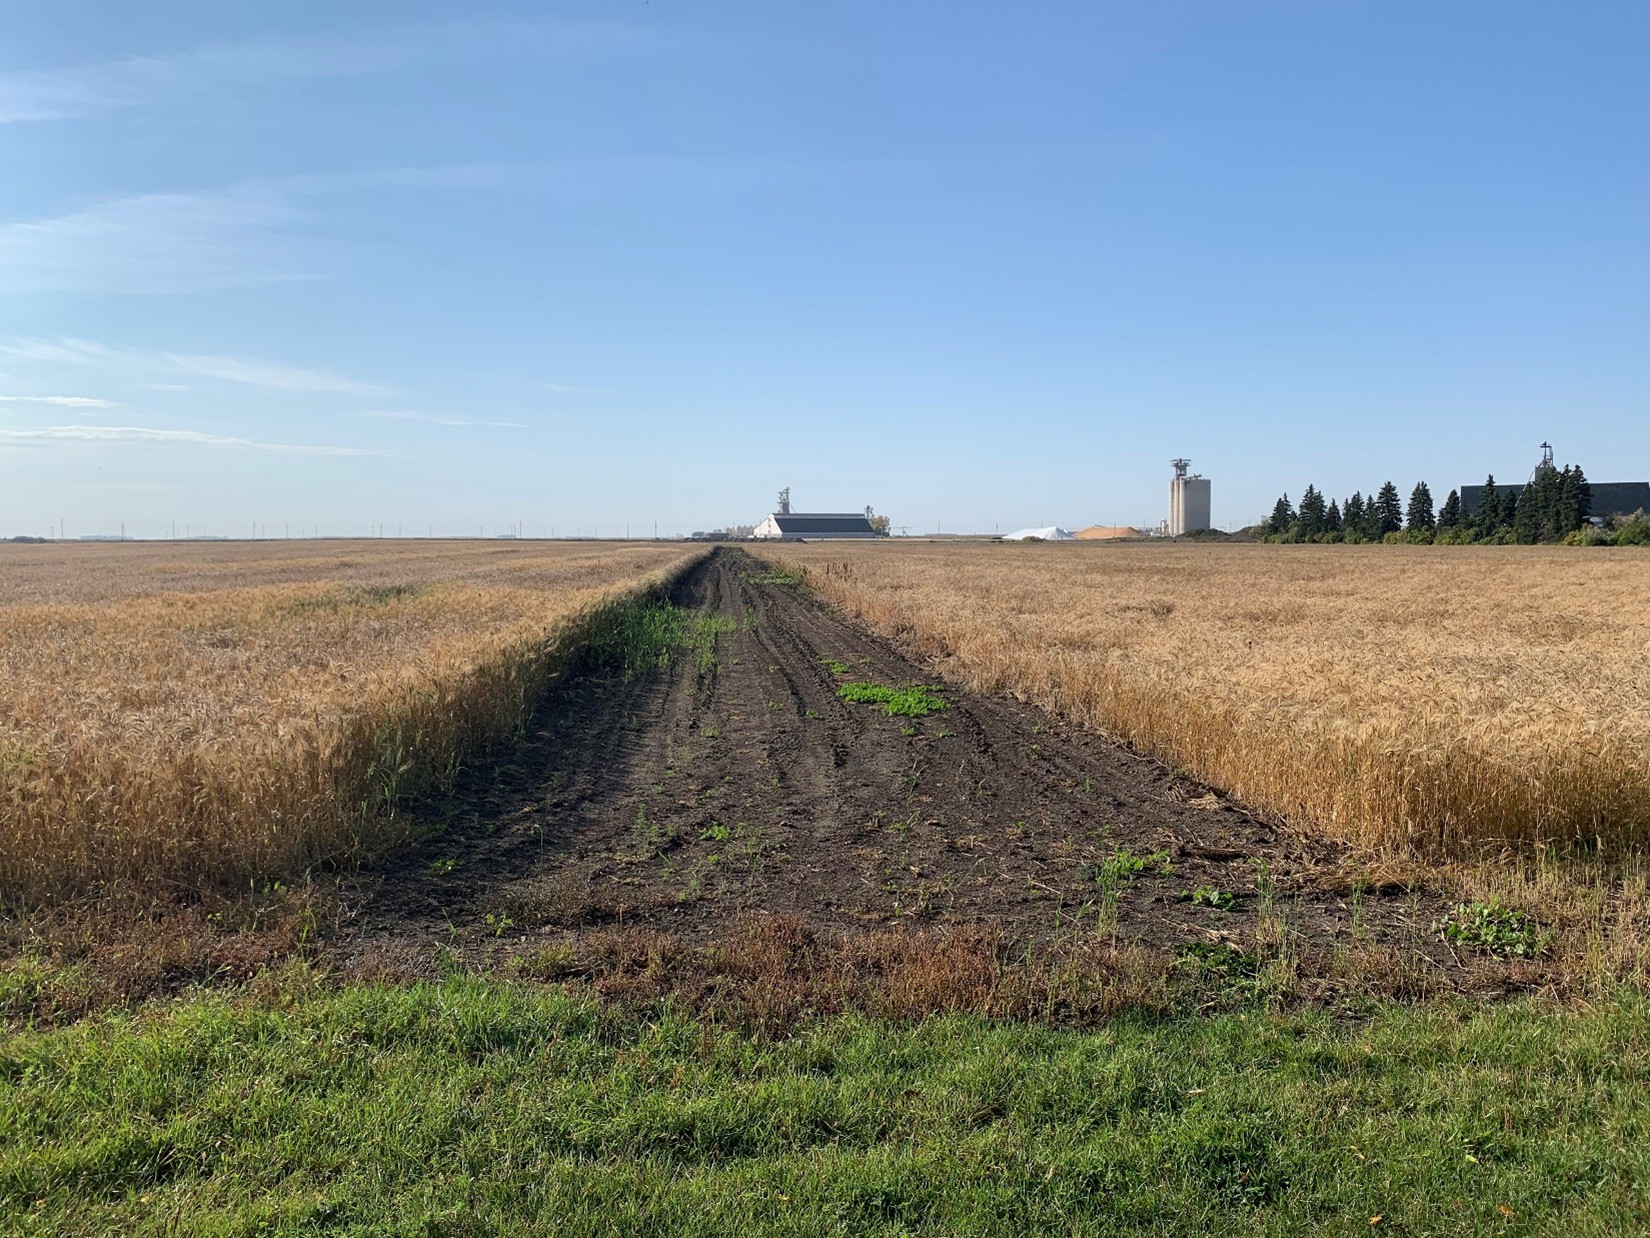
Figure 1. The Langdon Research Extension Center conventional-till versus no-till demonstration sites on September 29, 2025.
Conventional tillage practices and resulting topsoil disturbance and losses are well-documented. Early adopters of no-till in western North Dakota stopped performing tillage for planting several decades ago. Their main reasons were to conserve soil moisture, protect topsoil and build soil structure. In northeast North Dakota, most producers continue to till their soils in fall and spring. The primary reason is to dry the top four to six inches of soil, allowing for earlier planting. This practice is especially important because the region has a slightly shorter growing season than other areas of the state. According to the North Dakota Agricultural Weather Network (NDAWN), the Langdon area records the lowest accumulated growing degree days for crops such as canola, wheat, sunflower, and soybeans compared to NDAWN stations in Carrington, Dickinson, Fargo, Hettinger, Minot, and Williston.
Since 1993, a persistent wet weather cycle has made the transition to no-till farming in northeast North Dakota particularly challenging. Producers have become cautious about adopting no-till due to concerns over wet spring field conditions, which often delay planting. In a region with a short growing season, late planting can significantly reduce yields and complicate harvest, especially when compounded by wet falls or early frosts. Depending upon the soil type, landscape, and agronomic practices, it may take several years of no-till practices to improve soil structure, water infiltration and the challenges posed by a wet spring or fall. Many producers in the region have attempted no-till, but frequent issues like muddy and saturated fields, cooler soil temperatures and poor seedbeds have led to disappointing results. Additionally, muddy, or snowy conditions during fall harvests have further discouraged adoption. As a result, most producers reverted to conventional tillage after only one or two years, making it even more difficult for future adopters to successfully transition to no-till.
Objectives
Short-term objectives are to compare planting dates and document differences in input cost, germination, plant stand, yields, profits, and losses. Long-term objectives focus on evaluation of soil health, including salinity, sodicity, pH, structure, pore space, and water infiltration.
Site Details
A 35-acre field was divided into two rectangular sections oriented north to south: a 13.74-acre no-till site and a 20.67-acre conventional-till site, separated by a 15-foot border. Both sections include productive, marginal, and unproductive areas to accurately represent typical farm conditions. This project is a demonstration, not a replicated research trial.
Field Work Details
This report summarizes all activities conducted on the conventional-till and no-till sites since the demonstration began in fall of 2021, providing a comprehensive overview for readers.
Conventional-till
Fall-2021
- After harvesting soybeans, site was chiseled once on October 6.
Spring and Summer of 2022
- A uniform application of 125 pounds of urea nitrogen per acre was applied on May 29 followed by a single pass with a cultivator for incorporation.
- Fargo and Treflan (PPI) were applied on June 6 followed by two cultivator passes.
- Prosper (HRSW) was seeded 1.7 bushels per acre using a Concord 40-foot air seeder on June 7.
Fall-2022
- The site was swathed on September 19 and combined on September 28.
- The site was disked once on October 5.
Spring and Summer of 2023
- The site was cultivated and harrowed once. ND21008GT20 soybeans were then planted at seeding rate of 60 pounds/acre (174960 seeds/acre) on May 26, 2023.
- Roundup PowerMax 3 was applied at 30 ounces/acre + Kicker at 2.5 gallons/100 gallons of water at the rate of 10 gallons/acre on June 16.
- Roundup PowerMax 3 was applied at 30 ounces/acre + Kicker at 2.5 gallons/100 gallons of water at the rate of 10 gallons/acre on July 10th.
Fall-2023
- Site was straight combined on October 12.
- Site was chiseled on October 18 and again on October 19.
Spring and Summer of 2024
- Site was cultivated once on April 25.
- On May 18, 80 pounds of nitrogen and 60 pounds of P2O5 were applied using urea and monoammonium phosphate (MAP). The fertilizer was then incorporated into the soil with a single pass of the cultivar.
- The site was planted with foundation grade Faller HRSW with an air seeder at the rate of 100 pounds of wheat seed per acre on May 19.
- An herbicide blend of Everest 3.0, Husky FX, Starane Ultra and Cue adjuvant was sprayed on June 26.
- Prosaro Pro 400 SC fungicide was sprayed on July 16.
Fall-2024
- Site was straight combined September 26.
- Site was chiseled on October 1 and again on October 3.
Spring and Summer of 2025
- Site was cultivated once on May 28.
- On May 30, 148 pounds of nitrogen and 60 pounds of P2O5 were applied using urea and monoammonium phosphate (MAP). The fertilizer was then incorporated into the soil with a single pass of the cultivator.
- The site was planted with foundation grade Faller HRSW with air seeder at the rate of 114 pounds of wheat seed per acre on May 30.
- An herbicide mix of Tolvera, Vigil, IronGate and Cue adjuvant was sprayed on June 27.
Fall-2025
- Site was straight combined September 30.
- Site was chiseled on October 13 and again on October 25.
No-till
Spring and Summer of 2022
- On June 13, the no-till site was planted with Prosper (HRSW) using a John Deere 1895 no-till disk drill. Seeding rate was 1.7 bushels per acre. Due to equipment limitations, the drill could not apply high rates of fertilizer during planting, therefore, only 62.5 pounds per acre of N (136 pounds of urea per acre) was applied initially. To ensure the total nitrogen application matched the conventional-till site, the remaining 62.5 pounds of N per acre was top dressed.
- No-till field was sprayed with Roundup PowerMax 3 at 20 ounces/acre with Kicker (active ingredient ammonium sulfate) at 2.5 gallons per 100 gallons of water.
Fall-2022
- Site was swathed on September 19 and combined on September 28.
Spring and Summer of 2023
- The conventional-till site was planted on May 26, 2023, with ND21008GT20 (soybeans) at the seeding rate of 60 pounds/acre (174960 seeds/acre). Both the conventional and no-till fields were ready to plant the same day, but the no-till field planting was delayed until May 30, 2023 due to equipment issues.
- On May 31, Roundup PowerMax 3 at 20 ounces/acre mixed with 0.5 gallons of Flame per 100 gallons of water, was applied at a rate of 10 gallons/acre.
- On June 13, Roundup PowerMax 3 at 29 ounces/acre mixed with 16 ounces of Varisto + 24 ounces of Invade CNL + 24 ounces of Kicker/acre mixed in 100 gallons of water was applied at the rate of 10 gallons/acre.
- On June 30, Flexstar at 13 ounces + MSO at 35 ounces + Avatar at 6.6 ounces and Kicker at 70 ounces/acre was applied at 20 gallons/acre.
Fall-2023
- On October 13, approximately 70% of the no-till site (10 out of 14 acres) was straight combined. The remaining 30% (4 acres) could not be harvested due to extremely high weed pressure primarily kochia, green foxtail and volunteer spring wheat. This area was cleaned up using a combine to evenly distribute the remaining crop and weed residue.
- On October 22, Roundup PowerMax 3 at 30 ounces/acre mixed with 2,4-D at 19 ounces/acre and Kicker at 64 ounces/acre was sprayed at 10 gallons/acre.
Spring and Summer of 2024
- Site was sprayed with a mix of Paraquat 3SL, Roundup PowerMax3, Ammonium Sulfate and Vincitro (Non-ionic surfactant) pre-emergence herbicide on May 15.
- A total of 15 pounds of P2O5 with 100 pounds of nitrogen was banded on May 23. Due to equipment limitations, only half of the fertilizer could be banded with one-pass of the no-till drill and the remaining half of the fertilizer was banded at the time of planting foundation grade Faller HRSW at a rate of 100 pounds per acre.
- A mix of Everest 3.0 + Husky FX + Starane Ultra + Cue adjuvant was sprayed on June 21.
Fall-2024
- The site was swathed on September 5 and combined on September 26.
- A mix of Roundup PowerMax, Havok LV6, Valor SX herbicides and Kicker (AMS) was sprayed on October 16.
Spring and Summer of 2025
- Site was sprayed with a mix of Paraquat 3SL at 2 pints/acre, Sharpen at 3 fluid oz/acre, MSO (1 quart/a) and AMS (8.5 lbs./100 gallons of spray) on May 9.
- Due to a delay in planting because of rain and another flush of weeds emerged, site was resprayed with another round of Paraquat 3SL at 2 pints/a, Sharpen at 3 fluid oz/acre, MSO (1 quart/a) and AMS (8.5 lbs./100 gallons of spray) on May 30.
- 164 pounds of nitrogen and 20 pounds of P2O5 as monoammonium phosphate (MAP) and urea was applied, on May 30. Half of the fertilizer was broadcasted, and the other half was banded with the no-till drill.
- On May 30, the site was planted with foundation grade Faller HRSW using a John Deere no-till drill at a seeding rate of 114 pounds of wheat seed per acre.
- On June 3, the site was reseeded due to some skips caused by the John Deere no-till drill at a rate of 60 pounds.
- An herbicide mix of Tolvera, Vigil, IronGate and, Cue adjuvant was sprayed on June 27.
Fall-2025
- Site was straight combined on September 30.
- An herbicide mix of Glyphosate 0.75 lb. ae/acre + 2,4-D Ester 1.0 lb. ae/acre + Fierce EZ 9.0 fluid ounces/acre + HSMOC 1.5 pint/acre + AMS 17.0 lbs./100 gallons of water at 20 gallons/acre was sprayed on November 5, 2025.
Soil Sampling and Analysis
In the fall 2021-2024, the following soil sampling and analysis was performed.
- Separate composite four-foot-deep soil samples for 0-12”, 12-24”, 24-36” and 36-48” depths were taken from four locations: conventional-till productive ground (CT-PG), conventional-till unproductive ground (CT-UG), no-till productive ground (NT-PG) and no-till unproductive ground (NT-UG). In the fall-2021, these soil samples were analyzed for textural and chemical analysis. In subsequent years (fall-2022-2024), only chemical analysis was performed.
- Separate soil bulk density samples were taken from CT-PG, CT-UG, NT-PG and NT-UG for 0-5” and 5-10” depths in fall 2021-2025.
Soil Chemical Analysis Results
Between 2021 and 2024, soil EC (salinity) and SAR (sodicity) measurements revealed distinct difference between tillage practices and site productivity in the 0–12-inch soil depths. The conventional-till productive ground had very low to no salinity and sodicity issues. The conventional-till unproductive ground had low to high levels of salinity with moderate to high levels of sodicity. The no-till productive ground had low to moderately high salinity and low levels of sodicity while the no-till unproductive ground had high to very high levels of salinity and sodicity. Details are in Table 1.
Table 1. The 2021-2024 soil EC and SAR results for the conventional-till and no-till productive and unproductive sites at the 0-12, 12-24, 24-36 and 36-48-inch depths.
Site | Depth (inches) | 2021 | 2022 | 2023 | 2024 | 2021 | 2022 | 2023 | 2024 |
|---|---|---|---|---|---|---|---|---|---|
|
| EC (dS/M) | SAR | ||||||
Conventional-till PG | 0-12 | 2.44 | 0.95 | 0.86 | 1.11 | 2.06 | 1.46 | 1.35 | 4.70 |
12-24 | 4.90 | 0.67 | 2.23 | 2.57 | 3.99 | 3.58 | 1.53 | 10.86 | |
24-36 | 5.25 | 1.08 | 1.95 | 2.77 | 5.89 | 4.19 | 2.43 | 12.02 | |
36-48 | 2.09 | 1.17 | 1.44 | 2.36 | 7.67 | 5.53 | 4.58 | 11.60 | |
Conventional-till UG | 0-12 | 10.43 | 14.11 | 4.81 | 6.94 | 10.88 | 18.78 | 14.41 | 9.44 |
12-24 | 11.28 | 12.12 | 5.11 | 8.66 | 11.27 | 17.15 | 14.05 | 9.08 | |
24-36 | 10.39 | 8.05 | 4.16 | 7.97 | 11.36 | 16.05 | 11.11 | 9.33 | |
36-48 | 8.47 | 6.42 | 2.84 | 7.14 | 10.19 | 11.13 | 10.80 | 11.49 | |
No-till PG | 0-12 | 4.18 | 3.06 | 2.54 | 2.52 | 4.45 | 5.09 | 6.58 | 4.62 |
12-24 | 7.10 | 7.31 | 3.84 | 6.49 | 10.74 | 13.94 | 12.88 | 9.51 | |
24-36 | 8.16 | 9.69 | 2.91 | 8.36 | 18.11 | 21.80 | 18.48 | 10.77 | |
36-48 | 8.19 | 9.01 | 3.07 | 8.80 | 17.47 | 19.32 | 19.14 | 11.82 | |
No-till UG | 0-12 | 13.52 | 17.83 | 8.57 | 14.62 | 24.15 | 24.21 | 23.01 | 16.25 |
12-24 | 13.34 | 12.84 | 5.98 | 10.20 | 23.02 | 17.64 | 16.67 | 10.84 | |
24-36 | 11.82 | 11.45 | 5.43 | 10.22 | 23.50 | 15.96 | 16.69 | 10.05 | |
36-48 | 10.86 | 9.61 | 3.85 | 9.23 | 18.14 | 17.19 | 15.50 | 9.55 | |
Soil Bulk Density Analysis Results
Table 2. The 2021-2025 soil bulk density results for the conventional-till and no-till productive and unproductive sites for the 0-5, 5-10-inch depths.
| Soil Bulk Density (grams/cm3) | |||||
|---|---|---|---|---|---|---|
Site | Depth | 2021 | 2022 | 2023 | 2024 | 2025 |
(inches) | ||||||
Conventional-till PG | 0-5 | 1.36 | 1.34 | 1.23 | 1.14 | 1.41 |
5-10 | 1.26 | 1.44 | 1.39 | 1.51 | 1.39 | |
Conventional-till UG | 0-5 | 1.45 | 1.36 | 1.17 | 1.47 | 1.28 |
5-10 | 1.22 | 1.37 | 1.27 | 1.39 | 1.36 | |
No-till PG | 0-5 | 1.44 | 1.32 | 1.35 | 1.33 | 1.47 |
5-10 | 1.25 | 1.36 | 1.35 | 1.51 | 1.36 | |
No-till UG | 0-5 | 1.50 | 1.36 | 1.33 | 1.55 | 1.52 |
5-10 | 1.34 | 1.47 | 1.34 | 1.57 | 1.37 | |
Soil bulk density levels were relatively stable from 2021-2022, reached their lowest point in 2023, and peaked in 2025. Generally, the 0–5-inch soil layer had lower bulk density than the 5–10-inch level. However, in the no-till unproductive ground during 2021 and 2025, the 0–5-inch bulk density was higher than the 5–10-inch layer. Over time, no-till sites showed a trend of increasing bulk density compared to conventional-till sites, except in 2022. Additionally, unproductive ground consistently exhibited slightly higher bulk density than productive ground, likely due to elevated soil sodicity. Details are in Table 2.
Measurement of Soil Water Infiltration
Soil water infiltration rates were measured using a six-inch diameter ring, which was inserted into the surface soil. To simulate rainfall, 444 ml of deionized water was poured into the ring, representing one inch of rain. After the water fully infiltrated and no standing water remained, a second inch of rain was simulated by adding another 444 ml of deionized water. The time taken for each inch to be absorbed was recorded to assess infiltration rates. These measurements help evaluate differences in soil water absorption between conventional-till and no-till practices. Detailed annual infiltration rates for each site are presented in Table 3.
Table 3. The 2021-2025 soil water infiltration rates of the conventional-till and no-till productive and unproductive sites.
2021 | ||
|---|---|---|
Site | Time for infiltrating First-inch | Time for infiltrating Second-inch |
Conventionally-Tilled Productive Ground (CT-PG) | 53.18 seconds | 3 minutes and 3.29 seconds |
Conventionally-Tilled Un-productive Ground (CT-UG) | 36.45 seconds | 3 minutes and 33.87 seconds |
No-Tilled Productive Ground (NT-PG) | 2 minutes and 5.74 seconds | 8 minutes and 21.19 seconds |
No-Tilled Un-productive Ground (NT-UG) | 23 minutes and 1.88 seconds | 1 hour, 16 minutes and 20.97 seconds |
2022 | ||
Site | Time for infiltrating First-inch | Time for infiltrating Second-inch |
Conventionally-Tilled Productive Ground (CT-PG) | 1 minute and 17.83 seconds | 5 minutes and 58.50 seconds |
Conventionally-Tilled Un-productive Ground (CT-UG) | 3 minutes and 0.16 seconds | 12 minutes and 40.98 seconds |
No-Tilled Productive Ground (NT-PG) | 2 minutes and 57.55 seconds | 5 minutes and 35.16 seconds |
No-Tilled Un-productive Ground (NT-UG) | 26 minutes and 54.37 seconds | 1 hour, 20 minutes and 41.87 seconds |
2023 | ||
Site | Time for infiltrating First-inch | Time for infiltrating Second-inch |
Conventionally-Tilled Productive Ground (CT-PG) | 30.82 seconds | 4 minutes and 50.60 seconds |
Conventionally-Tilled Un-productive Ground (CT-UG) | 2 minutes and 08.37 seconds | 16 minutes and 59.58 seconds |
No-Tilled Productive Ground (NT-PG) | 1 minute and 30.03 seconds | 3 minutes and 38.96 seconds |
No-Tilled Un-productive Ground (NT-UG) Site-A | 4 hours, 41 minutes and 02.18 seconds | 18 hours and 58.05 seconds |
No-Tilled Un-productive Ground (NT-UG) Site-B | 1 hour, 20 minutes and 30.76 seconds | 5 hours, 20 minutes and 58.51 seconds |
2024 | ||
Site | Time for infiltrating First-inch | Time for infiltrating Second-inch |
Conventionally-Tilled Productive Ground (CT-PG) | 5 seconds | 36.08 seconds |
Conventionally-Tilled Un-productive Ground (CT-UG) | 6 minutes, 30.47 seconds | 30 minutes and 53.74 seconds |
No-Tilled Productive Ground (NT-PG) | 17 minutes and 33.93 seconds | 37 minutes and 36.86 seconds |
No-Tilled Un-productive Ground (NT-UG) | 8 hours, 12 minutes and 23.4 seconds | 46 hours, 41 minutes and 51.46 seconds |
Note:
| ||
2025 | ||
Site | Time for infiltrating First-inch | Time for infiltrating Second-inch |
Conventionally-Tilled Productive Ground (CT-PG) | 12.86 seconds | 1 minute and 11.15 seconds |
Conventionally-Tilled Un-productive Ground (CT-UG) | 39.14 seconds | 11 minutes and 47.24 seconds |
No-Tilled Productive Ground (NT-PG) | 11 minutes and 0.3 seconds | 17 minutes and 32.85 seconds |
No-Tilled Un-productive Ground (NT-UG) Site-A | 117 hours, 57 minutes and 23.43 seconds | NA |
No-Tilled Un-productive Ground (NT-UG) Site-B | 3 hours, 9 minutes and 45.57 seconds | 26 hours, 50 minutes and 5.26 seconds |
Note:
| ||
There have been a few key observations regarding soil water infiltration rates:
- In 2021-2025, soil water infiltration rates of conventional-till productive and unproductive grounds (despite moderately high sodicity in the 0–12-inch depth) were much faster than the no-till productive and unproductive grounds.
- On the no-till site, water infiltration was much faster on productive ground versus unproductive ground. That was an effect of higher sodicity level that causes soil dispersion resulting in dense soil layers and poor water infiltration.
- In 2023-2025, the no-till unproductive ground infiltration rates were much slower compared to 2021-2022.
From fall of 2023 to 2025, soil water infiltration rates were measured at two unproductive no-till ground sites: Site-A and Site-B. Measurements at Site-A showed much slower infiltration rates compared to 2021-2022, with water sometimes failing to infiltrate at all in 2025. To confirm these findings, additional measurements were taken at Site-B. While Site-B’s infiltration was still slower than those recorded in 2021-2022, they were somewhat faster than Site-A’s. For 2024, only results from Site-B are included in this report.
Growing-Season Observations
2022
The conventional-till side was planted six days earlier than the no-till side. However, the no-till side exhibited better germination, and more uniform plant stands. The conventional-till side had saturated soil a few inches below the soil surface and slightly poorer germination in the tire tracks. Plant stands were thin and remained green at the time of swathing. Despite the late planting, the no-till side had improved germination due to no soil disturbance and uniform stands. Equipment differences may also have contributed to these outcomes; the conventional-tilled side used a 40-foot air seeder, while the no-till side used a John Deere 30-foot no-till drill. Despite being planted later, the no-till side was harvested at the same time as the conventional-till side and yielded three bushels per acre more.
2023
Both the productive and unproductive areas under no-till management experienced severe weed infestations throughout the growing season of 2023. The primary weeds included herbicide-resistant kochia, volunteer wheat, green foxtail and horseweed. These issues persisted until fall and were expected to worsen in 2024 due to a larger seed bank in the no-till field compared to the conventional-till. A significant contributing factor was the southerly winds in fall 2022, which dispersed kochia seeds across both no-till and conventional-till fields, with some plants even accumulating in shelterbelt trees to the north. In spring, the conventional-till field was cultivated and harrowed, effectively eliminating most weeds. In contrast, the no-till field retained high populations of kochia and foxtail. While a pre-plant incorporated (PPI) herbicide might have improved weed control, its effectiveness depends on soil incorporation which is not an option on no-till. Several pre-emergence herbicides are suitable for no-till soybeans but also require rain for activation. The dry spring of 2023 likely reduced the efficacy of these treatments. The no-till field suffered from severe kochia contamination despite three herbicide applications compared to only two sprays and much lower weed pressure in the conventional-till field.
2024
In 2024, the no-till plots experienced extensive areas of poor and slow wheat germination, primarily due to heavy rains immediately after planting. These conditions resulted in saturated, cooler soils that led to drowned-out sections, especially when compared to the conventional-till field. The conventional-till field showed better germination, growth, and vigor, except in areas affected by excess moisture. As a result, the no-till field was at a disadvantage from the outset. Furthermore, regions within the no-till field that exhibited poor or no crop growth also faced higher weed pressure, whereas areas with successful wheat establishment had lower weed infestations. Overall, weed pressure in the no-till system was reduced in 2024 compared to 2023. The conventional-till field benefited from a stronger start, which ultimately contributed to higher yields.
2025
In 2025, the Langdon area received slightly less rainfall than the average growing-season total (16.27 inches compared to 17.96 inches, as recorded by the Langdon NDAWN Station). Although total rainfall was lower, rain events occurred more frequently, often disrupting field operations such as seedbed preparation, planting, spraying, swathing, combining and fall work. On the positive side, these light rains provided crops with needed moisture, preventing extended dry periods followed by heavy downpours. Both the conventional-till and no-till fields were planted on the same day (May 30). However, the no-till drill, which is older and prone to issues, left skips that required replanting, increasing production cost for the no-till system. Despite these challenges, no-till germination and early crop establishment appeared as good if not better than conventional-till. Nevertheless, no-till yields in 2025 were unexpectedly lower. Grain quality was also poor at harvest for both systems, as delayed combining led to sprouting and low falling numbers, despite crops reaching physiological maturity. These results suggest that equipment reliability and timely field operations are critical for optimizing no-till performance, and that frequent, light rains can both benefit and hinder crop production depending on timing and field conditions.
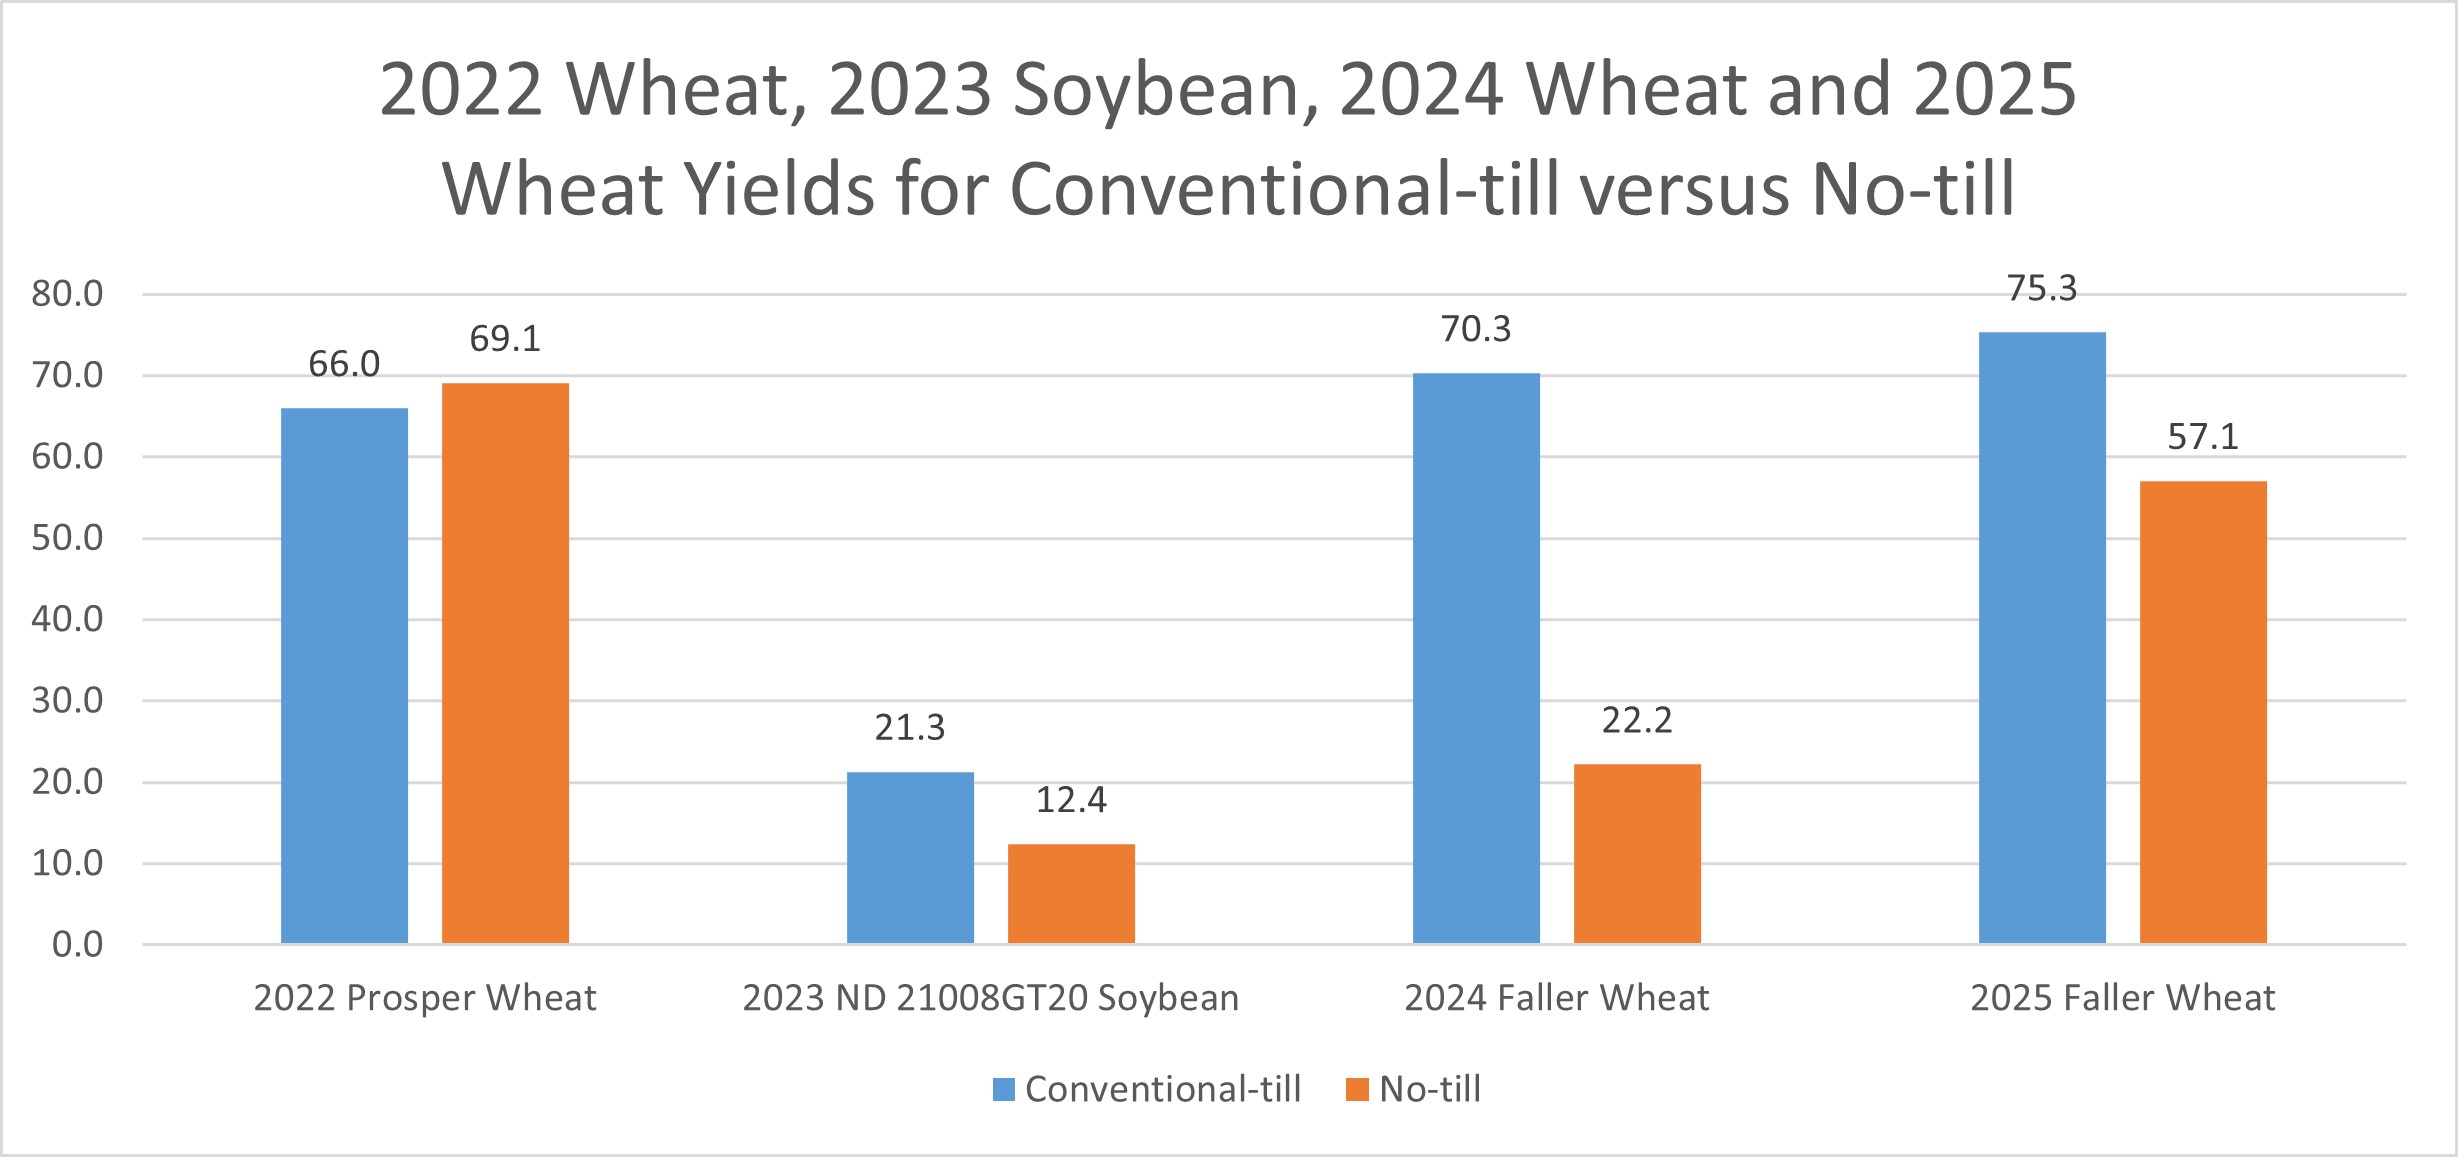
Yield Differences in 2021-2025
Since 2023, conventional-till consistently produced higher yield than the no-till. In 2023, lower no-till yield was a result of high weed pressure compared to conventional-till. In 2024, weed pressure was lower in no-till compared to 2023, however, heavy rains right after planting resulted in saturated, cooler soils and drowned out areas. These conditions caused poor germination and weak stands in large areas of the no-till field. In 2025, equipment issues with the no-till drill resulted in planting skips which contributed to slightly better conventional-till stands. Additionally, wheat lodging was more prevalent in the no-till field than in the conventional-till field. For detailed comparisons see Figure 2.
Figure 2. The Langdon Research Extension Center conventional-till versus no-till demonstration 2022-2025 yield comparisons.