2021: Determining the Economic Response of Sodic Soils to Remediation by Gypsum, Elemental Sulfur and Versalime in Northeast North Dakota on Tiled Fields
(Research Report, Langdon REC, December 2021)A research report from Langdon REC that evaluated the success of tiling on sodic or saline-sodic soils prior to starting salinity or sodicity remediation, the relationship between varying groundwater depths and resulting soil salt and sodicity levels, and the quality and suitability of water samples collected at the tile drainage lift station as well as upstream and downstream of the lift station for human and livestock health.
Introduction
Saline and sodic soils have been reported in North Dakota since the 1960s. NDSU Extension Bulletin No. 2 reported more than one million acres affected by high salt levels and more than two million acres, which had excessive levels of sodicity (Johnsgard, reprinted in 1974) in 1967. Another study estimated 5.8 million saline acres in North Dakota (Brennan and Ulmer, 2010). That is nearly 15% of the 39 million acres of cropland in North Dakota. Soil salinity and sodicity are a result of high salt and sodium (Na+) levels in the soil parent material and the underlying sodium-rich shale present in the bedrock below the soil sediments. Rising groundwater depths and capillary rise of soil water results in the accumulation of excessive soluble salts (salinity) and Na+ causing sodicity in the topsoil.
Saline soils will have excessive levels of soluble salts in the soil water, which are a combination of positively and negatively charged ions (for example, table salt; Na+Cl-). High levels of ions (positive and negative) from soluble salts restrict normal water uptake by plant roots, even when soils are visibly wet, resulting in drought-stressed plants (osmotic effect).
Saline soils having higher levels of calcium (Ca2+)-based salts will have good structure. That happens as Ca2+ ions encourage aggregation of soil particles called flocculation (clumping together), resulting in well-defined pores facilitating optimum water movement through the soil profile depending upon texture. Calcium ions are able to flocculate soil particles together as they act like a bridge between them due to being divalent. In addition, as they have smaller hydrated ionic sizes, Ca2+ ions hold on to the negative charges of soil particles tighter, so the bond is strong. Magnesium (Mg2+) ions are also divalent so they can promote flocculation, however, due to their bigger hydrated ionic sizes, the bond between soil particles and resulting soil structure is not as strong as in case of calcium.
In contrast to saline soils, sodic soils are highly saturated with Na+ ions at the soil cation exchange sites (negative charges of clay and humus particles that attract positively charged chemical ions). High Na+ levels compared to Ca2+ in combination with low salt levels can promote “soil dispersion”, which is the opposite of flocculation (Seelig, 2000). Soil dispersion causes the breakdown of soil aggregates, resulting in poor soil structure (low “tilth” qualities). Due to the poor soil structure, sodic soils have dense soil layers, resulting in very slow permeability of water through the soil profile. Due to poor soil structure, when wet, sodic soils will be gummy and may seem as if they have “no bottom” to them, and when dry, they can be very hard.
Note:
- If Na+ is present as a salt, it will not cause dispersion as the positive charges of Na+ ions will be neutralized by the negatively charged chemical ions such as sulfates (SO42-) or chloride (Cl-).
- However, due to the constant exchange of positively charged ions like Ca2+, Mg2+ and Na+ between soil water and the soil clay and humus particle negative charges, high levels of Na+ based salts in the soil water can result in sodicity as more negative charges will be saturated with Na+.
- Clayey soils will infiltrate water slower than sandy soils, however, higher sodicity levels can drastically reduce the soil water infiltration irrespective of soil texture. A clayey soil without dispersion issues will infiltrate water much faster than the same clay soil having dispersion.
Objectives
Remediation of soil sodicity requires application of amendments that add Ca2+ to the soil followed by salinity remediation practices of establishing a good vegetative cover to reduce evaporation and lowering the groundwater depths to desirable levels by promptly draining the excess soil water under wet conditions. The newly added Ca2+ will displace Na+ from the clay and humus particles (cation exchange sites) and Na+ moves into soil water where it converts into a salt (Na2SO4) and leaches out with rain or irrigation water. Once that happens, a combination of Ca2+ with clay/humus promotes flocculation resulting in improved soil aggregation, structure and infiltration.
An effective way to lower groundwater depths is to install a field tile drainage system. Since tiles are generally three to four-feet below the surface, the ability of a tile drainage system to drain excess soil water in a timely manner greatly depends upon how fast water moves or infiltrates through the soil layers above the tiles. This is especially important, if soils are suspected of having dispersion. That will require sampling and analyzing potential areas for salts, Na+ causing sodicity (dispersion) and pH up to the deepest proposed depth of tiles in one-foot increments. Salinity and sodicity levels can be determined by sampling the areas in question and getting the samples and depths analyzed by a soil laboratory for Electrical Conductivity or EC (for salinity) and Sodium Adsorption Ratio or SAR (for sodicity) by using the “saturated paste extract” method. If sodicity is established, in order to calculate the rates of soil amendments, samples will also need to be analyzed for cation exchange capacity (CEC) by using “sodium saturation, ammonium extraction” method. In case of high Na+ levels causing sodicity, not adding Ca2+ can render tiling ineffective. For detailed information on sampling and testing soils for salts and sodicity, please refer to the NDSU Publication: SF-1809; “Soil Testing Unproductive Areas”. Another NDSU publication that provides detailed information regarding the suitability of soils for tiling is: SF-1617 (revised July 2020); “Evaluation of Soils for Suitability for Tile Drainage Performance.”
Challenges for landowners considering tiling could be:
- What if soil sodicity levels are high in the fields they would like to tile?
- In cases of high sodicity levels, what should they do first, tile or apply the amendments?
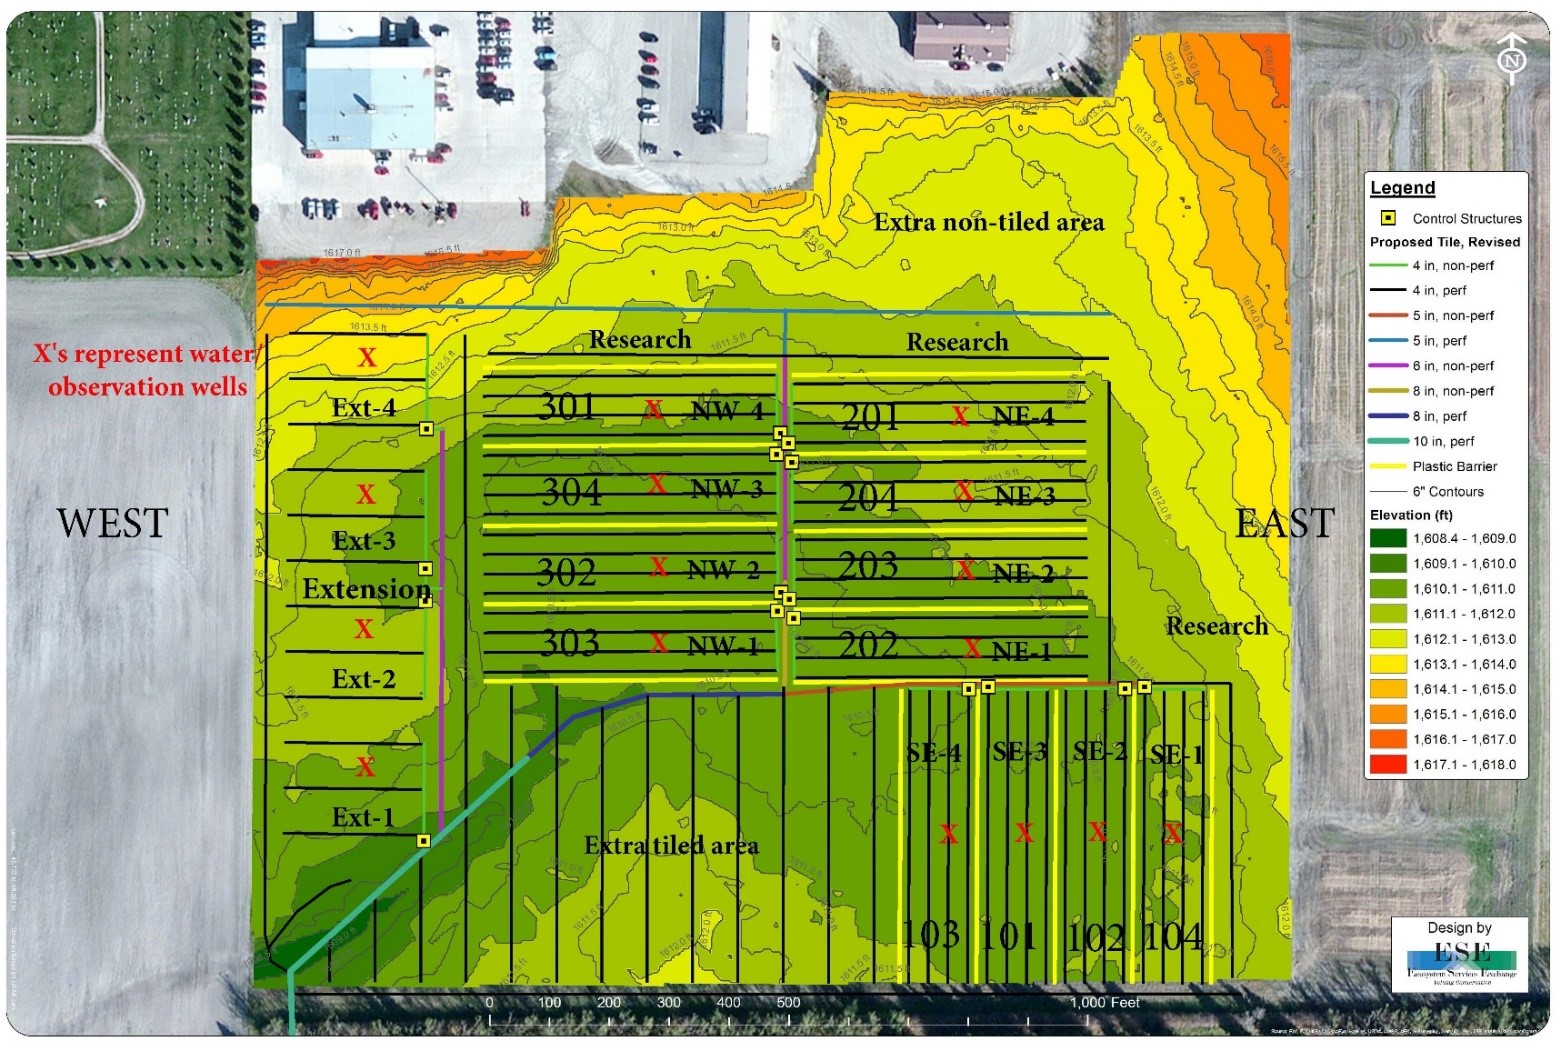
Due to the growing concerns of producers and landowners about the effects and effectiveness of tiling, the Langdon Research Extension Center (LREC) tiled a field that had excessive levels of sodicity and moderately high levels of soluble salts in July 2014. Layout included 12 research plots with three replications (Figure 1). In order to replicate field conditions, the project site was tiled prior to starting sodicity remediation. Remediation of the area was accomplished by applying soil amendments that are suitable and easily available to northeast North Dakota growers. Soil amendments were applied in July and August of 2015, one year after tiling.
The following objectives were set in order to achieve the research goals.
- Evaluate success of tiling on sodic or saline-sodic soils prior to starting salinity or sodicity remediation?
- Evaluate the relationship between varying groundwater depths and resulting soil salt and sodicity levels.
- Evaluate the quality and suitability of water samples collected at the tile drainage lift station as well as upstream and downstream of the lift station for human and livestock health.
Trial Location and Site Description
This trial site is located at the NDSU Langdon Research Extension Center, Langdon, North Dakota. Prior to tiling in 2014, site was conventionally tilled, fertilized annually and annual crops like soybean, spring-wheat and canola were planted without much success. Site is also one of the lowest areas at the Research Extension Center, which results in shallow groundwater depths, salinity and sodicity. These effects were maximized due to the poor germination and growth of the annual crops. As per the USDA Web Soil Survey, soil series is a mix of Cavour-Cresbard and Hamerly-Cresbard loams (Figure 2).
TRIAL DESIGN AND PLOT SIZE
Trial design is randomized complete block design. Each plot is 325 X 80 feet (0.6 acre).
Results and Discussion
Changes in the Annual and Growing-Season Weather
Changes in soil chemical, physical and biological properties are greatly influenced by the fluctuations in the weather such as growing-season evapotranspiration and rainfall and annual precipitation (Figure 3).
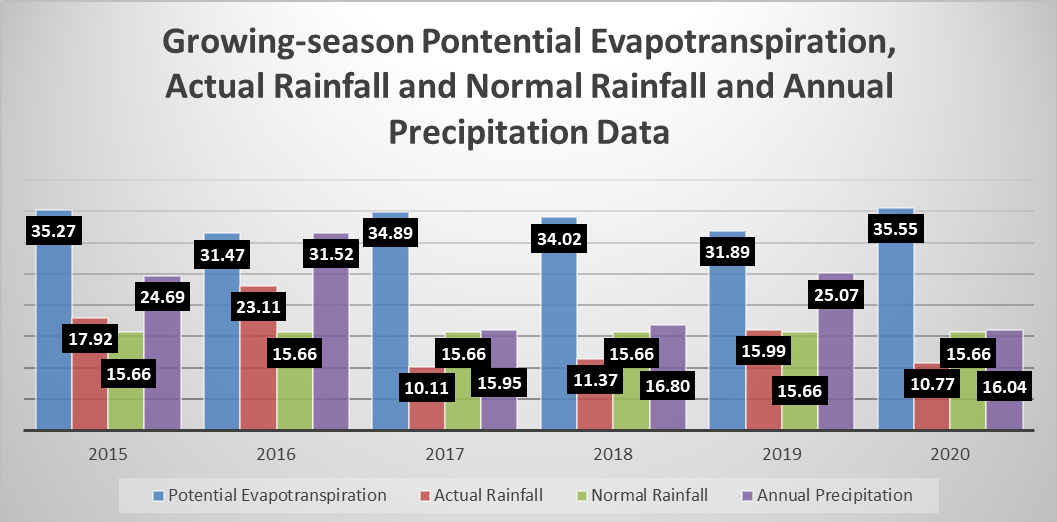
These changes affect air-to-water ratio in soil pores, how much water is available to plants versus free (gravitational) water, groundwater depths and capillary rise/movement of soil water just to name a few. However, considering the main objectives of the research trial, this report will focus the effects of changes in weather on groundwater depths and capillary rise/movement of soil water.
A wider gap between growing-season evapotranspiration and actual rainfall means increased capillary rise of soil water and less leaching of soluble salts. A narrower gap between them could result in shallower groundwater depths, however, under good soil water infiltration and improved drainage, excess salts can be moved out of the topsoil or affected fields. In addition, a narrower gap between growing-season evapotranspiration and actual rainfall will result in reduced capillary rise of soil water (wicking up). In 2016, the gap between evapotranspiration and rainfall was narrow, site was tiled and the soil water infiltration was still decent as higher levels of soluble salts were neutralizing the dispersion caused by sodicity. That resulted in the highest decrease in soil salt levels since the site has been tiled in 2014. In 2017, there was an increase in soil salt levels compared to 2016, which could be due to increased capillary rise of soil water due to a wider gap between annual evapotranspiration and actual rainfall despite tiled-land. That trend continued in 2018, 2019 and 2020.
Since annual precipitation includes snow along with other forms of water (liquid or solid), it is important to note that not all snow will turn into liquid water after melting. Depending upon how dry or wet snow is, there is a wide range for calculating how many inches of snow will actually melt into one inch of water.
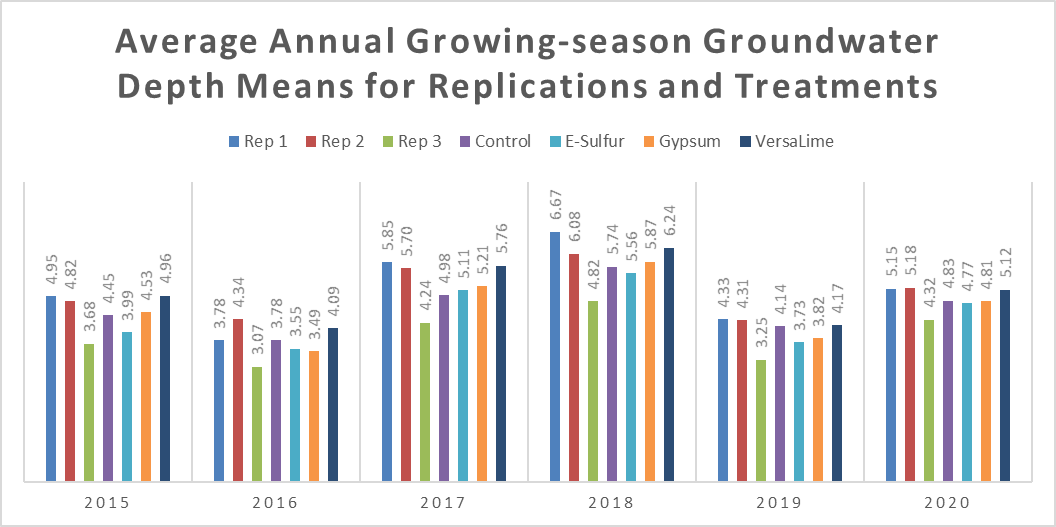
Figure 4 below has the average annual growing-season groundwater depth means for replications and treatments for 2015, 2016, 2017, 2018, 2019 and 2020. The means of groundwater depths represent actual annual measurements of groundwater depths measured from May 1 to October 31 on a weekly basis.
Changes in Soil Chemical Properties
Differences in Soil Electrical Conductivity (EC) Levels
Statistically, there were significant differences in the annual soil EC (dS/m) levels in replications, treatments and soil depths (Figure 5).
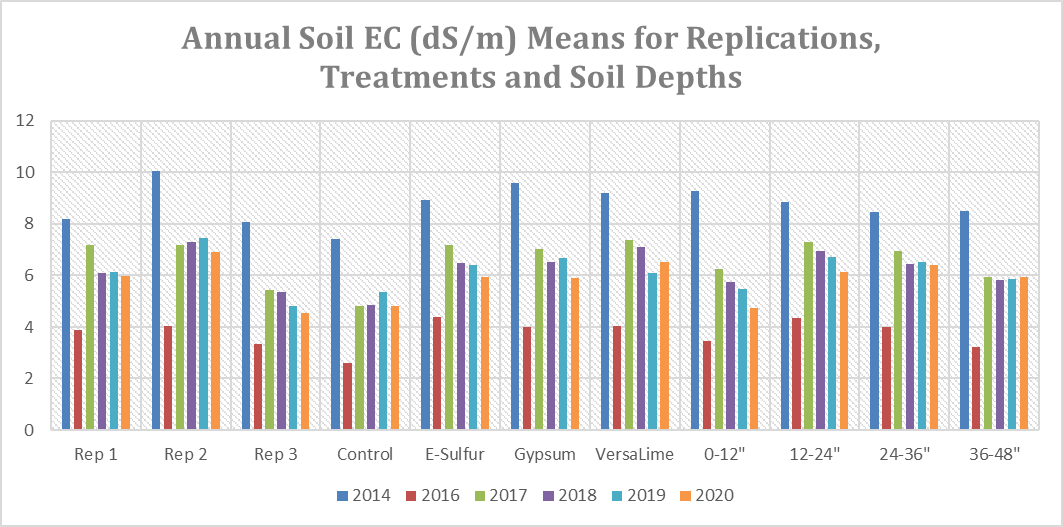
At the time of tiling in 2014, replication 2 had significantly higher EC levels compared to replications 1 and 3. Overall, EC levels in all three replications remained high in 2014 versus rest of the years, whereas, 2016 EC levels were the lowest in all replications versus the EC levels during 2014, 2017, 2018, 2019 and 2020.
In 2014, Gypsum and VersaLime treatments had significantly higher EC levels compared to control, which also had numerically lower EC levels compared to E-Sulfur treatment. Except gypsum and VersaLime treatments in 2016, EC levels in control treatment decreased significantly in 2016 versus EC levels in E-sulfur treatment in 2016 and all of the treatments in 2014, 2017, 2018, 2019 and 2020. In addition, gypsum and VersaLime treatments in 2016 had significantly lower EC levels compared to rest of the annual treatments except control treatment in 2017, 2018, 2019 and 2020 and E-sulfur treatment in 2016. Overall, EC levels in all treatments were high in 2014 and low in 2016. Despite decrease in 2016, EC levels increased back in 2017 and that trend continued in 2018, 2019 and 2020 due to drier weather and resulting capillary rise (wicking up) of soil water.
In 2014, 0-12 inch soil depth had the highest EC levels followed by 12-24, 36-48 and 24-36 inch depths. However, this trend was not consistent in 2016, 2017, 2018, 2019 and 2020 and EC levels fluctuated for soil depths. In 2016 and 2017, highest EC levels were observed in 12-24 inch depth followed by 24-36, 0-12 and 36-48 inch depths. In 2018 and 2019, 12-24 inch depth had the highest EC levels followed by 24-36, 36-48 and 0-12 inch depths. Whereas, in 2020, 24-36 inch depth had the highest EC levels followed by 12-24, 36-48 and 0-12 inch depths. Overall, like replications and treatments, EC levels in all soil depths in 2014 were higher than rest of the years, whereas, 2016 EC levels were the lowest for all soil depths.
In addition, there were some interesting effects of annual growing-season rainfall and total potential evapotranspiration (Penman) on resulting average annual growing-season groundwater depths and capillary water rise/movement on soil EC levels. (Table 3).
The 2016 EC levels were lower than the EC levels in 2014, 2017, 2018, 2019 and 2020 because of the highest annual growing-season rainfall (23.11 inches) under shallowest average annual growing-season groundwater depths (Figure 4). The average annual growing-season groundwater depths lowered in 2017, 2018 and 2020 compared to 2016 due to the drier weather, which also resulted in increased capillary rise of soil water and higher EC levels. The lower groundwater depth trend continued in 2019 during early part of the growing-season. However, weather started getting wet later in the season and 5.87 inches of rain was recorded during September versus a normal of 1.81 inches. Overall, 9.74 inches of rain was recorded between July 31st and October 5th versus a normal of 4.76 inches.
Overall, EC levels remained the highest in 2014 followed by 2017, 2018, 2019, 2020 and 2016, replication 2 had the highest EC levels followed by replications 1 and 3, VersaLime treatment had the highest levels followed by gypsum, E-sulfur and control treatments and 12-24 inch soil depth had the highest EC levels followed by 24-36 inch, 36-48 inch and 0-12 inch depths.
Differences in Soil Sodium Adsorption Ratio (SAR) Levels
Statistically, there were significant differences in the annual soil SAR (sodicity) levels in treatments and soil depths (Figure 6).
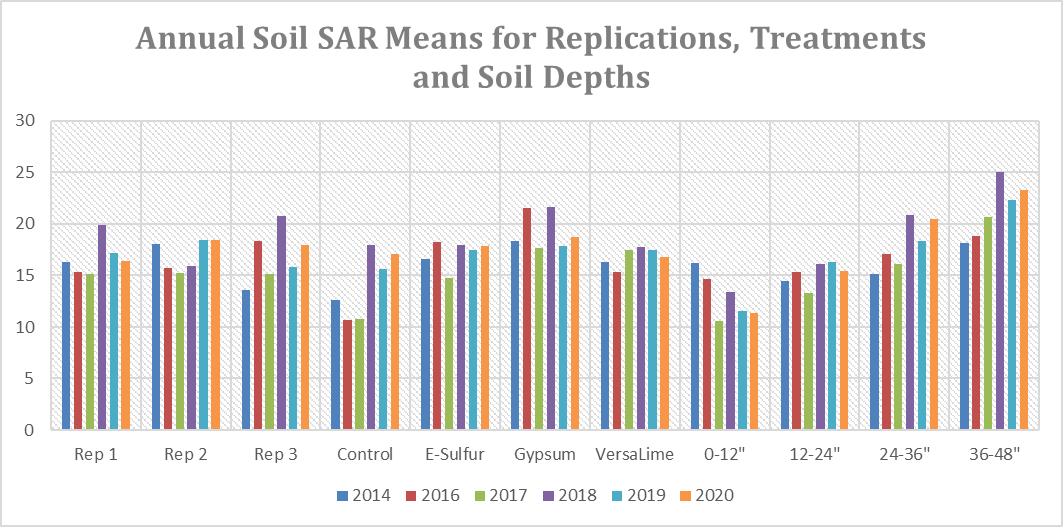
At the time of tiling (2014), gypsum treatment had significantly higher SAR levels versus control treatment. In addition, gypsum treatment in 2016 and 2018 had significantly higher SAR levels versus control treatment in 2014, 2016, 2017 and 2019, VersaLime treatment in 2014, 2016 and 2020 and E-sulfur treatment in 2014 and 2017. Whereas, control treatment in 2016 and 2017 had significantly lower SAR levels versus rest of the treatments in all years except control in 2014, VersaLime in 2016 and E-sulfur in 2017.
Except 2014 (at time of tiling), there was a consistent trend in SAR levels for soil depths in rest of the years and highest SAR levels were observed in 36-48 followed by 24-36, 12-24 and 0-12 inch depths. That means SAR levels increased with soil depth in 2016, 2017, 2018, 2019 and 2020.
Unlike soil EC, there were no noticeable effects of annual growing-season rainfall and potential evapotranspiration (Penman) on resulting average annual growing-season groundwater depths and capillary water rise/movement on soil SAR levels.
Overall, highest SAR levels were recorded in 2018 followed by 2020, 2019, 2016, 2014 and 2017, replication 2 had the highest SAR levels followed by replications 3 and 1, gypsum treatment had the highest levels followed by E-sulfur, VersaLime and control treatments and 36-48 inch soil depth had the highest SAR levels followed by 24-36 inch, 12-24 inch and 0-12 inch depths.
Differences in Soil pH Levels
Statistically, there were significant differences in the annual soil pH levels in replications, treatments and soil depths (Figure 7).
At the time of tiling (2014) all of the replications had lower pH levels versus the pH levels in 2016, 2017, 2018, 2019 and 2020. The lower soil pH levels in 2014 can be attributed to the lower soil moisture levels at the time of sampling (September 2014) compared to rest of the years when samples were taken in June.
Similarly, 2014 pH levels of all treatments were lower versus rest of the years in all treatments. Again, that could be attributed to the lower soil moisture levels at the time of sampling (September 2014) compared to rest of the years.
There was identical trend in soil pH levels for soil depths like SAR. Except 2014 (at time of tiling), highest pH levels were observed in 36-48 inch soil depth followed by 24-36, 12-24 and 0-12 inch depths in rest of the years. That means pH levels increased with soil depth in 2016, 2017, 2018, 2019 and 2020. Increase in pH with soil depth was due to the increase in soil moisture levels. Since soil moisture levels had a prominent effect on soil pH, annual growing-season rainfall and potential evapotranspiration (Penman) and resulting groundwater depths and capillary water movement also had an effect on soil pH.
Overall, pH levels remained the highest in 2018 followed by 2019, 2017, 2016, 2020 and 2014 and replication 3 had the highest pH levels followed by replications 2 and 1. That is interesting as generally, replication 3 has the shallowest average annual growing-season groundwater depths followed by replications 2 and 1 every year. The VersaLime and gypsum treatments had the highest pH levels followed by control and E-sulfur treatments and 36-48 inch soil depth had the highest pH levels followed by 24-36 inch, 12-24 inch and 0-12 inch depths.
Differences in Soil Nitrate-Nitrogen (NO3—N) Levels
Statistically, there were significant differences in the annual soil NO3--N (pounds/acre) levels in replications, treatments and soil depths (Figure 8).
The 2014 (at the time of tiling) soil NO3--N levels in replications 3 and 2 were significantly higher than replication 1 in 2014 and all of the replications in 2016, 2017, 2018, 2019 and 2020. In addition, replication 1 in 2014 had significantly higher NO3--N levels versus rest of replications in other years except replications 3 and 2 in 2014 and replications 1 and 2 in 2016.
The 2014 soil NO3--N levels in E-sulfur, gypsum and control treatments were significantly higher than the levels in all four treatments in rest of the years. In addition, VersaLime treatment in 2014 had significantly higher NO3--N levels versus rest of the treatments in 2016, 2017, 2018, 2019 and 2020 except NO3--N levels in E-sulfur, gypsum and control treatments in 2014 and E-sulfur treatment in 2016.
At the time of tiling (2014), 0-12 inch soil depth had significantly higher NO3--N levels versus 12-24, 24-36 and 36-48 inch depths in 2014 and all of the depths in rest of the years. In addition, 12-24 inch depth in 2014 had significantly higher NO3--N levels versus all depths in rest of the years except 0-12 inch depth in 2014 and 0-12 and 12-24 inch depths in 2016.
Higher NO3--N levels prior to tiling (2014), could be due to the annual fertilization this site received at the time of planting. In addition, a steady decline in soil NO3--N levels may also be due to leaching, removal by the perennial grass mix and no application since 2014. Since NO3--N is very susceptible to leaching, annual growing-season rainfall and resulting average annual growing-season groundwater depths may also have prominent effects on NO3--N levels.
Overall, NO3--N levels remained the highest in 2014 followed by 2016, 2017, 2020, 2019 and 2018, replication 2 had the highest NO3--N levels followed by replications 3 and 1, E-sulfur treatment had the highest levels followed by control, gypsum and VersaLime treatments and 0-12 inch soil depth had the highest NO3--N levels followed by 12-24 inch, 24-36 inch and 36-48 inch depths.
Differences in Soil Phosphorous (P) Levels
Differences in soil P (ppm) levels are shown in Figure 9. Statistically, there were significant differences in the annual soil P (ppm) levels in soil depths only.
The 0-12 inch soil depth had significantly higher P levels versus 12-24 inch depth in all years. In addition, 0-12 inch depth in 2016 had significantly higher P levels versus 0-12 inch depth in 2018, 2019 and 2020.
Overall, P levels remained the highest in 2014 followed by 2016, 2017, 2018, 2019 and 2020, replication 3 had the highest P levels followed by replications 2 and 1, VersaLime treatment had the highest levels followed by control, gypsum and E-sulfur treatments and 0-12 inch soil depth had the highest P levels followed by 12-24 inch depth.
It is also important to note that like nitrogen, no phosphate fertilizer has been applied to the site since 2014. Before 2014, site was planted with annual crops and commercial fertilizers were applied annually. That is evident from a steady decline in soil P levels every year.
Differences in Soil Organic Matter Percent (SOM) Levels
Soil organic matter (%) levels are shown in Figure 10. Statistically, there were significant differences in the annual O.M. levels in replications and soil depths.
In 2016, replication 1 had significantly higher O.M. levels versus replications 1, 2 and 3 in 2017, 2019 and 2020. In addition, replication 1 in 2018 had significantly higher O.M. levels versus replication 1 in 2017 and 2019 and replications 2 and 3 in 2017, 2019 and 2020.
The 0-12 inch soil depth had significantly higher O.M. levels than the 12-24 inch depth in all years. There were also some significant differences in the annual O.M. levels within the 0-12 inch depth. The O.M. levels in 2016 and 2018 in 0-12 inch soil depth were significantly higher than the levels in 0-12 inch depth in 2014, 2017, 2019 and 2020. In addition, 2014 O.M. levels in 0-12 inch soil depth were significantly higher than the levels in the same depth in 2017, 2019 and 2020. The 12-24 inch depth had significantly higher O.M. levels in 2014, 2016 and 2018 versus 2017, 2019 and 2020 for the same depth. In addition, 2019 and 2020 O.M. levels in 12-24 inch depth were significantly higher than the levels in 12-24 inch depth in 2017.
Overall, O.M. levels remained the highest in 2014, 2016 and 2018 followed by 2019, 2020 and 2017, all replications and treatments had roughly the same O.M. levels and 0-12 inch soil depth had the highest O.M. levels followed by 12-24 inch depth.
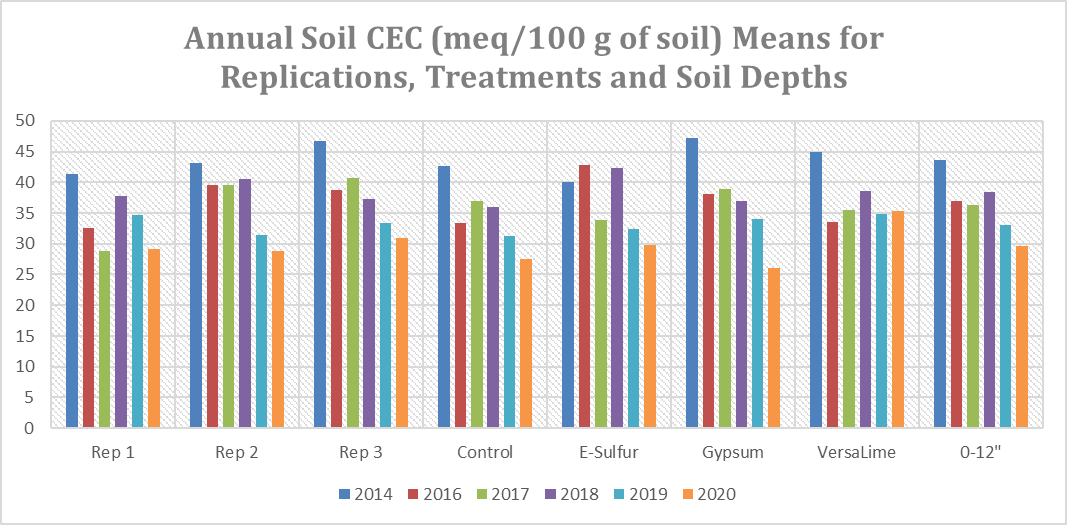
Differences in Soil Cation Exchange Capacity (CEC) Levels
Soil cation exchange capacity (meq/100 g of soil) levels are shown in Figure 11. Statistically, there were significant differences in the annual soil CEC levels in replications, treatments and in the 0-12 inch soil depth.
Replication 3 in 2014 had significantly higher CEC levels versus replication 1 in 2016, 2017, 2019 and 2020, replication 2 in 2019 and 2020 and replication 3 in 2018, 2019 and 2020. In addition, replication 2 in 2014 had significantly higher CEC levels versus replication 1 in 2016, 2017 and 2020, replications 2 and 3 in 2019 and 2020, whereas, replication 1 in 2014 had significantly higher CEC levels versus replication 1 in 2017 and 2020, replication 2 in 2019 and 2020 and replication 3 in 2020.
The gypsum treatment CEC level in 2014 were significantly higher than the levels in control treatment in 2016, 2018, 2019 and 2020, gypsum treatment in 2019 and 2020, VersaLime treatment in 2016, 2017, 2019 and 2020 and E-sulfur treatment in 2017, 2019 and 2020. In addition, VersaLime treatment in 2014 had significantly higher CEC levels versus control treatment in 2016, 2019 and 2020, gypsum treatment in 2020, VersaLime treatment in 2016 and E-sulfur treatment in 2019 and 2020.
The 0-12 inch soil depth in 2014 had significantly higher CEC levels versus CEC levels in 2016, 2017, 2019 and 2020. In addition, 2018 CEC levels were significantly higher than the levels in 2019 and 2020.
Overall, CEC levels remained the highest in 2014 followed by 2018, 2016, 2017, 2019 and 2020, replication 3 had the highest CEC levels followed by replications 2 and 1 and VersaLime treatment had the highest levels followed by gypsum, E-sulfur and control treatments.
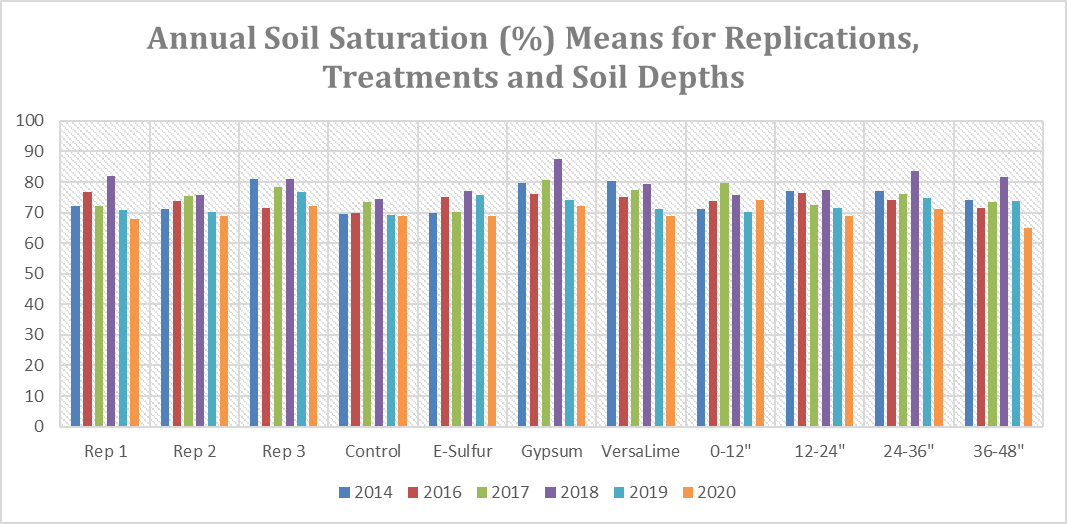
Differences in Soil Water Saturation Percent Levels
Soil water saturation (%) levels are shown in Figure 12. Statistically, there were significant differences in the annual soil water saturation levels in replications, treatments and soil depths.
Replication 1 in 2018 had significantly higher soil water saturation levels versus replication 1 in 2014, 2017, 2019 and 2020, replication 2 in all years and replication 3 in 2016 and 2020. In addition, replication 3 in 2014 had significantly higher soil water saturation levels versus replication 1 in 2014, 2017, 2019 and 2020, replication 2 in 2014, 2016, 2017, 2019 and 2020 and replication 3 in 2016 and 2020, whereas, soil water saturation levels were significantly higher in replication 3 in 2018 versus replication 1 in 2014, 2017, 2019 and 2020, replication 2 in 2014, 2016, 2019 and 2020 and replication 3 in 2016 and 2020.
The soil water saturation levels in gypsum treatment in 2018 were significantly higher than the levels in control, E-sulfur and VersaLime treatments in 2018 and all four treatments in 2014, 2016, 2017, 2019 and 2020. In addition, gypsum treatment in 2017 had significantly higher soil water saturation levels than control treatment in all years, gypsum and VersaLime treatments in 2019 and 2020 and E-sulfur treatment in 2014, 2017 and 2020.
The 24-36 inch soil depth in 2018 had significantly higher soil water saturation levels than the levels in 0-12 inch depth in 2014, 2016, 2018, 2019 and 2020, 12-24 and 24-36 inch depths in 2016, 2017, 2019 and 2020 and 36-48 inch depth in 2014, 2016, 2017, 2019 and 2020. In addition 36-48 inch depth in 2018 had significantly higher levels versus the levels in 0-12 inch depth in 2014, 2016, 2019 and 2020, 12-24 inch depth in 2017, 2019 and 2020, 24-36 inch depth in 2016, 2019 and 2020 and 36-48 inch depth in 2014, 2016, 2017, 2019 and 2020.
Overall, soil water saturation levels remained the highest in 2018 followed by 2014 and 2017, 2016, 2019 and 2020, replication 3 had the highest saturation levels followed by replications 1 and 2, gypsum treatment had the highest levels followed by VersaLime, E-sulfur and control treatments and 24-36 inch soil depth had the highest soil water saturation levels followed by 0-12 and 12-24 inch, 36-48 inch depths.
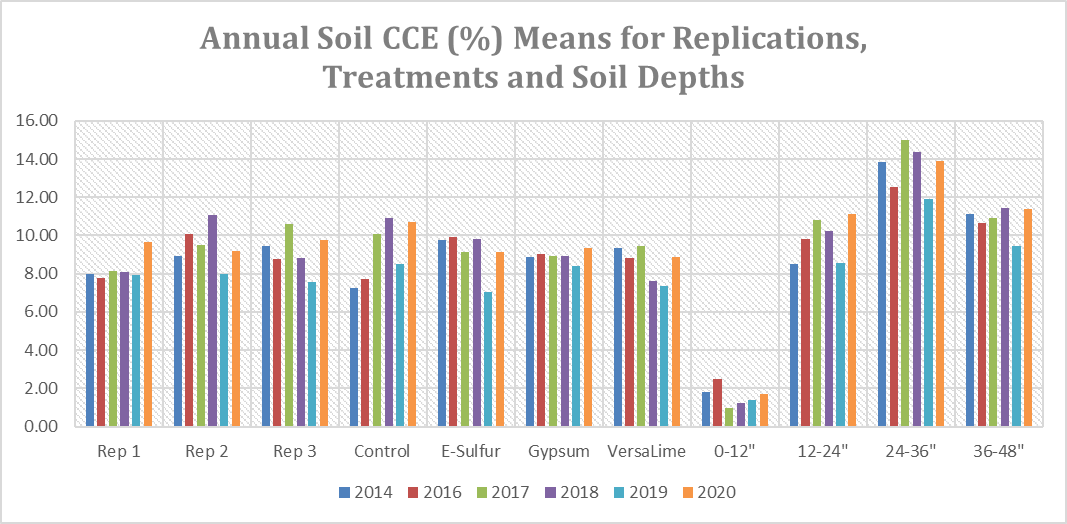
Differences in Soil Calcium Carbonate Equivalent Percent (CCE) Levels
Soil calcium carbonate equivalent (%) levels are shown in Figure 13. Statistically, there were significant differences in the annual soil CCE levels in soil depths.
The soil calcium carbonate equivalent levels in the 0-12 inch depth in all years remained significantly lower than the levels in rest of the soil depths. In addition, 24-36 inch soil depth in 2017 had significantly higher CCE levels versus rest of the depth in all years except 24-36 inch depth in 2014, 2016, 2018 and 2020. Numerically, 24-36 inch soil depth had the highest CCE levels versus all depths in all years.
Overall, soil calcium carbonate equivalent remained the highest in 2020 followed by 2014, 2016, 2017, 2018 and 2020, replications 2 and 3 had the highest CCE levels followed by replication 1, all treatments roughly had similar CCE levels and 24-36 inch soil depth had the highest CCE levels followed by 36-48 inch, 12-24 inch and 0-12 inch soil depths.
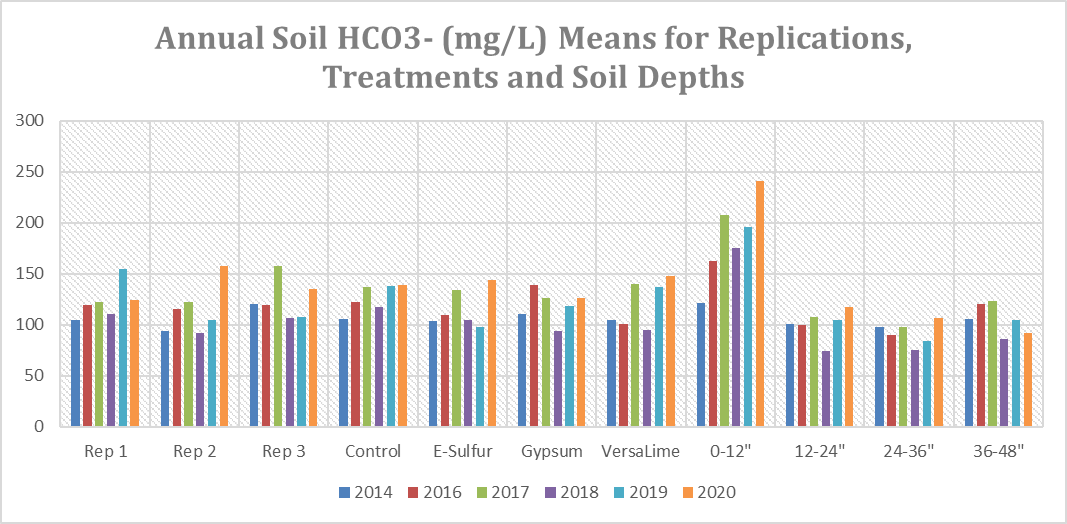
Differences in Soil Bicarbonate (HCO3-) Levels
Soil bicarbonate (mg/L) levels are shown in Figure 14. Statistically, there were significant differences in the annual HCO3- levels in replications and soil depths.
Replication 2 in 2020 and replication 3 in 2017 had significantly higher soil HCO3- levels versus replication 1 in 2014 and 2018, replication 2 in 2014, 2016, 2018 and 2019 and replication 3 in 2018 and 2019. In addition, replication 1 in 2019 had significantly higher HCO3- levels versus replication 1 in 2014 and 2018, replication 2 in 2014, 2018 and 2019 and replication 3 in 2018 and 2019.
The 0-12 inch soil depth in 2020 had significantly higher soil HCO3- levels versus rest of the depths in all years except 0-12 inch depth in 2017. In addition, 0-12 inch depth in 2017 had significantly higher soil HCO3- levels versus all depths in all years except 0-12 inch depth in 2017, 2018, 2019 and 2020.
Overall, soil HCO3- levels remained the highest in 2020 followed by 2017, 2019, 2016, 2014 and 2018, replication 3 had the highest HCO3- levels followed by replications 1 and 2, control treatment had the highest levels followed by VersaLime, gypsum, and E-sulfur treatments and 0-12 inch soil depth had the highest HCO3- levels followed by 36-48 inch, 12-24 inch and 24-36 inch depths.
Differences in Soil Chloride (Cl-) Levels
Soil chloride (mg/L) levels are shown in Figure 15. Statistically, there were significant differences in the annual Cl- levels in replications, treatments and soil depths.
Replication 2 in 2014 and 2018 and replication 3 in 2018 had significantly higher soil Cl- levels than all of the replications in all years. In addition, replication 2 in 2016 had significantly higher Cl- levels than replication 1 in 2016, 2017, 2019 and 2020 and replication 3 in 2017 and 2020.
The control treatment in 2018 had significantly higher soil Cl- levels versus all of the treatments in all years except all four treatments in 2018 and control treatment in in 2014. In addition, E-sulfur treatment in 2018 had significantly higher soil Cl- levels versus E-sulfur treatment in 2014, control, E-sulfur and gypsum treatments in 2016 and all four treatments in 2017, 2019 and 2020.
The 0-12 soil depth in 2014 and 24-36 inch depth in 2018 had significantly higher soil Cl- levels versus all of the depths in all years except 0-12 and 36-48 inch depths in 2018. In addition, 0-12 and 36-48 inch depths in 2018 had significantly higher soil Cl- levels compared to 0-12 inch depth in 2016, 2017, 2019 and 2020 and 12-24, 24-36 and 36-48 inch depths in 2014, 2016, 2017, 2019 and 2020.
Overall, Cl- levels remained the highest in 2018 followed by 2014, 2016, 2019, 2017 and 2020, replication 2 had the highest Cl- levels followed by replications 3 and 1, control treatment had the highest levels followed by VersaLime, E-sulfur and gypsum treatments and 0-12 inch soil depth had the highest Cl- levels followed by 36-48, 24-36 inch and 12-24 inch depths.
Differences in Soil Sulfate (SO42-) Levels
Soil sulfate (mg/L) levels are shown in Figure 16. Statistically, there were significant differences in the annual SO42- levels in replications and treatments.
Replication 2 in 2014 had significantly higher SO42- levels versus replication 1 in 2017, 2018, 2019 and 2020, replication 2 in 2017 and replication 3 in 2016, 2017, 2018, 2019 and 2020. In addition, replication 2 in 2018 had significantly higher SO42- levels than replication 1 in 2019, replication 2 in 2017 and replication 3 in 2016, 2017, 2018 2019 and 2020.
The E-sulfur treatment in 2014 and 2016 had significantly higher SO42- levels versus control treatment in 2016, 2017, 2018, 2019 and 2020, E-sulfur and VersaLime treatments in 2019 and gypsum treatment in 2017. In addition, VersaLime treatment in 2014 had significantly higher SO42- levels versus control treatment in 2016, 2017, 2018, 2019 and 2020 and VersaLime treatment in 2019.
Overall, soil SO42- levels remained the highest in 2014 followed by 2018, 2016, 2020, 2019 and 2017, replication 2 had the highest SO42- levels followed by replications 1 and 3, E-sulfur treatment had the highest levels followed by VersaLime, gypsum and control treatments and 12-24 inch soil depth had the highest SO42- levels followed by 24-36, 0-12 and 36-48 inch depths.
Differences in Soil Calcium (Ca2+) Levels
Soil calcium (mg/L) levels are shown in Figure 17. Statistically, there were significant differences in the annual Ca2+ levels in replications, treatments and soil depths.
Replication 3 in 2014, had significantly higher Ca2+ levels versus replications 1 and 2 in 2014 and all of the replications in rest of the years. In addition, replication 2 in 2014 had significantly higher Ca2+ levels versus replication 1 in 2016, 2017, 2018 and 2019, replication 2 in 2016, 2017 and 2019 and replication 3 in 2016, 2017, 2018, 2019 and 2020.
The E-sulfur and VersaLime treatments in 2014, had significantly higher Ca2+ levels versus all of the treatments in all years except control and gypsum treatments in 2014. In addition, control treatment in 2014 had significantly higher Ca2+ levels versus control treatment in 2016, 2017, 2018, 2019 and 2020, E-sulfur treatment in 2016, 2017, 2019 and 2020, gypsum treatment in 2016, 2017, 2018 and 2019 and VersaLime treatment in 2016, 2017 and 2019.
The 12-24 inch soil depth in 2014 had significantly higher Ca2+ levels versus all depths in all years except 24-36 inch depth in 2014. In addition, 24-36 inch depth in 2014 had significantly higher Ca2+ levels versus all depths in all years except 0-12 and 12-24 inch depths in 2014.
Overall, Ca2+ levels remained the highest in 2014 followed by 2020, 2018, 2017, 2016 and 2019, replication 2 had the highest Ca2+ levels followed by replications 3 and 1, E-sulfur treatment had the highest levels followed by VersaLime, gypsum and control treatments and 12-24 inch soil depth had the highest Ca2+ levels followed by 0-12, 24-36 and 36-48 inch soil depths.
Differences in Soil Magnesium (Mg2+) Levels
Soil magnesium (mg/L) levels are shown in Figure 18. Statistically, there were significant differences in the annual Mg2+ levels in replications, treatments and soil depths.
Replication 2 in 2018, had significantly higher Mg2+ levels versus all of the replications in all years except replication 1 in 2016 and replication 2 in 2014 and 2016. In addition, replication 2 in 2016, had significantly higher Mg2+ levels versus replication 1 in 2014, 2018, 2019 and 2020 and replication 3 in all years.
The E-sulfur treatment in 2016 had significantly higher Mg2+ levels versus control treatment in all years, E-sulfur treatment in 2014, 2019 and 2020, gypsum treatment in 2017, 2018, 2019 and 2020 and VersaLime treatment in 2017 and 2019. In addition, VersaLime treatment in 2018 had significantly higher Mg2+ levels versus control treatment in all years, E-sulfur treatment in 2019 and 2020, gypsum treatment in 2017, 2018, 2019 and 2020 and VersaLime treatment in 2017 and 2019.
The 0-12 inch depth in 2018 and 12-24 inch depth in 2016 had significantly higher Mg2+ levels versus 0-12 and 12-24 inch depths in 2019 and 2020, 24-26 inch depth in 2014, 2017, 2018, 2019 and 2020 and 36-48 inch depth in all years. In addition, the 0-12 inch depth in 2016 had significantly higher Mg2+ levels versus 24-36 inch depth in 2014, 2017, 2019 and 2020 and 36-48 inch depth in all years.
Overall, soil Mg2+ levels remained the highest in 2016 followed by 2018, 2014, 2017, 2020 and 2019, replication 2 had the highest Mg2+ levels followed by replications 1 and 3, VersaLime treatment had the highest Mg2+ levels followed by E-sulfur, gypsum and control treatments and 0-12 inch soil depth had the highest Mg2+ levels followed by 12-24, 24-36 and 36-48 inch depths.
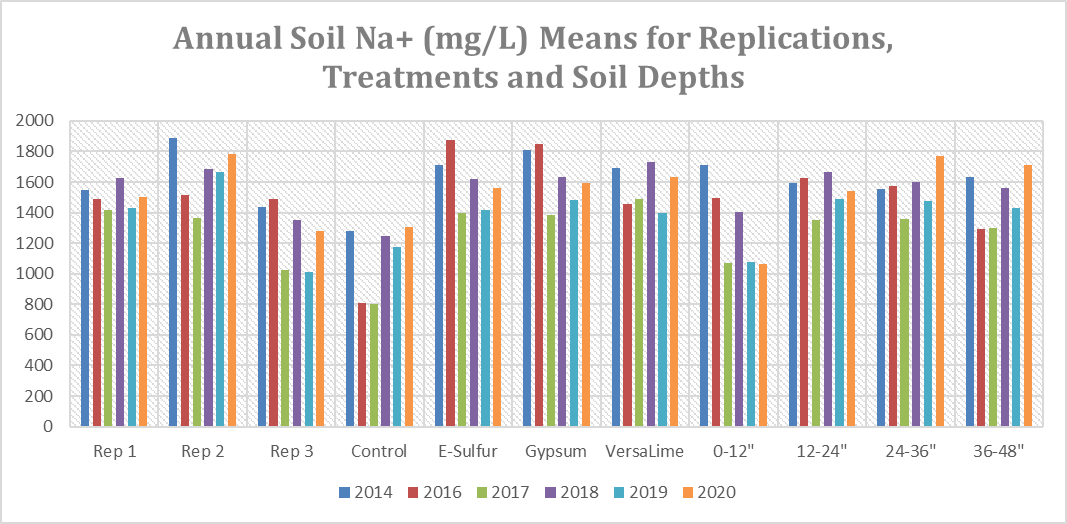
Differences in Soil Sodium (Na+) Levels
Soil sodium (mg/L) levels are shown in Figure 19. Statistically, there were significant differences in the annual Na+ levels in replications and treatments.
Replication 2 in 2014, had significantly higher Na+ levels versus replication 1 in 2017 and 2019, replication 2 in 2017 and replication 3 in 2014, 2017, 2018, 2019 and 2020. In addition, replication 2 in 2020 had significantly lower Na+ levels compared to replication 2 in 2017 and replication 3 in 2017, 2018, 2019 and 2020.
The E-sulfur treatment in 2016 had significantly higher Na+ levels versus control treatment in all years, E-sulfur and gypsum treatments in 2017 and VersaLime treatment in 2019. In addition, gypsum treatment in 2016 had significantly higher Na+ levels versus control treatment in all years.
Overall, Na+ levels remained the highest in 2014 followed by 2018, 2020, 2016, 2019 and 2017, replication 2 had the highest Na+ levels followed by replications 1 and 3, gypsum treatment had the highest Na+ levels followed by E-sulfur, VersaLime and control treatments and 24-36 inch soil depth had the highest Na+ levels followed by 12-24, 36-48 and 0-12 inch depths.
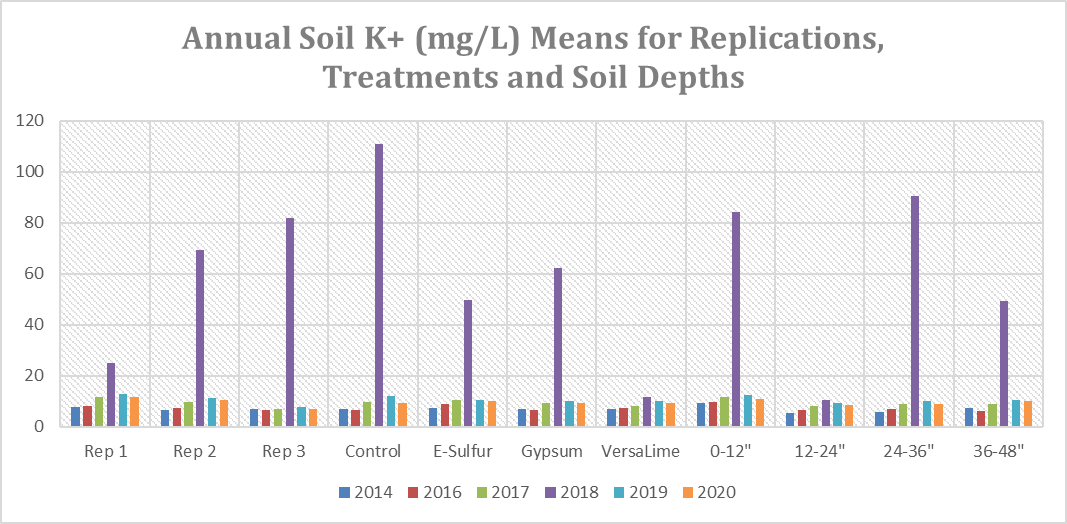
Differences in Soil Potassium (K+) Levels
Soil potassium (mg/L) levels are shown in Figure 20. Statistically, there were significant differences in the annual K+ levels in replications, treatments and soil depths.
Replications 3 and 2 in 2018 had significantly higher K+ levels versus replication 1 in 2018 and all of the replications in all years.
The control treatment in 2018 had significantly higher K+ levels versus gypsum, VersaLime and E-sulfur treatments in 2018 and all of the treatments in all years. In addition, gypsum treatment in 2018 had significantly higher K+ levels versus control, E-sulfur and gypsum treatments in 2014, 2016, 2017, 2019 and 2020 and VersaLime treatment in all years.
The 0-12 and 24-36 inch soil depths in 2018 had significantly higher K+ levels versus 12-24 depth in 2018 and all of the depths in all years except 36-48 inch depth in 2018. In addition, 36-48 inch depth in 2018 had significantly higher K+ levels versus 12-24 and 24-36 inch soil depths in 2014.
Overall, K+ levels remained the highest in 2018 followed by 2019, 2020, 2017, 2016 and 2014, replication 3 had the highest K+ levels followed by replications 2 and 1, control treatment had the highest levels followed by gypsum, E-sulfur and VersaLime treatments and 0-12 inch soil depth had the highest K+ levels followed by 24-36, 36-48 and 12-24 inch depths.
Changes in Soil Physical Properties
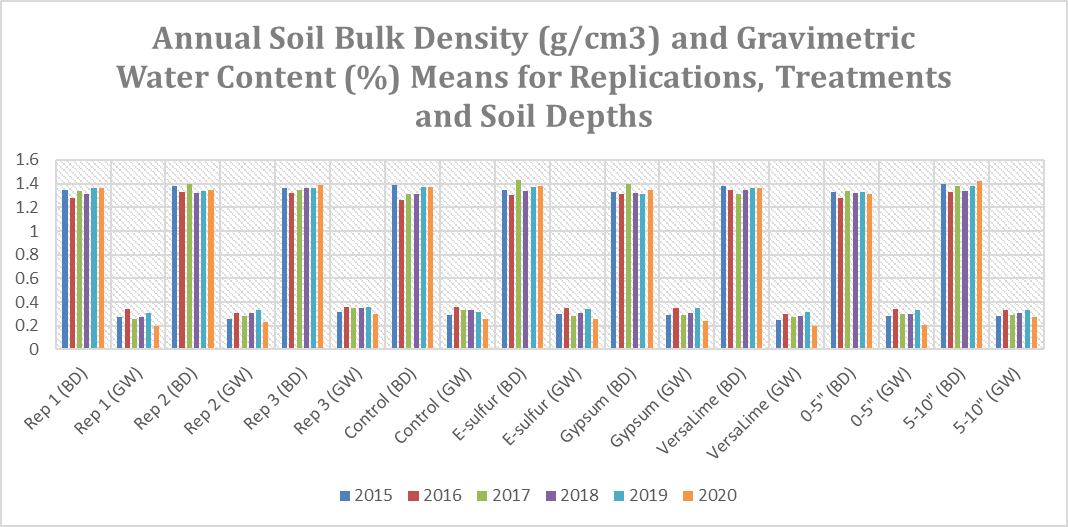
Differences in Soil Bulk Density (BD) Levels
Soil bulk density (g/cm3) and corresponding gravimetric water content (%) levels are shown in Figure 21. Statistically, there were significant differences in the annual soil bulk density levels in soil depths.
The 5-10 inch soil depth in 2020 had significantly higher bulk density levels versus 0-5 inch soil depth in all years and 5-10 inch depth in 2016 and 2018. In addition, 5-10 inch soil depth in 2015 had significantly higher bulk density levels versus 0-5 inch depth in 2015, 2016, 2018, 2019 and 2020 and 5-10 inch depth in 2016.
Overall, soil bulk density levels remained the highest in 2020 followed by 2015, 2017, 2019, 2018 and 2016, replication 3 had the highest bulk density levels followed by replications 2 and 1, E-sulfur treatment had the highest levels followed by VersaLime, control and gypsum treatments and 5-10 inch soil depth had higher bulk density levels compared to 0-5 inch depth.
Differences in Soil Penetrometer Meter Resistance Levels
Cumulative soil penetrometer resistance measurements for replications, treatments and 0-18 inch depths are shown in Figure 22 and 23. Statistically, there were significant differences in the annual soil penetrometer resistance measurements measured in pounds of force per square inch (psi) in replications, treatments and soil depths.
Replication 1 in 2017 showed significantly higher penetrometer resistance versus all of the replications in all years except replication 2 in 2015. In addition, replication 2 in 2015 had significantly higher penetrometer resistance versus replication 1 in 2015, 2016, 2018, 2019 and 2020, replication 2 in 2016, 2018, 2019 and 2020 and replication 3 in all years.
All four treatments in 2015 and 2017 had significantly higher penetrometer resistance versus all treatments in 2016, 2018, 2019 and 2020. In addition, the 2018 penetrometer resistance levels in all treatments were significantly lower versus the measurements in 2016, 2019 and 2020.
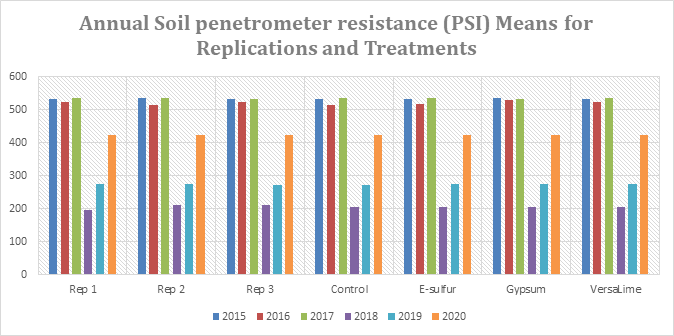
The soil penetrometer resistance measurements in 1 to 18 inch depths in 2015 and 2017 were significantly higher than the measurements in all depths in 2016, 2018, 2019 and 2020 except 1 inch depth in 2017. In addition, penetrometer resistance measurements in all depths in 2016 were significantly higher versus all soil depths in 2018, 2019 and 2020.
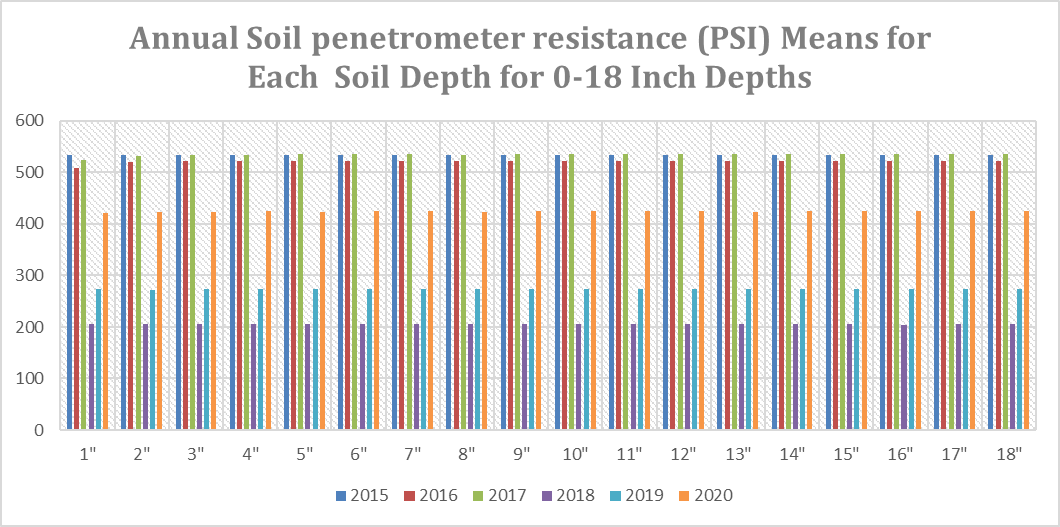
Overall, penetrometer resistance measurements remained the highest in 2017 followed by 2015, 2016, 2020, 2019 and 2018, replication 2 had the highest penetrometer resistance measurements followed by replications 3 and 1, gypsum treatment had the highest levels followed by VersaLime, E-sulfur and control treatments and 18 inch soil depth had the highest penetrometer resistance measurements followed by 15, 17, 14, 16, 10, 11, 12, 6, 9, 13, 7, 8, 4, 5, 3, 2 and 1 inch depths.
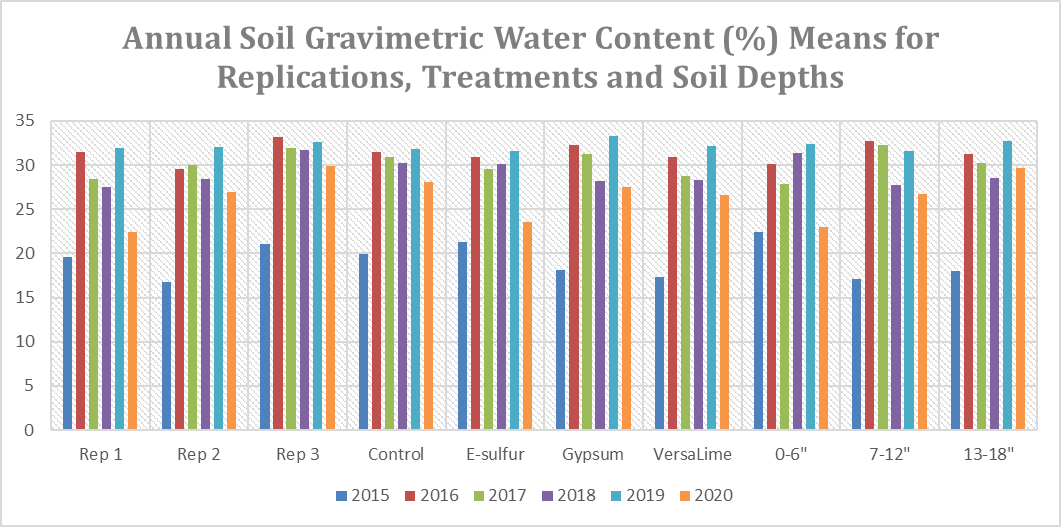
Since penetrometer resistance is strongly related to the soil water content at the time of recording the measurements, soil gravimetric water content was also measured for the 0-6, 7-12 and 13-18 inch soil depths. And like penetrometer resistance, there were statistically significant differences in the annual soil gravimetric water content measured in percent (%) in replications, treatments and soil depths (Figure 24).
Quality of Water Draining from the Research Project Site for Human and Livestock Health
Water samples from upstream, tile drainage lift station and downstream were collected one to three times a year depending upon the weather by using North Dakota Department of Health protocols and were sent to its Chemical Laboratory for analysis in 2015, 2016, 2017, 2018, 2019 and 2020. Samples were collected after a decent rain event of close to an inch or more, which allowed standing water in the ditch in which tiling project water was draining for upstream and downstream samples as well as fresh flow of water from the tiled field to lift station. Upstream samples were collected from the beginning of the drainage ditch 100-150 feet north of the lift station. Lift station samples represent water quality coming out of tiles, whereas, downstream samples were collected 100-150 feet south of the lift station in the direction where drainage water flows. Each sampling activity included collecting a separate set of samples from upstream, lift station and downstream, 10-15 minutes apart on the same day. Each sampling activity included three sampling sets and each sample set included the following:
- 500 mL to analyze major cations, anions and bromide (procedures 200.7, 300 and 2320-B, USEPA).
- 250 mL preserved with 2mL of Nitric Acid (HNO3) for trace metals (procedure 200.8, USEPA).
- 500 mL preserved with Sulfuric Acid (H2SO4) to analyze for nutrients that included total nitrogen, Kjeldahl nitrogen, nitrite + nitrate nitrogen and phosphorous (procedures 353.2, Lachat Method No. 10-107-04-1-C, 353.2, Lachat Method No. 10-107-04-1-O, and 200.7, Lachat Method 10-115-01-1-E, USEPA).
- 200 mL filtered and then preserved with Sulfuric Acid (H2SO4) to analyze dissolved phosphorous (procedure 365.1, Lachat Method 10-115-01-1-E, USEPA).
- All samples were preserved in a cooler with icepacks right after collection and were shipped to the Chemical Laboratory of ND Department of Health through overnight delivery.
Below is the breakdown of the annual water quality analysis of the samples collected from upstream, lift Station and downstream locations. Please note that CO32-, OH-, silica, beryllium, chromium, silver, cadmium, antimony, thallium and lead are not discussed in the results below as analysis results were below the detectable levels at almost all of the sampling times. In addition, “ND” in the result tables mean “Not Detectable”.
Differences in Salts, Dissolved Solids, Total Hardness as CaCO3 and Total Alkalinity as CaCO3 Levels
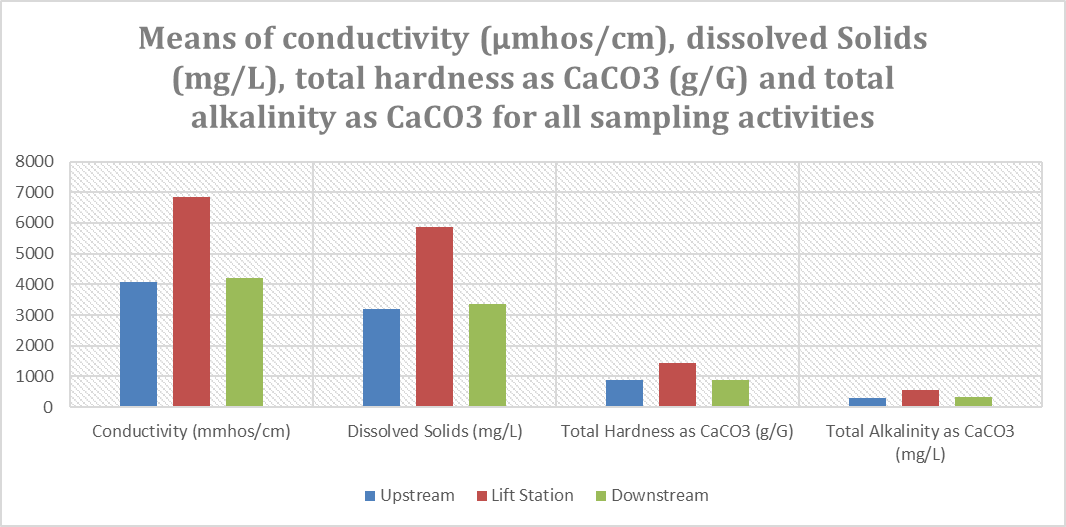
Based on the results of each sampling activity, conductivity (mmhos/cm) levels in the lift station were higher than the upstream and downstream samples, except samples taken on May 11, 2016, May 10, 2017 and June 12, 2018. Differences between upstream and downstream samples fluctuated and there was no consistent trend. Concentration of dissolved solids (mg/L) of the lift station samples were higher than the upstream and downstream samples, except the samples taken on May 10, 2017 and June 12, 2018. Total hardness as CaCO3 (grams/gallon) concentrations were also higher in the lift station samples versus upstream and downstream samples, except the samples taken on May 10, 2017. Total alkalinity as CaCO3 levels were higher in the lift station samples versus all of the upstream and downstream samples. Details are in Table 4.
| Date | Site | Conductivity (µmhos/cm) | Total Dissolved Solids (mg/L) | Total Hardness as CaCO3 (g/G) | Total Alkalinity as CaCO3 (mg/L) |
|---|---|---|---|---|---|
| November 9, 2015 | Upstream | 5650 | 4510 | 1110 | 326 |
| November 9, 2015 | Lift Station | 10200 | 8840 | 2160 | 564 |
| November 9, 2015 | Downstream | 6800 | 5700 | 1460 | 370 |
| May 11, 2016 | Upstream | 7220 | 6060 | 1500 | 230 |
| May 11, 2016 | Lift Station | 7200 | 7170 | 1720 | 501 |
| May 11, 2016 | Downstream | 7560 | 6390 | 1500 | 202 |
| July 11, 2016 | Upstream | 999 | 647 | 243 | 127 |
| July 11, 2016 | Lift Station | 8140 | 6820 | 1610 | 507 |
| July 11, 2016 | Downstream | 966 | 627 | 251 | 105 |
| September 8, 2016 | Upstream | 3440 | 2570 | 787 | 467 |
| September 8, 2016 | Lift Station | 7220 | 5960 | 1500 | 630 |
| September 8, 2016 | Downstream | 3200 | 2340 | 771 | 338 |
| May 10, 2017 | Upstream | 6920 | 5840 | 1680 | 387 |
| May 10, 2017 | Lift Station | 5980 | 4950 | 1360 | 543 |
| May 10, 2017 | Downstream | 6070 | 5200 | 1370 | 504 |
| August 17, 2017 | Upstream | 3360 | 2590 | 774 | 158 |
| August 17, 2017 | Lift Station | 6590 | 6010 | 1220 | 615 |
| August 17, 2017 | Downstream | 2100 | 1430 | 381 | 173 |
| June 12, 2018 | Upstream | 5130 | 3910 | 887 | 288 |
| June 12, 2018 | Lift Station | 4470 | 3420 | 926 | 517 |
| June 12, 2018 | Downstream | 4840 | 3680 | 816 | 369 |
| August 26, 2019 | Upstream | 3710 | 2860 | 757 | 337 |
| August 26, 2019 | Lift Station | 5430 | 4290 | 1000 | 700 |
| August 26, 2019 | Downstream | 5070 | 4080 | 903 | 635 |
| September 30, 2019 | Upstream | 754 | 488 | 200 | 142 |
| September 30, 2019 | Lift Station | 6460 | 5620 | 1390 | 530 |
| September 30, 2019 | Downstream | 1350 | 891 | 285 | 174 |
| July 6, 2020 | Upstream | 3510 | 2630 | 926 | 429 |
| July 6, 2020 | Lift Station | 6760 | 5560 | 1370 | 599 |
| July 6, 2020 | Downstream | 4240 | 3380 | 1050 | 506 |
Based on the cumulative means of all sampling activities, conductivity (mmhos/cm), dissolved solids (mg/L), total hardness as CaCO3 (g/G) and total alkalinity as CaCO3 concentrations of the lift station samples were higher than the upstream and downstream samples.
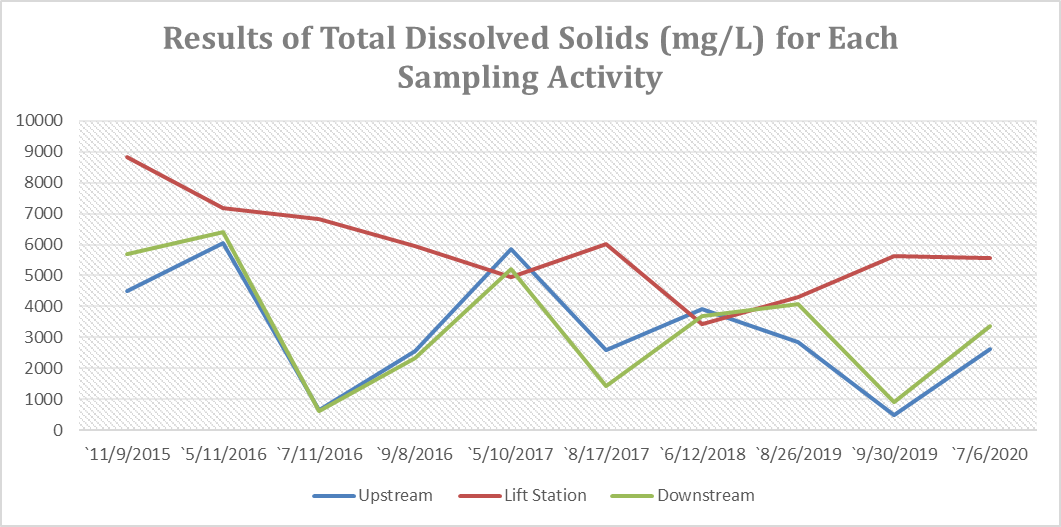
Since it was important to assess the total dissolved solids (TDS) coming out of the tiled area represented by the lift station samples compared to upstream and downstream samples, results are presented in a line chart below (Figure 25). We can see that except samples taken on May 10, 2017 and June 12, 2018, the TDS levels of the lift station samples were noticeably higher than the upstream and downstream samples.
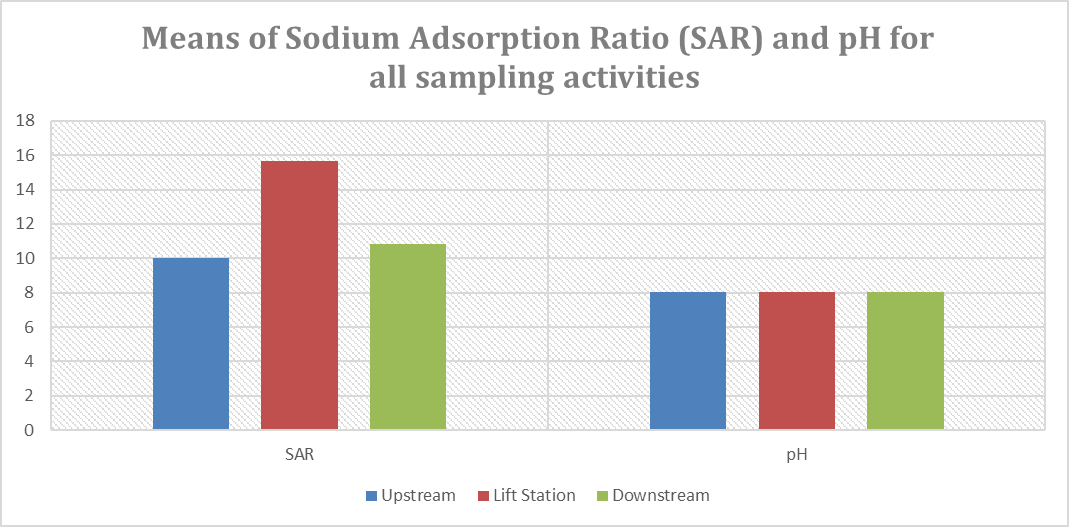
Differences in Sodium Adsorption Ratio (SAR) and pH Levels
Based on the results of each sampling activity, SAR levels of the lift station samples were higher than the upstream and downstream samples, except in the samples that were taken on May 11, 2016, May 10, 2017 and June 12, 2018. The differences between the soil pH levels of upstream, lift station and downstream samples were inconsistent. Details are in Table 5.
| Date | Site | Sodium Adsorption Ratio (SAR) | pH |
|---|---|---|---|
| November 9, 2015 | Upstream | 13.10 | 8.27 |
| November 9, 2015 | Lift Station | 17.40 | 7.91 |
| November 9, 2015 | Downstream | 16.30 | 8.37 |
| May 11, 2016 | Upstream | 16.60 | 8.92 |
| May 11, 2016 | Lift Station | 14.90 | 7.96 |
| May 11, 2016 | Downstream | 17.60 | 9.23 |
| July 11, 2016 | Upstream | 3.54 | 7.60 |
| July 11, 2016 | Lift Station | 16.20 | 8.32 |
| July 11, 2016 | Downstream | 3.07 | 7.56 |
| September 8, 2016 | Upstream | 8.55 | 8.31 |
| September 8, 2016 | Lift Station | 15.60 | 8.10 |
| September 8, 2016 | Downstream | 6.87 | 7.92 |
| May 10, 2017 | Upstream | 14.20 | 8.27 |
| May 10, 2017 | Lift Station | 13.50 | 8.08 |
| May 10, 2017 | Downstream | 14.00 | 8.28 |
| August 17, 2017 | Upstream | 8.36 | 7.60 |
| August 17, 2017 | Lift Station | 22.60 | 7.99 |
| August 17, 2017 | Downstream | 6.52 | 7.67 |
| June 12, 2018 | Upstream | 13.80 | 7.70 |
| June 12, 2018 | Lift Station | 11.00 | 8.00 |
| June 12, 2018 | Downstream | 13.50 | 7.92 |
| August 26, 2019 | Upstream | 10.70 | 7.92 |
| August 26, 2019 | Lift Station | 14.70 | 8.03 |
| August 26, 2019 | Downstream | 14.60 | 8.11 |
| September 30, 2019 | Upstream | 3.11 | 7.77 |
| September 30, 2019 | Lift Station | 15.20 | 7.78 |
| September 30, 2019 | Downstream | 4.55 | 7.71 |
| July 6, 2020 | Upstream | 7.93 | 7.76 |
| July 6, 2020 | Lift Station | 15.4 | 7.95 |
| July 6, 2020 | Downstream | 11.2 | 7.76 |
Based on the cumulative means of all sampling activities, SAR levels in the lift station samples remained higher than the upstream and downstream samples, whereas, differences in the pH levels were inconsistent and negligible.
Differences in the Major Cation and Anion levels
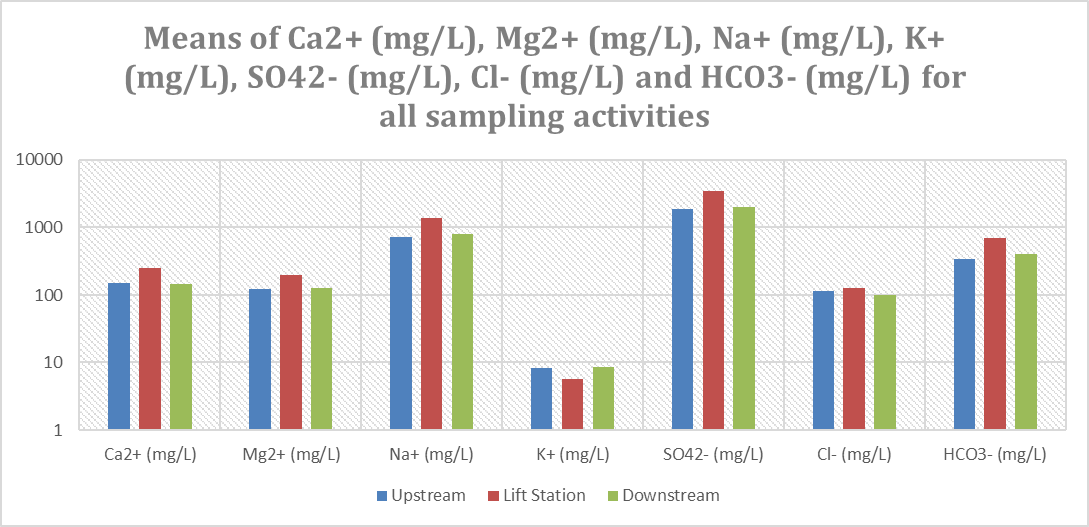
Based on the results of each sampling activity, Ca2+ (mg/L) levels of the lift station samples were higher than the upstream and downstream samples, except in the samples taken on May 10, 2017. Mg2+ (mg/L), Na+ (mg/L) and SO42- (mg/L) levels of the lift station samples were higher than the samples taken from upstream and downstream samples except the samples that were taken on May 11, 2016, May 10, 2017 and June 12, 2018. K+ (mg/L) levels of the lift station samples were mostly lower or similar versus the levels in the upstream and downstream samples at all sampling times. Cl- (mg/L) levels of the lift station samples were higher than the samples taken from upstream and downstream samples except the samples that were taken on May 11, 2016, May 10, 2017, June 12, 2018 and August 26, 2019. HCO3- (mg/L) levels of the lift station samples remained higher than the upstream and downstream samples at all sampling times. Details are in Table 6.
| Date | Site | Ca2+ (mg/L) | Mg2+ (mg/L) | Na+ (mg/L) | K+ (mg/L) | SO42- (mg/L) | Cl- (mg/L) | HCO3- (mg/L) |
|---|---|---|---|---|---|---|---|---|
| November 9, 2015 | Upstream | 187 | 156 | 1000 | NA | 2790 | 148 | 397 |
| November 9, 2015 | Lift Station | 398 | 284 | 1860 | NA | 5710 | 208 | 688 |
| November 9, 2015 | Downstream | 223 | 220 | 1430 | 11 | 3420 | 157 | 436 |
| May 11, 2016 | Upstream | 173 | 260 | 1480 | 9.9 | 3790 | 203 | 220 |
| May 11, 2016 | Lift Station | 271 | 253 | 1420 | 5.9 | 3700 | 178 | 611 |
| May 11, 2016 | Downstream | 161 | 266 | 1570 | 10.6 | 4050 | 206 | 149 |
| July 11, 2016 | Upstream | 55.2 | 25.6 | 127 | 7.9 | 320 | 29.6 | 155 |
| July 11, 2016 | Lift Station | 251 | 239 | 1500 | 6.3 | 4330 | 148 | 609 |
| July 11, 2016 | Downstream | 59.1 | 25.1 | 112 | 7.1 | 329 | 25.3 | 128 |
| September 8, 2016 | Upstream | 147 | 102 | 552 | 8.6 | 1390 | 92.9 | 565 |
| September 8, 2016 | Lift Station | 271 | 199 | 1390 | 7.6 | 3560 | 128 | 769 |
| September 8, 2016 | Downstream | 157 | 92 | 439 | 16.1 | 1320 | 107 | 412 |
| May 10, 2017 | Upstream | 263 | 249 | 1340 | 12.4 | 3490 | 255 | 472 |
| May 10, 2017 | Lift Station | 223 | 196 | 1150 | 5.2 | 2900 | 131 | 662 |
| May 10, 2017 | Downstream | 200 | 212 | 1190 | 6.7 | 3090 | 162 | 615 |
| August 17, 2017 | Upstream | 160 | 91 | 535 | 9.7 | 1580 | 117 | 192 |
| August 17, 2017 | Lift Station | 221 | 163 | 1820 | 6.8 | 3290 | 126 | 751 |
| August 17, 2017 | Downstream | 72.6 | 48.6 | 293 | 6.5 | 818 | 81.1 | 212 |
| June 12, 2018 | Upstream | 121 | 142 | 944 | 3.3 | 2420 | 101 | 351 |
| June 12, 2018 | Lift Station | 191 | 109 | 770 | 3.9 | 1950 | 72.7 | 631 |
| June 12, 2018 | Downstream | 129 | 120 | 889 | 5.2 | 2230 | 80.6 | 450 |
| August 26, 2019 | Upstream | 149 | 93.5 | 679 | 9.1 | 1650 | 72.7 | 411 |
| August 26, 2019 | Lift Station | 202 | 121 | 1070 | 5.2 | 2400 | 72.4 | 854 |
| August 26, 2019 | Downstream | 182 | 109 | 1010 | 4.8 | 2320 | 67.2 | 775 |
| September 30, 2019 | Upstream | 45.9 | 20.7 | 101 | 5.8 | 201 | 25.7 | 173 |
| September 30, 2019 | Lift Station | 245 | 188 | 1300 | 5.4 | 3470 | 88.4 | 647 |
| September 30, 2019 | Downstream | 60.4 | 32.7 | 177 | 7.3 | 462 | 36.4 | 213 |
| July 6, 2020 | Upstream | 201 | 103 | 555 | 8.93 | 1390 | 111 | 524 |
| July 6, 2020 | Lift Station | 232 | 192 | 1310 | 5.62 | 3340 | 112 | 730 |
| July 6, 2020 | Downstream | 203 | 132 | 836 | 10.3 | 1800 | 86.1 | 617 |
Based on the cumulative means of all sampling activities, Ca2+ (mg/L), Mg2+ (mg/L), Na+ (mg/L), SO42- (mg/L), Cl- (mg/L) and HCO3- (mg/L) levels of the lift station samples remained higher than the upstream and downstream samples, whereas, K+ (mg/L) levels of the lift station samples were lower than the upstream and downstream samples.
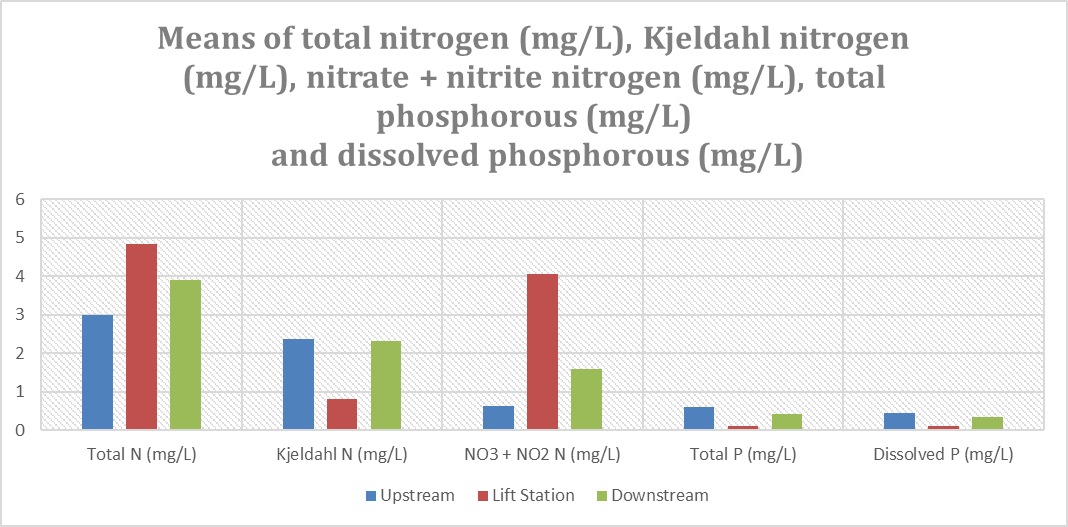
Differences in the Nitrogen and Phosphorous levels
Based on the results of each sampling activity, nitrate + nitrite nitrogen (mg/L) levels of the lift station remained higher than the upstream and downstream samples at all sampling times, except two downstream samples collected on May 10, 2017 and September 30, 2019 and upstream and downstream samples taken on July 6, 2020. Opposite trend was observed for the Kjeldahl nitrogen (mg/L) levels, which remained lower than the upstream and downstream samples taken at all times, except one upstream sample taken on September 30, 2019. The total nitrogen (mg/L) levels, which were a sum of Kjeldahl nitrogen (mg/L) and nitrate + nitrite nitrogen (mg/L) levels were higher in the lift station samples versus upstream and downstream samples, except the upstream and downstream samples that were collected on November 9, 2015 and July 6, 2020, downstream sample collected on May 10, 2017 and upstream samples collected on August 26, 2019 and September 30, 2019. The total phosphorous (mg/L) levels of the lift station samples were similar or lower than the upstream and downstream samples except one downstream sample collected on November 9, 2015. In addition, dissolved phosphorous (mg/L) levels of the lift station samples remained lower than the levels in the upstream and downstream samples except, upstream and downstream samples collected on November 9, 2015 and June 12, 2018, upstream sample collected on May 11, 2016 and downstream samples collected on May 10, 2017 and August 17, 2017. Details are in Table 7.
| Date |
Site |
Total N (mg/L) |
Kjeldahl N (mg/L) |
NO3 + NO2 N (mg/L) |
Total P (mg/L) |
Dissolved P (mg/L) |
|---|---|---|---|---|---|---|
| November 9, 2015 |
Upstream |
7.51 |
3.17 |
4.34 |
0.16 |
0.02 |
| November 9, 2015 |
Lift Station |
7.30 |
0.64 |
6.66 |
0.06 |
0.08 |
| November 9, 2015 |
Downstream |
11.70 |
8.40 |
3.30 |
0.03 |
ND |
| May 11, 2016 |
Upstream |
3.65 |
2.67 |
0.98 |
0.09 |
0.02 |
| May 11, 2016 |
Lift Station |
10.10 |
1.42 |
8.68 |
0.06 |
0.06 |
| May 11, 2016 |
Downstream |
2.59 |
2.56 |
0.03 |
0.22 |
0.08 |
| July 11, 2016 |
Upstream |
2.37 |
1.71 |
0.66 |
0.92 |
0.88 |
| July 11, 2016 |
Lift Station |
9.08 |
0.90 |
8.18 |
0.21 |
0.21 |
| July 11, 2016 |
Downstream |
2.46 |
1.54 |
0.92 |
0.79 |
0.75 |
| September 8, 2016 |
Upstream |
2.11 |
2.08 |
0.03 |
0.93 |
0.69 |
| September 8, 2016 |
Lift Station |
5.53 |
0.41 |
5.12 |
0.02 |
0.05 |
| September 8, 2016 |
Downstream |
3.03 |
2.28 |
0.75 |
0.61 |
0.50 |
| May 10, 2017 |
Upstream |
3.02 |
2.99 |
0.03 |
0.51 |
0.19 |
| May 10, 2017 |
Lift Station |
4.49 |
0.08 |
4.57 |
0.20 |
0.04 |
| May 10, 2017 |
Downstream |
7.47 |
0.83 |
6.64 |
0.20 |
0.03 |
| August 17, 2017 |
Upstream |
1.80 |
1.77 |
0.03 |
0.18 |
0.12 |
| August 17, 2017 |
Lift Station |
3.16 |
0.93 |
2.23 |
0.08 |
0.07 |
| August 17, 2017 |
Downstream |
1.38 |
1.35 |
0.03 |
0.20 |
0.06 |
| June 12, 2018 |
Upstream |
2.02 |
1.99 |
0.03 |
0.14 |
0.03 |
| June 12, 2018 |
Lift Station |
2.23 |
0.84 |
1.39 |
0.14 |
0.14 |
| June 12, 2018 |
Downstream |
1.29 |
1.26 |
0.03 |
0.14 |
0.02 |
| August 26, 2019 |
Upstream |
2.13 |
2.07 |
0.05 |
0.39 |
0.29 |
| August 26, 2019 |
Lift Station |
1.13 |
0.87 |
0.26 |
0.13 |
0.13 |
| August 26, 2019 |
Downstream |
1.04 |
0.93 |
0.11 |
0.20 |
0.18 |
| September 30, 2019 |
Upstream |
0.78 |
0.69 |
0.09 |
0.54 |
0.50 |
| September 30, 2019 |
Lift Station |
1.99 |
0.93 |
1.06 |
0.14 |
0.14 |
| September 30, 2019 |
Downstream |
3.22 |
1.41 |
1.81 |
0.55 |
0.49 |
| July 6, 2020 |
Upstream |
4.42 |
4.39 |
4.39 |
2.01 |
1.67 |
| July 6, 2020 |
Lift Station |
3.41 |
0.96 |
0.96 |
0.07 |
0.07 |
| July 6, 2020 |
Downstream |
4.66 |
2.44 |
2.44 |
1.11 |
1.04 |
Note:
- Total Nitrogen is a sum of the Kjeldahl N and NO3 + NO2 N.
- Kjeldahl N is a sum of free ammonium and organic nitrogen.
Based on the cumulative means of all sampling activities, total nitrogen (mg/L) and nitrate + nitrite nitrogen (mg/L) levels of the lift station samples were higher than the levels in the upstream and downstream samples. Whereas, Kjeldahl nitrogen (mg/L) levels of the lift station samples remained lower than the levels in upstream and downstream samples. Both total phosphorous (mg/L) and dissolved phosphorous (mg/L) levels of the lift station samples also remained lower than the levels in upstream and downstream samples.
Differences in the Boron, Aluminum, Nickel, Copper and Zinc levels
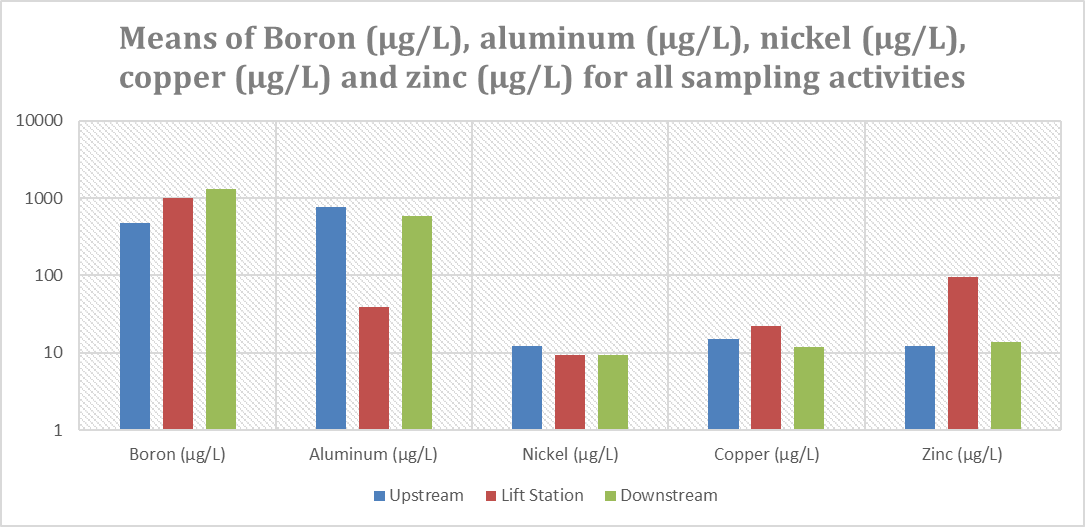
Based on the results of each sampling activity, lift station boron (µg/L) levels were higher than the levels in most upstream and downstream samples except, the upstream samples taken on July 11, 2016 and June 12, 2018 and downstream samples collected on November 9, 2015, July 11, 2016, May 10, 2017 and June 12, 2018. Aluminum (µg/L) levels of the lift station samples remained well below the levels in upstream and downstream samples at all sampling times. Nickel (µg/L) levels of the lift station samples were mostly lower than the upstream and downstream samples except, in the upstream and downstream samples taken on July 11, 2016 and September 30, 2019 and downstream samples collected on August 17, 2017 and August 26, 2019. Copper (µg/L) levels of the lift station samples were noticeably higher than the levels in upstream and downstream samples collected on November 9, 2015, July 11, 2016, August 17, 2017, September 30, 2019 and July 6, 2020. Zinc (µg/L) levels of the lift station samples were higher than the upstream and downstream samples at all sampling times except, one set of sample that was collected on May 10, 2017. Details are in Table 8.
| Date | Site | Boron (µg/L) | Aluminum (µ/L) | Nickel (µg/L) | Copper (µg/L) | Zinc (µg/L) |
|---|---|---|---|---|---|---|
| November 9, 2015 | Upstream | 580.00 | 887.00 | 9.10 | 9.96 | 17.20 |
| November 9, 2015 | Lift Station | 1260.00 | ND | ND | 18.80 | 25.40 |
| November 9, 2015 | Downstream | 7880.00 | 560.00 | 9.31 | 12.50 | 22.10 |
| May 11, 2016 | Upstream | 685.00 | 134.00 | 8.87 | 14.20 | 9.98 |
| May 11, 2016 | Lift Station | 741.00 | ND | 6.99 | 14.00 | 15.00 |
| May 11, 2016 | Downstream | 635.00 | 82.00 | 9.36 | 13.7 | 8.66 |
| July 11, 2016 | Upstream | 185.00 | 994.00 | 6.22 | 6.67 | 12.70 |
| July 11, 2016 | Lift Station | 87.00 | ND | 23.50 | 50.40 | 83.50 |
| July 11, 2016 | Downstream | 186.00 | 945.00 | 5.83 | 6.16 | 11.20 |
| September 8, 2016 | Upstream | 318.00 | 250.00 | 13.30 | 42.20 | 7.060 |
| September 8, 2016 | Lift Station | 1700.00 | 52.00 | 9.48 | 34.60 | 10.80 |
| September 8, 2016 | Downstream | 355.00 | 98.00 | 12.50 | 12.10 | ND |
| May 10, 2017 | Upstream | 471.00 | 1980.00 | 23.90 | 20.70 | 22.70 |
| May 10, 2017 | Lift Station | 821.00 | ND | 7.67 | 17.40 | 10.50 |
| May 10, 2017 | Downstream | 855.00 | 358.00 | 9.79 | 22.60 | 22.60 |
| August 17, 2017 | Upstream | 445.00 | 333.00 | 12.10 | 10.30 | ND |
| August 17, 2017 | Lift Station | 1620.00 | ND | 11.70 | 25.80 | 598 |
| August 17, 2017 | Downstream | 276.00 | 775.00 | 10.20 | 6.40 | 10.40 |
| June 12, 2018 | Upstream | 783.00 | 541.00 | 12.30 | 9.03 | 17.60 |
| June 12, 2018 | Lift Station | 724.00 | ND | 6.43 | 7.26 | 182.00 |
| June 12, 2018 | Downstream | 777.00 | 369.00 | 10.30 | 7.22 | 17.90 |
| August 26, 2019 | Upstream | 754.00 | ND | 8.04 | 12.10 | 7.15 |
| August 26, 2019 | Lift Station | 1300.00 | ND | 5.36 | 16.20 | 18.90 |
| August 26, 2019 | Downstream | 1170.00 | ND | 5.35 | 16.00 | 10.40 |
| September 30, 2019 | Upstream | 135.00 | 1360.00 | ND | ND | 8.26 |
| September 30, 2019 | Lift Station | 911.00 | ND | 6.66 | 18.60 | 9.60 |
| September 30, 2019 | Downstream | 187.00 | 1680.00 | ND | ND | 9.23 |
| July 6, 2020 | Upstream | 451 | 402 | 17.30 | 8.65 | 7.83 |
| July 6, 2020 | Lift Station | 1000 | 25 | 6.65 | 16.00 | 10.90 |
| July 6, 2020 | Downstream | 685 | 476 | 12.50 | 10.90 | 9.65 |
Based on the cumulative means of all sampling activities, boron (µg/L) levels of the lift station samples were higher than the upstream samples and lower than the downstream samples. Aluminum (µg/L) means of the lift station samples were very low compared to the upstream and downstream samples, whereas, nickel (µg/L) means of upstream samples were slightly higher than the lift station and downstream samples. Copper (µg/L) and zinc (µg/L) means of the lift station samples were higher than the upstream and downstream samples.
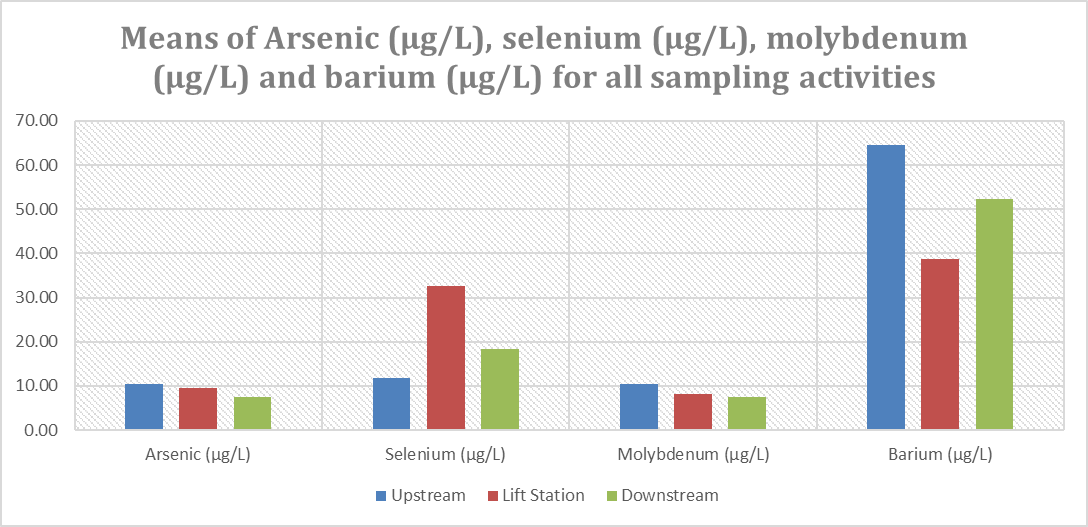
Differences in the Arsenic, Selenium, Molybdenum and Barium levels
Based on the results of each sampling activity, arsenic (µg/L) levels of the lift station samples were mostly lower than the upstream and downstream samples except in the samples taken on July 11, 2016 and September 30, 2019. Selenium (µg/L) levels were higher in the lift station samples at all sampling times compared to the upstream and downstream samples. Molybdenum (µg/L) levels in the lift station samples were mostly lower than the detectable levels (5.00 µg/L) compared to the upstream and downstream samples except in the samples that were collected on July 11, 2016 and September 30, 2019. Barium levels of the lift station samples were mostly lower compared to the upstream and downstream samples except versus upstream and downstream samples collected on July 11, 2016 and September 30, 2019 and upstream samples collected on May 11, 2016 and August 26, 2019. Details are in Table 9.
| Date | Site | Arsenic (µg/L) | Selenium (µ/L) | Molybdenum (µg/L) | Barium (µg/L) |
|---|---|---|---|---|---|
| November 9, 2015 | Upstream | 8.19 | 16.10 | ND | 58.80 |
| November 9, 2015 | Lift Station | ND | 57.10 | ND | 24.80 |
| November 9, 2015 | Downstream | 5.65 | 28.50 | 6.60 | 47.40 |
| May 11, 2016 | Upstream | 11.60 | 26.10 | 6.25 | 30.00 |
| May 11, 2016 | Lift Station | 11.00 | 31.20 | ND | 32.00 |
| May 11, 2016 | Downstream | 11.30 | 23.50 | 7.71 | 32.60 |
| July 11, 2016 | Upstream | ND | ND | ND | 57.40 |
| July 11, 2016 | Lift Station | 23.70 | 110.00 | 16.60 | 86.80 |
| July 11, 2016 | Downstream | ND | ND | ND | 58.60 |
| September 8, 2016 | Upstream | 9.34 | ND | 6.14 | 52.90 |
| September 8, 2016 | Lift Station | ND | 26.80 | ND | 25.30 |
| September 8, 2016 | Downstream | 5.94 | ND | 5.63 | 51.10 |
| May 10, 2017 | Upstream | 10.50 | 7.83 | 9.45 | 118.00 |
| May 10, 2017 | Lift Station | ND | 21.70 | ND | 29.10 |
| May 10, 2017 | Downstream | ND | 20.30 | ND | 34.10 |
| August 17, 2017 | Upstream | ND | ND | 5.87 | 33.10 |
| August 17, 2017 | Lift Station | ND | 13.90 | ND | 26.90 |
| August 17, 2017 | Downstream | 5.96 | ND | ND | 51.30 |
| June 12, 2018 | Upstream | 5.15 | ND | 6.57 | 43.10 |
| June 12, 2018 | Lift Station | ND | 10.30 | ND | 41.30 |
| June 12, 2018 | Downstream | 6.71 | ND | ND | 53.20 |
| August 26, 2019 | Upstream | 8.59 | 6.26 | 19.40 | 30.40 |
| August 26, 2019 | Lift Station | 5.03 | 11.70 | ND | 33.10 |
| August 26, 2019 | Downstream | 5.97 | 10.00 | ND | 39.70 |
| September 30, 2019 | Upstream | ND | ND | ND | 36.70 |
| September 30, 2019 | Lift Station | 5.36 | 21.20 | 5.23 | 43.80 |
| September 30, 2019 | Downstream | ND | ND | ND | 37.90 |
| July 6, 2020 | Upstream | 19.30 | 2.50 | 18.80 | 185 |
| July 6, 2020 | Lift Station | 2.50 | 23.00 | 2.50 | 44.10 |
| July 6, 2020 | Downstream | 11.30 | 9.91 | 9.88 | 117.00 |
Based on the cumulative means of all sampling activities, arsenic (µg/L), molybdenum (µg/L) and barium (µg/L) levels of lift station samples were lower than the upstream and downstream samples, whereas, selenium (µg/L) levels of lift station samples were higher than the upstream and downstream samples.
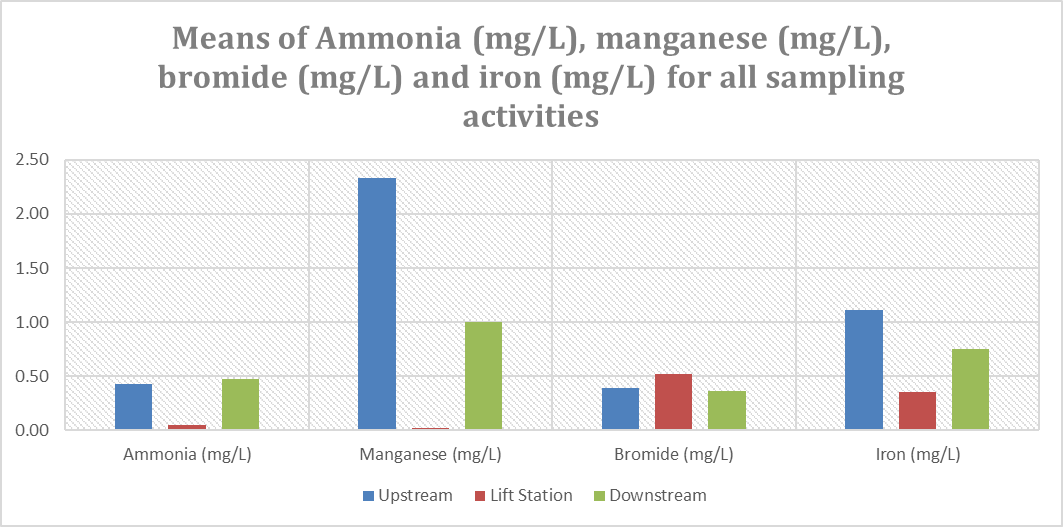
Differences in the Ammonia, Manganese, Bromide and Iron levels
Based on the results of each sampling activity, ammonia (mg/L) levels were mostly lower or similar than the levels in the upstream and downstream samples except upstream and downstream samples that were collected on June 12, 2018 and upstream samples collected on September 30, 2019. The manganese (mg/L) levels of the lift station samples were lower than the levels in upstream and downstream samples at all times. Bromide (mg/L) levels of the lift station samples were mostly higher than the upstream and downstream samples except upstream and downstream samples that were collected on May 11, 2016, May 10, 2017, and June 12, 2018. Iron (mg/L) levels of the lift station samples were either non-detectable (0.50 mg/L) or were lower than the upstream and downstream samples except, one set of sample that was collected on August 17, 2017. Details are in Table 10.
| Date | Site | Ammonia (mg/L) | Manganese (mg/L) | Bromide (mg/L) | Iron (mg/L) |
|---|---|---|---|---|---|
| November 9, 2015 | Upstream | 1.77 | 0.26 | NA | 1.30 |
| November 9, 2015 | Lift Station | ND | ND | NA | ND |
| November 9, 2015 | Downstream | 2.10 | 0.23 | NA | 0.93 |
| May 11, 2016 | Upstream | 0.05 | 0.59 | 0.87 | 0.24 |
| May 11, 2016 | Lift Station | ND | 0.01 | 0.71 | ND |
| May 11, 2016 | Downstream | 0.08 | 0.94 | 0.85 | 0.18 |
| July 11, 2016 | Upstream | 0.29 | 0.11 | 0.05 | 1.14 |
| July 11, 2016 | Lift Station | 0.03 | 0.01 | 0.64 | 0.35 |
| July 11, 2016 | Downstream | 0.06 | 0.07 | 0.05 | 0.99 |
| September 8, 2016 | Upstream | 0.06 | 2.54 | 0.43 | 0.58 |
| September 8, 2016 | Lift Station | ND | 0.02 | 0.64 | 0.08 |
| September 8, 2016 | Downstream | 0.13 | 0.77 | 0.33 | 0.24 |
| May 10, 2017 | Upstream | 0.25 | 6.29 | 0.64 | 2.89 |
| May 10, 2017 | Lift Station | 0.03 | 0.01 | 0.53 | 0.05 |
| May 10, 2017 | Downstream | 0.13 | 0.62 | 0.68 | 0.44 |
| August 17, 2017 | Upstream | 0.09 | 0.61 | 0.29 | 0.62 |
| August 17, 2017 | Lift Station | 0.03 | 0.02 | 0.51 | 1.28 |
| August 17, 2017 | Downstream | 0.03 | 0.80 | 0.32 | 1.11 |
| June 12, 2018 | Upstream | 0.04 | 1.81 | 0.35 | 0.83 |
| June 12, 2018 | Lift Station | 0.05 | 0.04 | 0.33 | ND |
| June 12, 2018 | Downstream | 0.04 | 1.65 | 0.36 | 0.72 |
| August 26, 2019 | Upstream | 0.08 | 1.32 | 0.23 | 0.12 |
| August 26, 2019 | Lift Station | ND | ND | 0.42 | ND |
| August 26, 2019 | Downstream | ND | 0.16 | 0.32 | 0.12 |
| September 30, 2019 | Upstream | 0.04 | 0.06 | ND | 1.64 |
| September 30, 2019 | Lift Station | 0.14 | ND | 0.40 | 0.31 |
| September 30, 2019 | Downstream | 0.52 | 0.08 | 0.05 | 1.86 |
| July 6, 2020 | Upstream | 1.55 | 9.75 | 0.19 | 1.77 |
| July 6, 2020 | Lift Station | 0.01 | 0.01 | 0.42 | 0.02 |
| July 6, 2020 | Downstream | 1.15 | 4.66 | 0.29 | 0.86 |
Based on the cumulative means of all sampling activities, ammonia (mg/L), manganese (mg/L) and iron (mg/L) levels of the lift station samples were lower than the upstream and downstream samples, whereas, bromide (mg/L) levels of the lift station samples were higher than the upstream and downstream samples.