Dickinson REC 2025 Annual Report
((Research Report, Dickinson REC, December 2025))
NDSU Dickinson Research Extension Center Staff
Current Staff-2025
Chris Augustin Director/Soil Scientist
Victor Gomes Extension Cropping Systems Specialist
Cristin Heidecker Administrative Secretary
Krishna Katuwal Research Agronomist
Doug Landblom Associate Research Extension Center Specialist
Eudell Larson Ag Research Technician
Llewellyn Manske Scientist of Rangeland Research
Glenn Martin Research Specialist
Dean Nelson Ag Research Technician
Rutendo Nyamusamba Extension Conservation Agronomist Specialist
Phyllis Okland Administrative Assistant
Samuel Olorunkoya Research Specialist
Garry Ottmar Livestock Research Specialist
Wanda Ottmar Ag Research Technician
Sheri Schneider Information Processing Specialist
Michael Strode Computer Technician
Lee Tisor Research Specialist
| 2025 Seasonal/Temporary Employees | |||
| John Urban | Michele Stoltz | Chuck Wanner | Tom Grey |
| Ashlyn Williams | Anastasia Kempenich | Mary Rose | Keaton Meek |
| Lorelei Jarrett | Bailey Binstock | Ryan Duppong | Songul Senturkla |
| Felix Acevedo | Kailey Brimmer | Brae Eneboe | Miguel Torress |
Advisory Board
Edward Cuskelly-Chair
Jacob Odermann-Vice-Chair
Dustin Elkins
John Hendrickson
Ryan Kadrmas
Bill Kessel
Kevin Kessel
Mike Gerbig
Chip Poland
Lavy Steiner
Bridget Bullinger
Blake Johnson
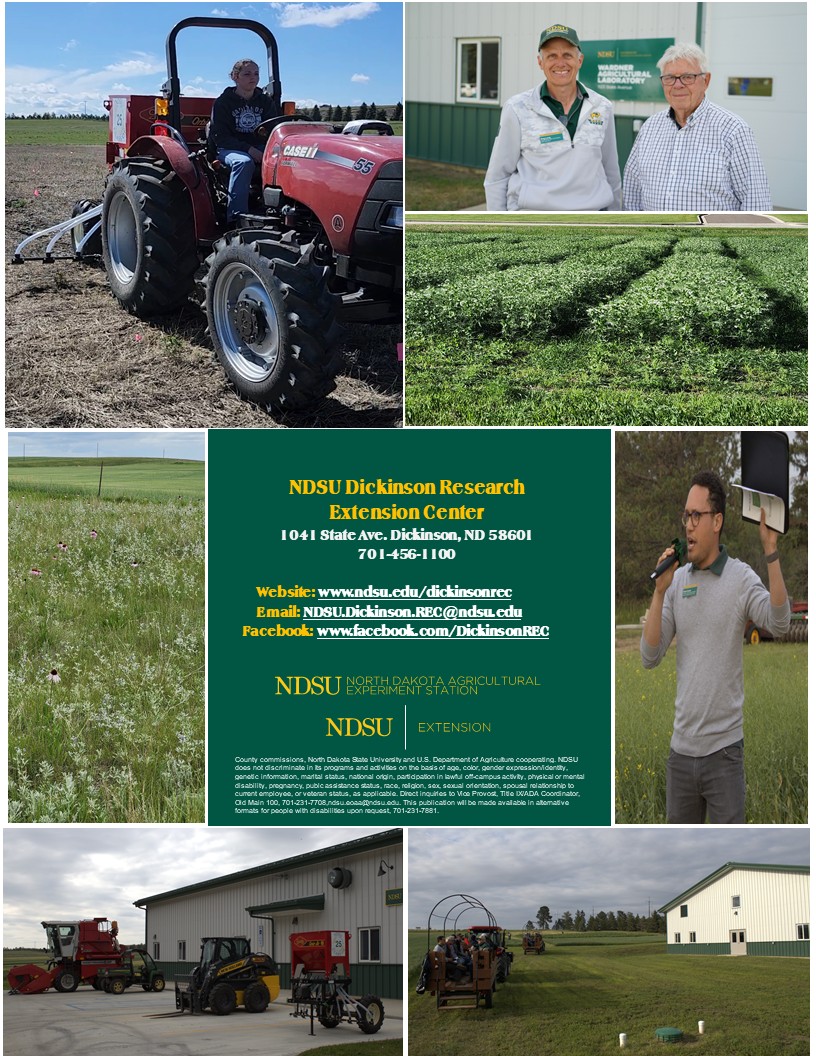
NDSU Dickinson Research Extension Center 1041 State Avenue
Dickinson, ND 58601
Phone: (701) 456-1100
Fax. (701) 456-1199
Website: https://www.ndsu.edu/agriculture/ag-hub/research-extension-centers-recs…
Email: NDSU.Dickinson.REC@ndsu.edu
NDSU is a equal opportunity institute.
NDSU does not discriminate in its programs and activities on the basis of age, color, gender expression/identity, genetic information, marital status, national origin, participation in lawful off-campus activity, physical or mental disability, pregnancy, public assistance status, race, religion, sex, sexual orientation, spousal relationship to current employee, or veteran status, as applicable. Direct inquiries to Vice Provost for Title IX/ADA Coordinator, Old Main 201, NDSU Main Campus, 701-231-7708, ndsu.eoaa@ndsu.edu. This publication will be made available in alternative formats for people with disabilities upon request, 701-231-7881.
Table of Contents
2025 Variety Trials
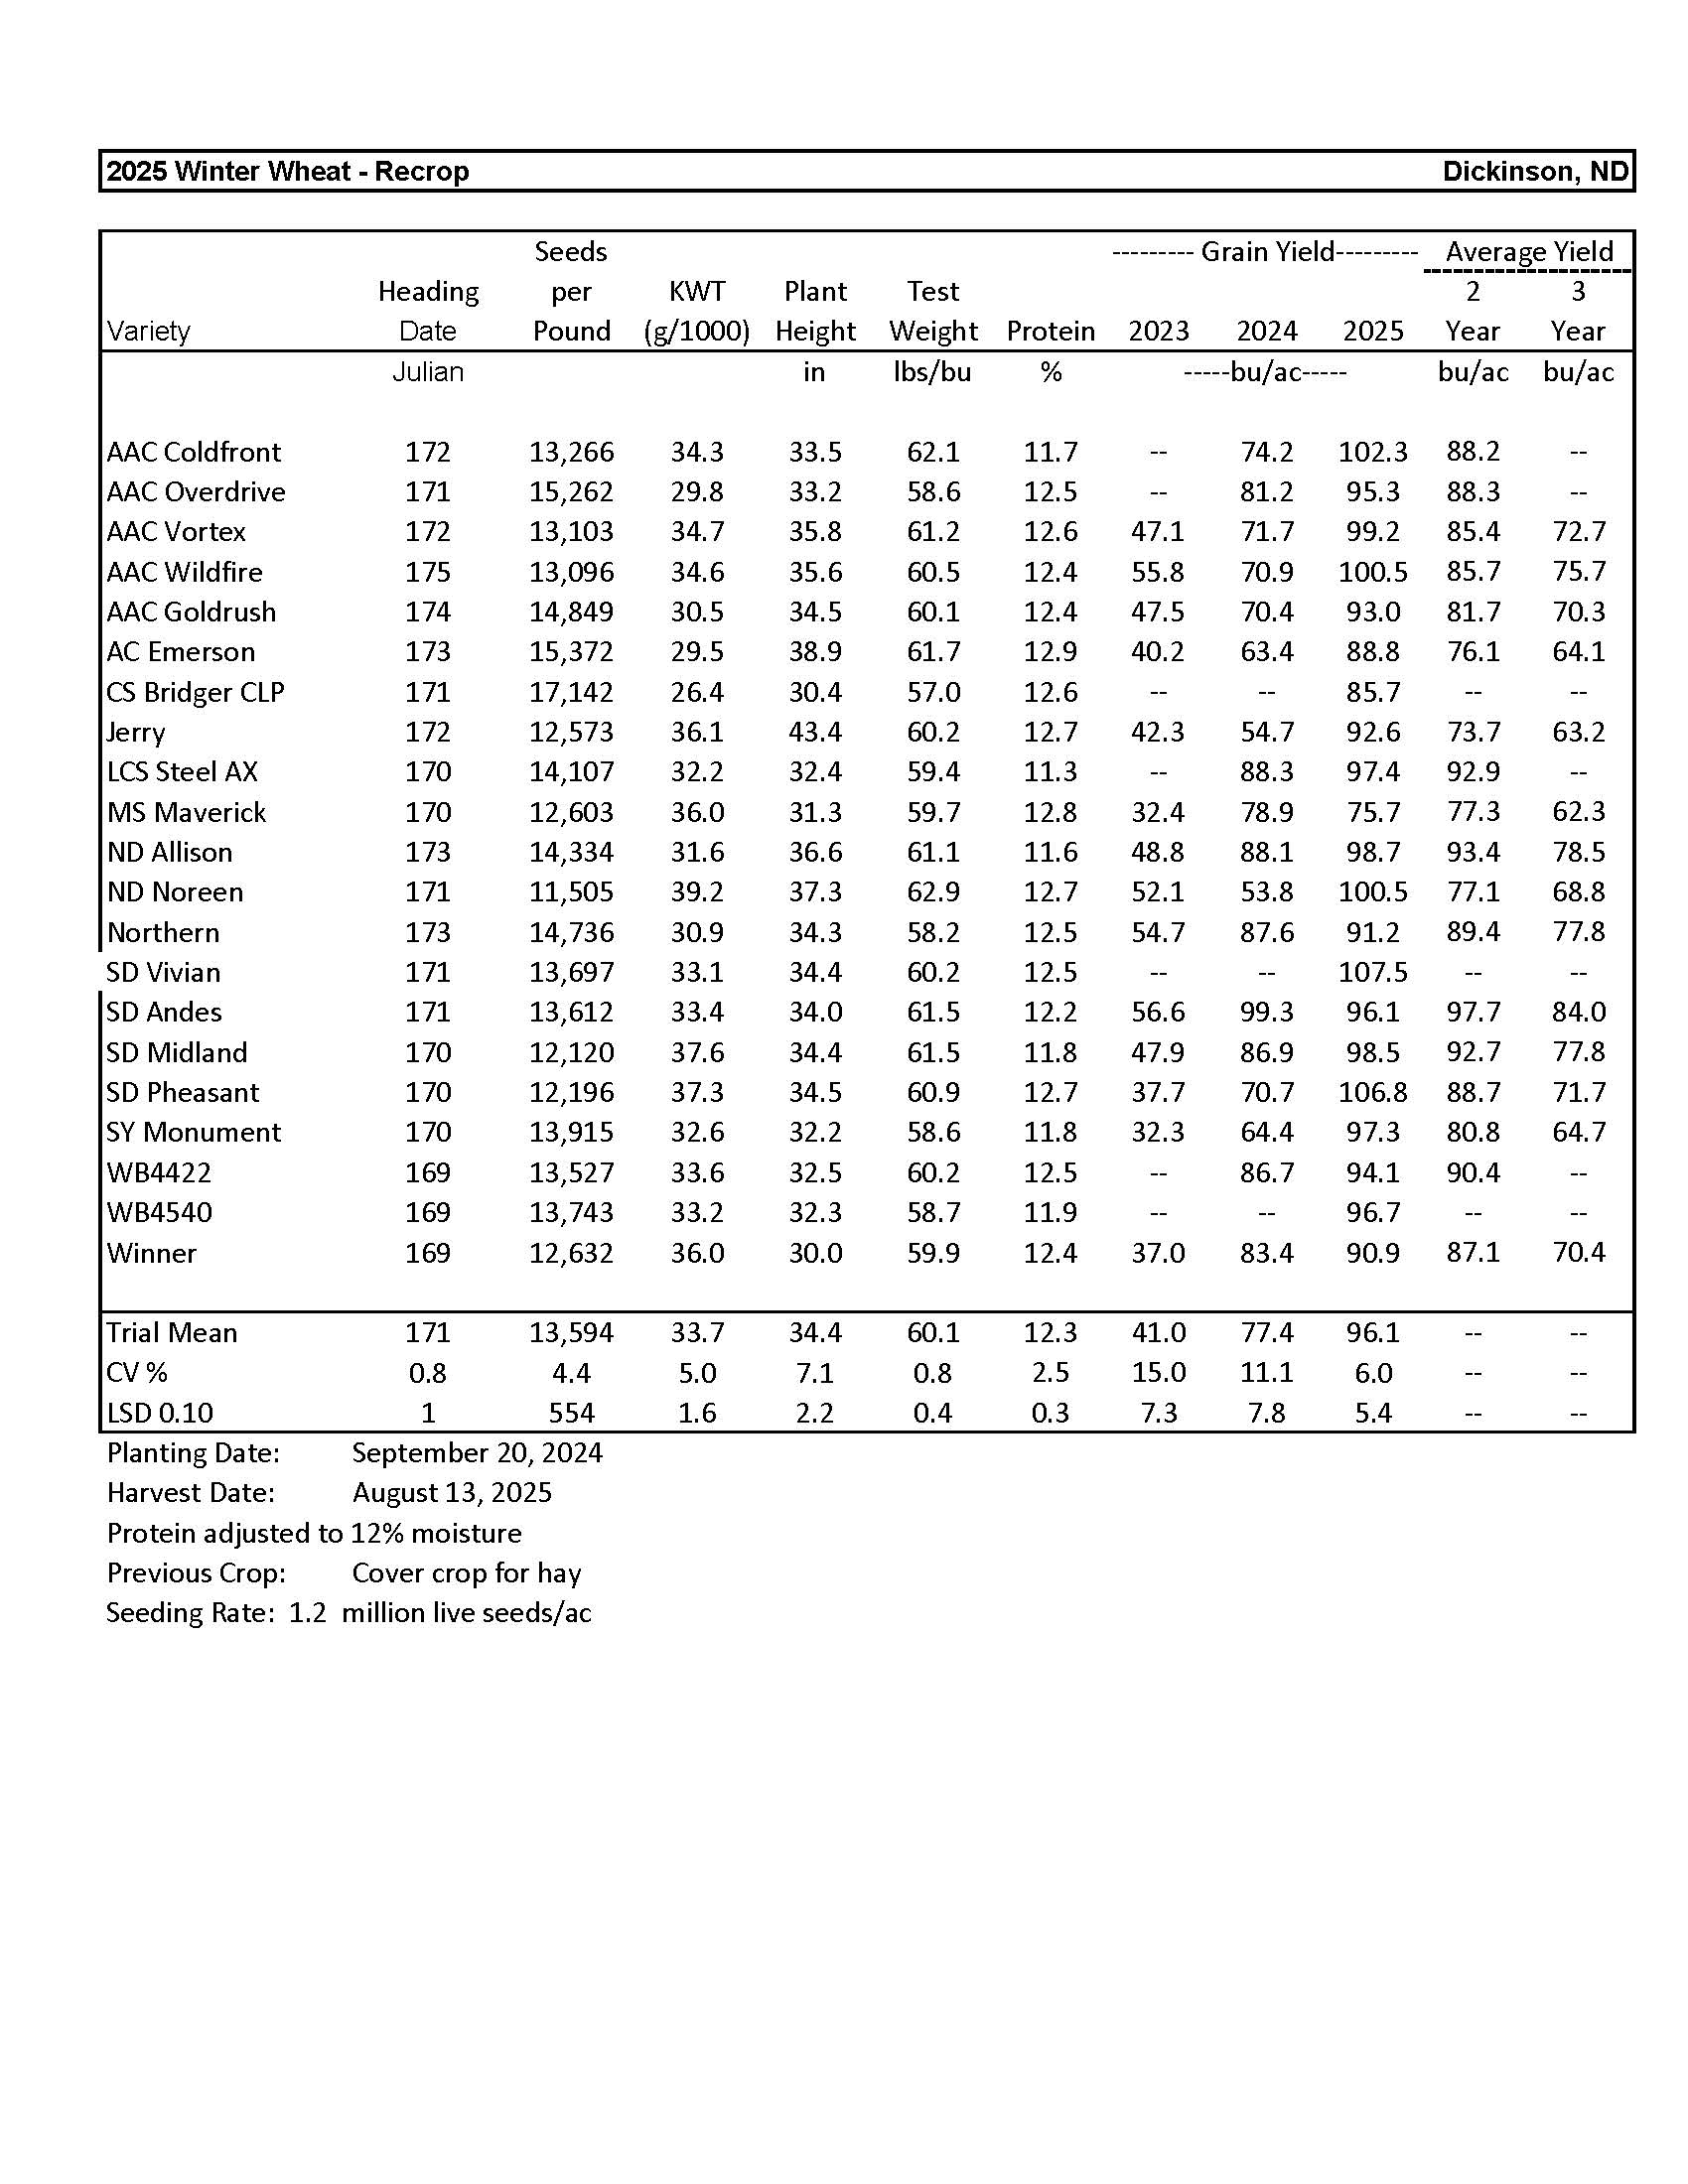
Winter Wheat........................................................................................................................ 5
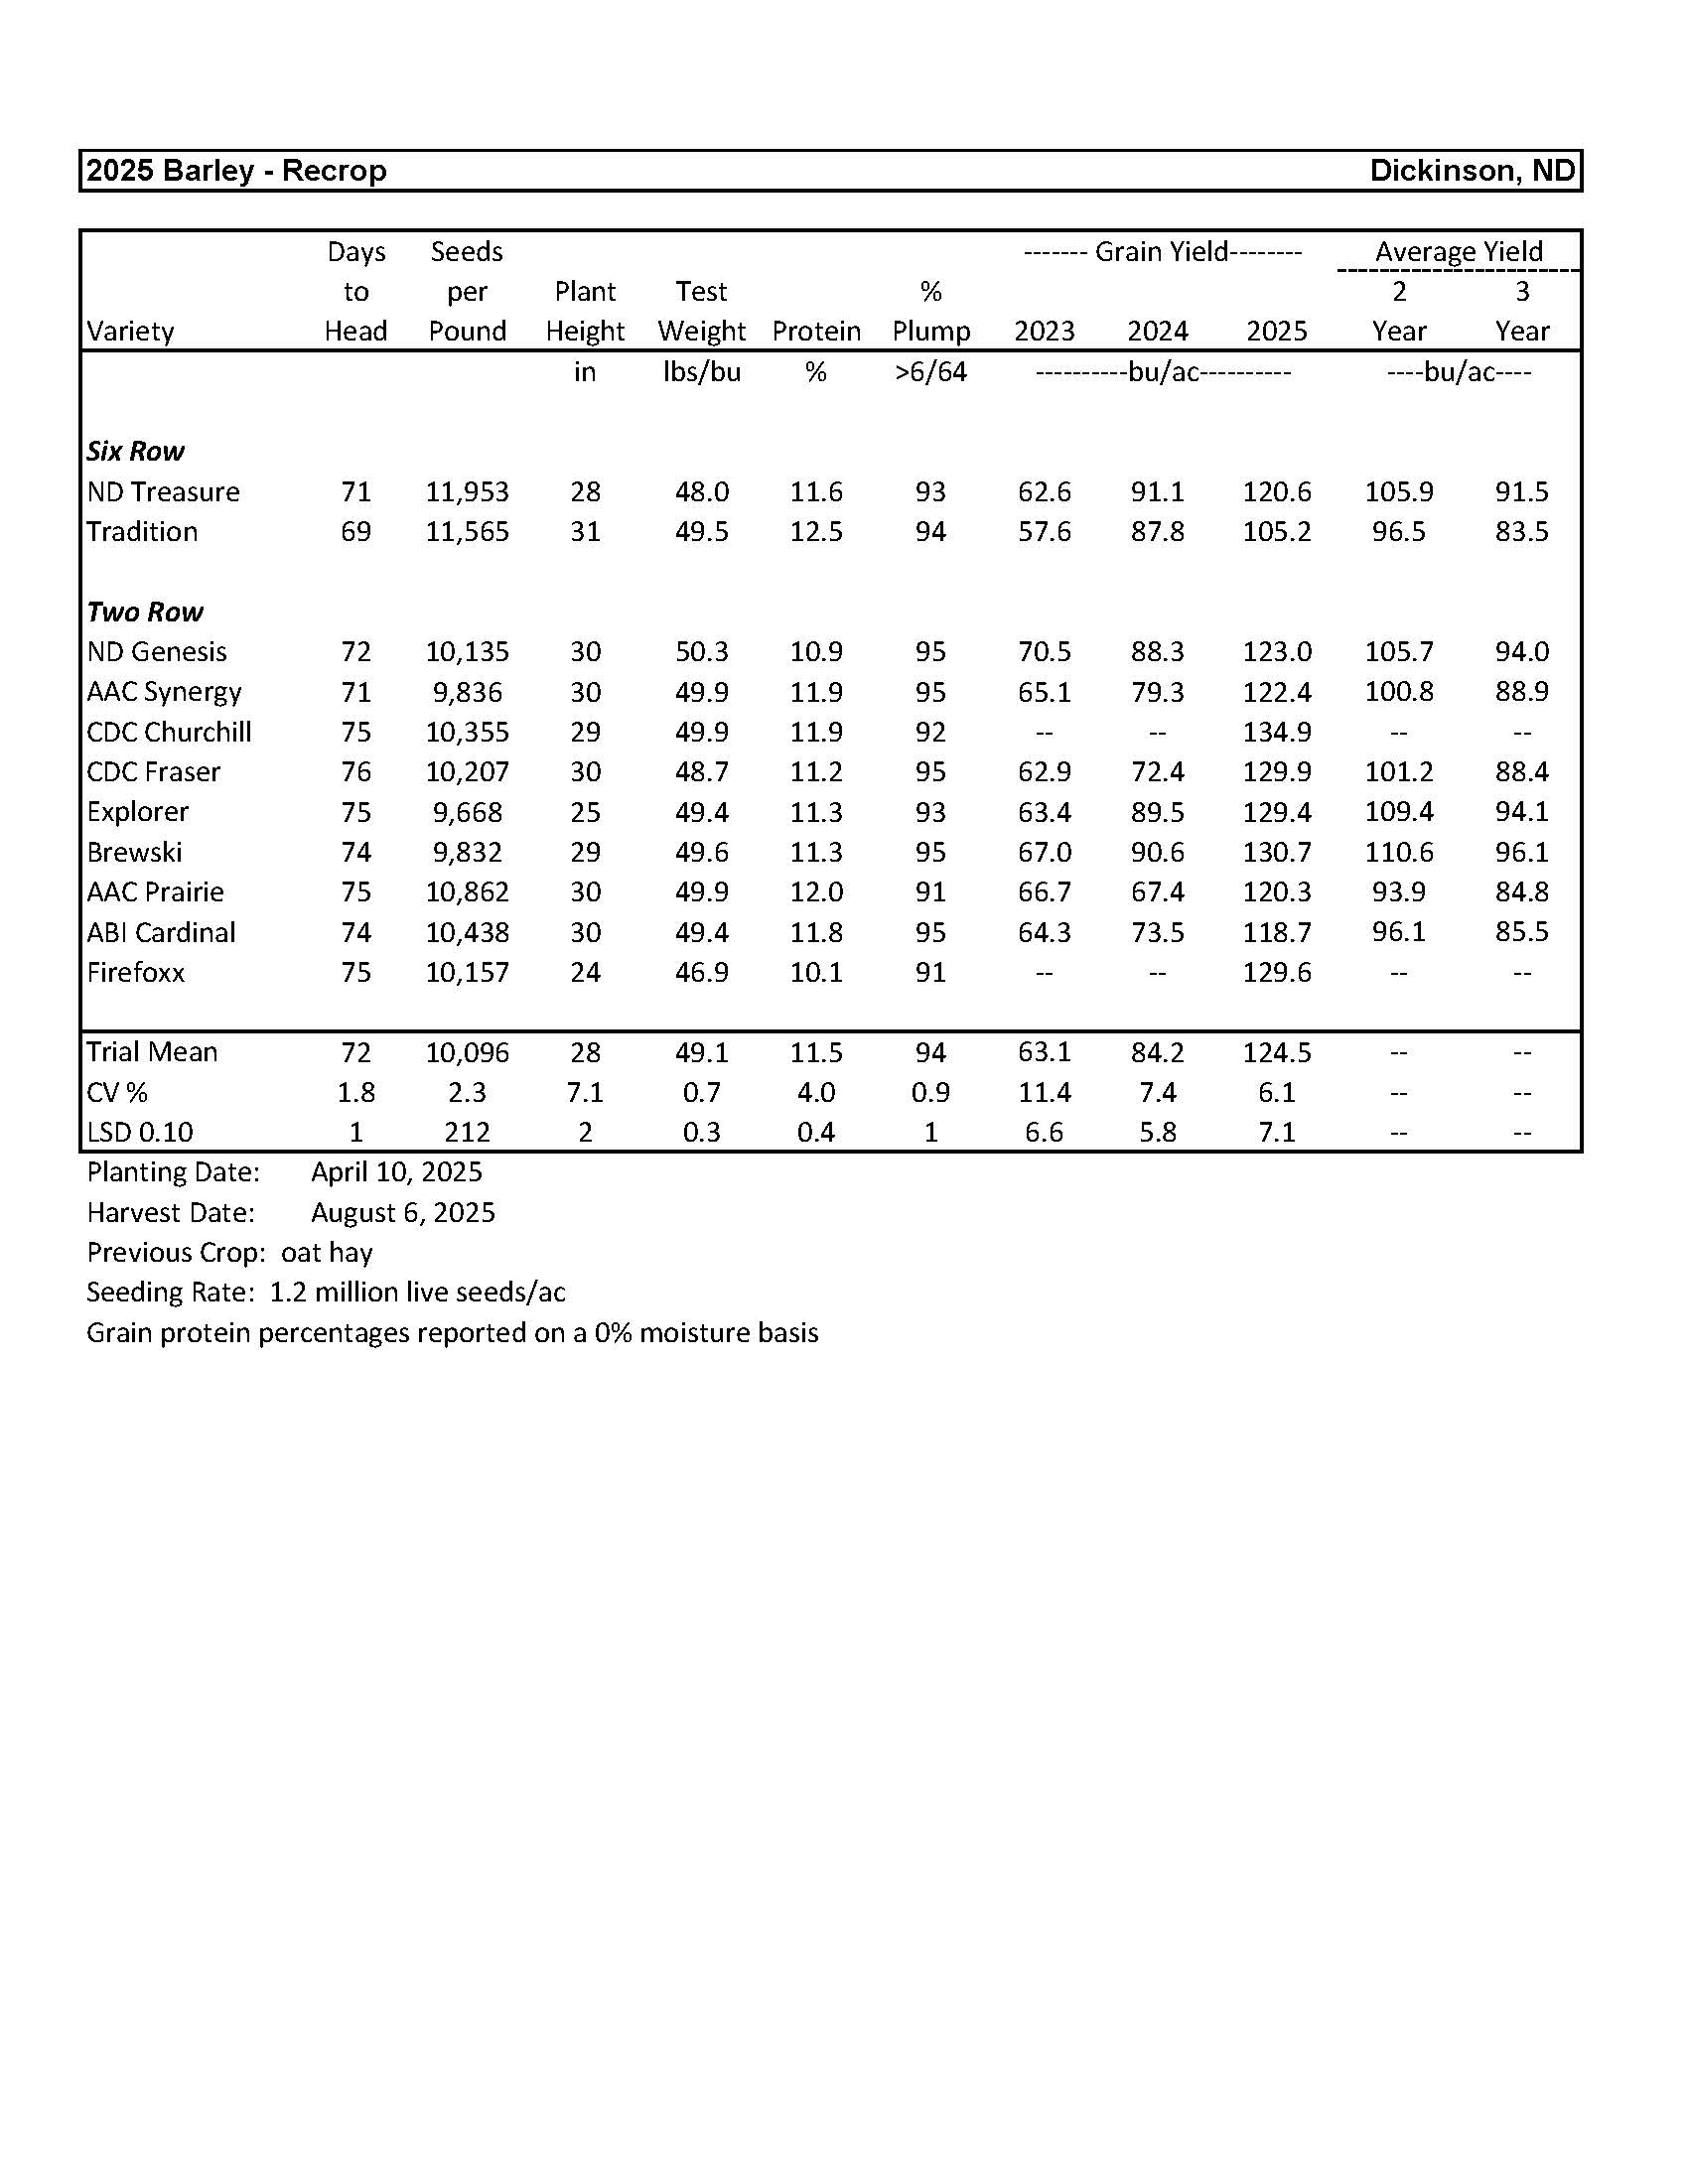
Barley................................................................................................................................... 6
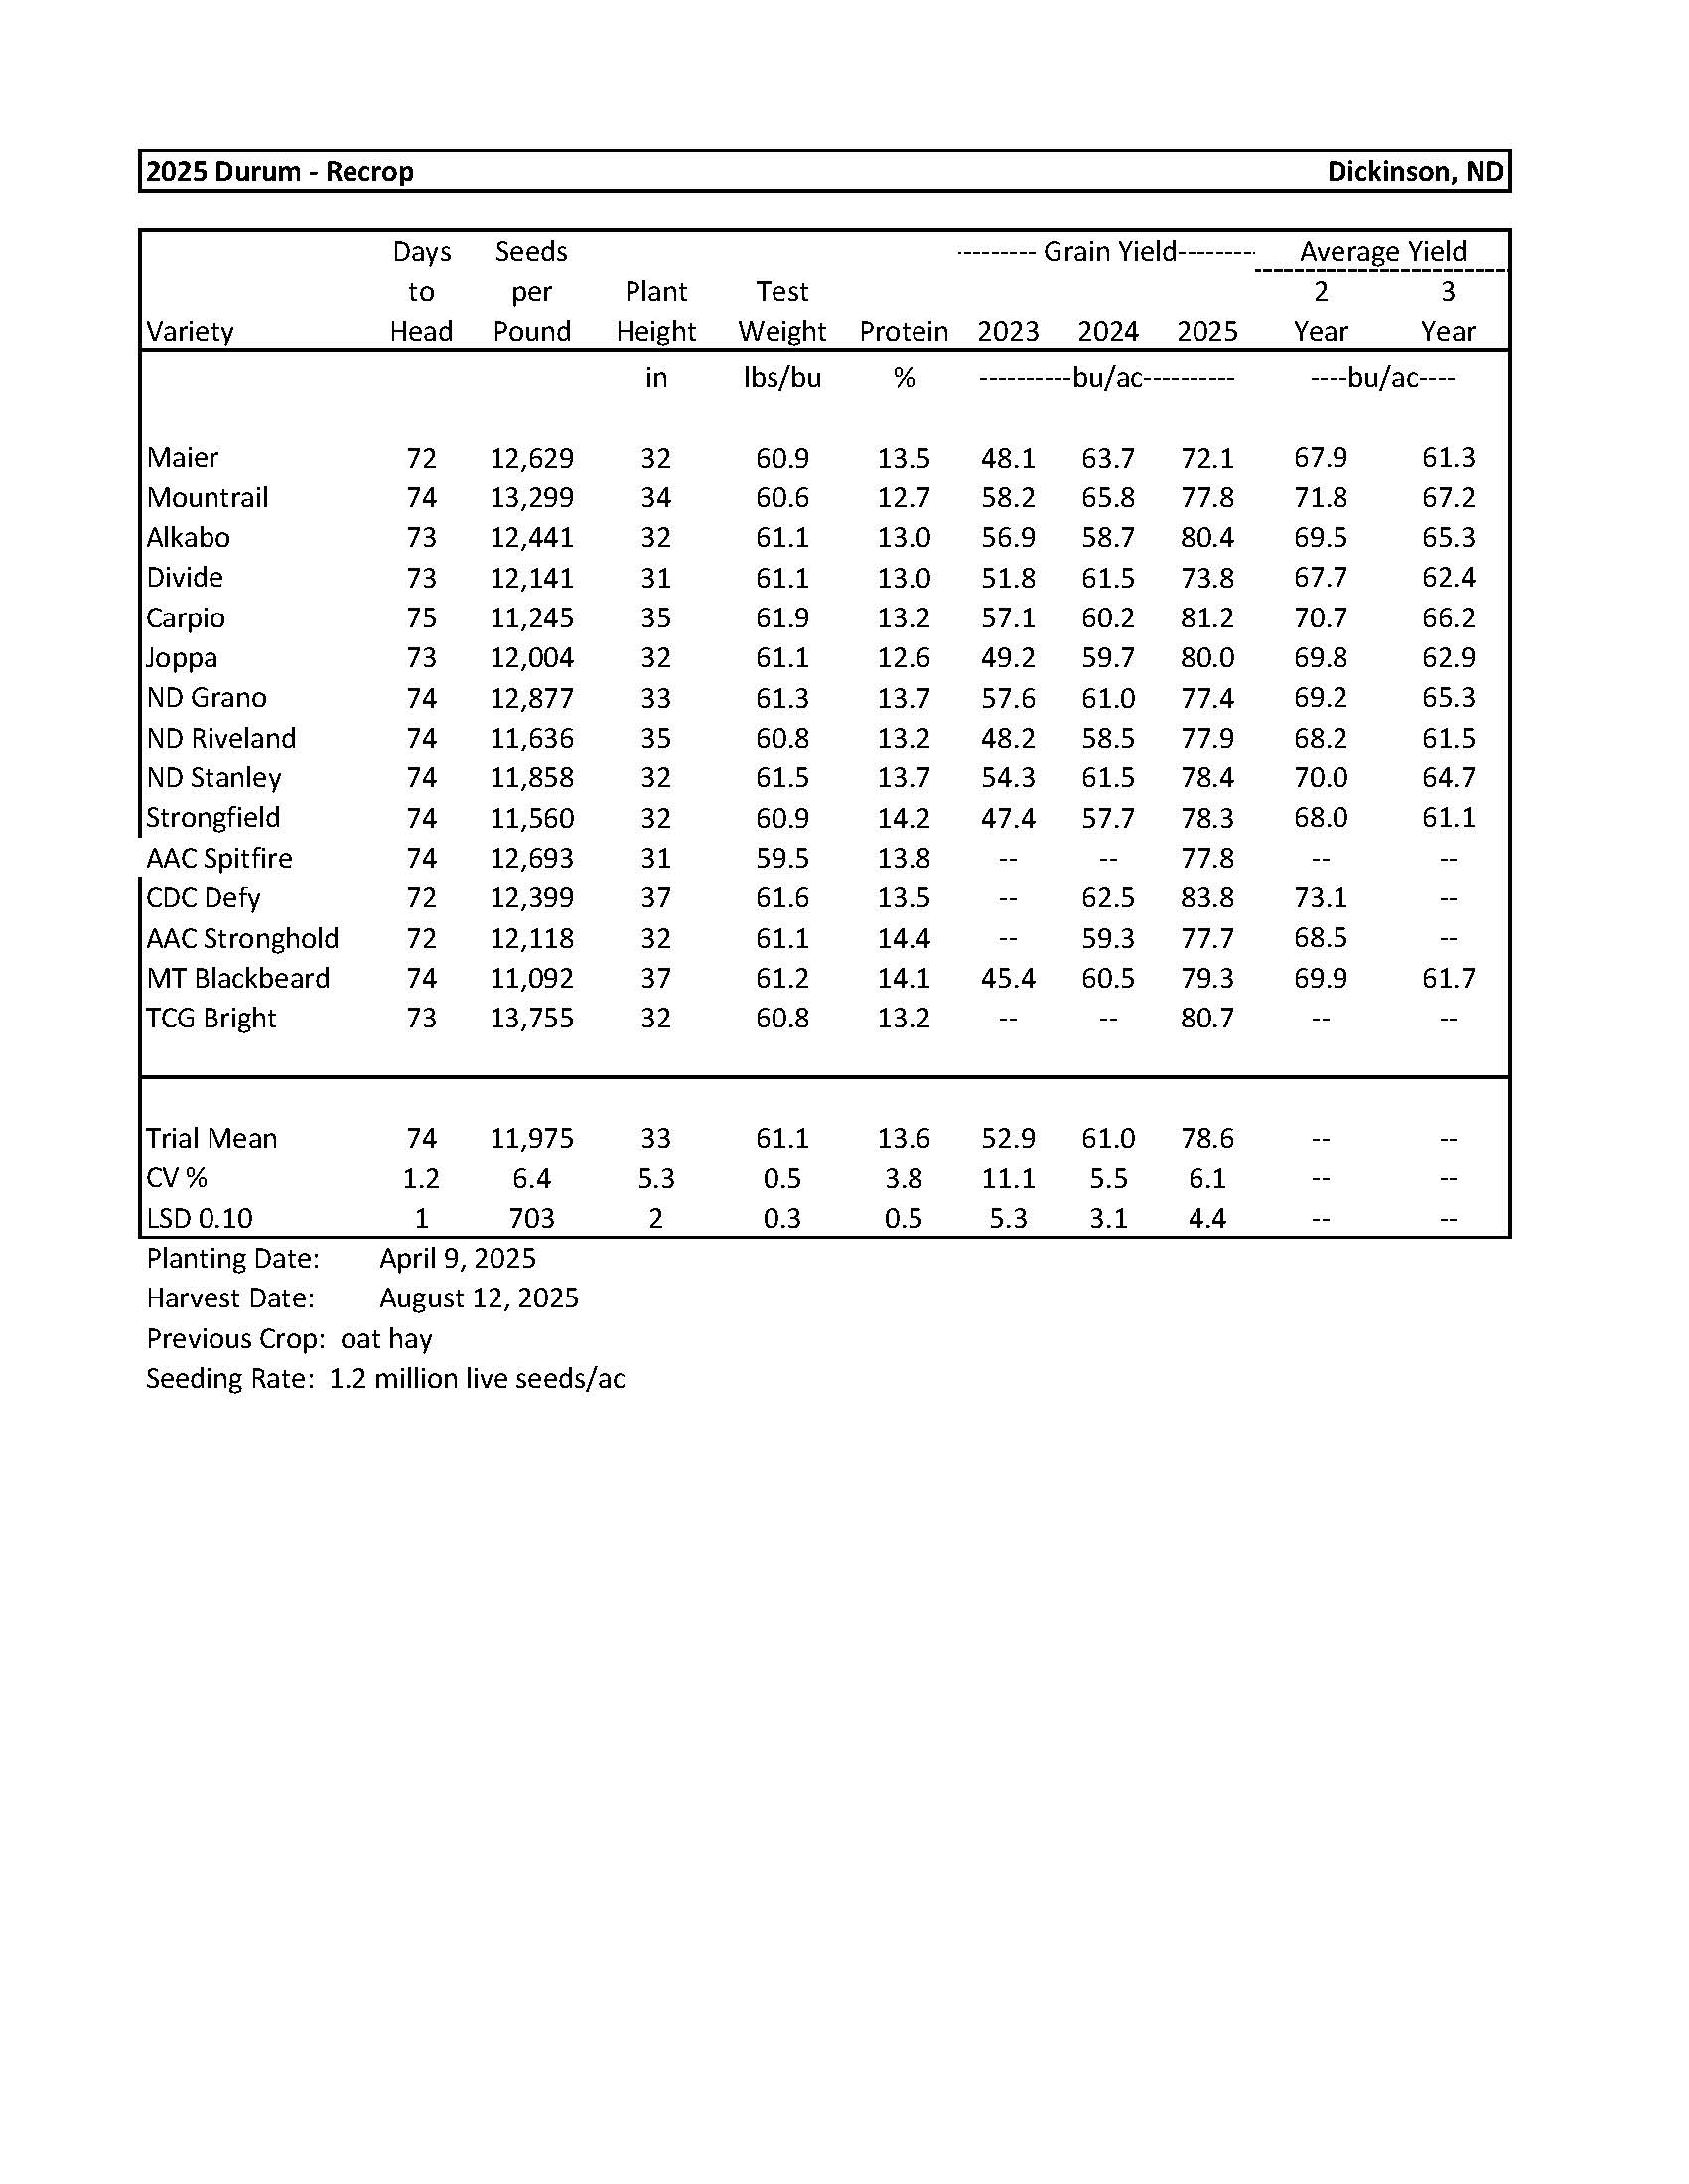
Durum................................................................................................................................... 7
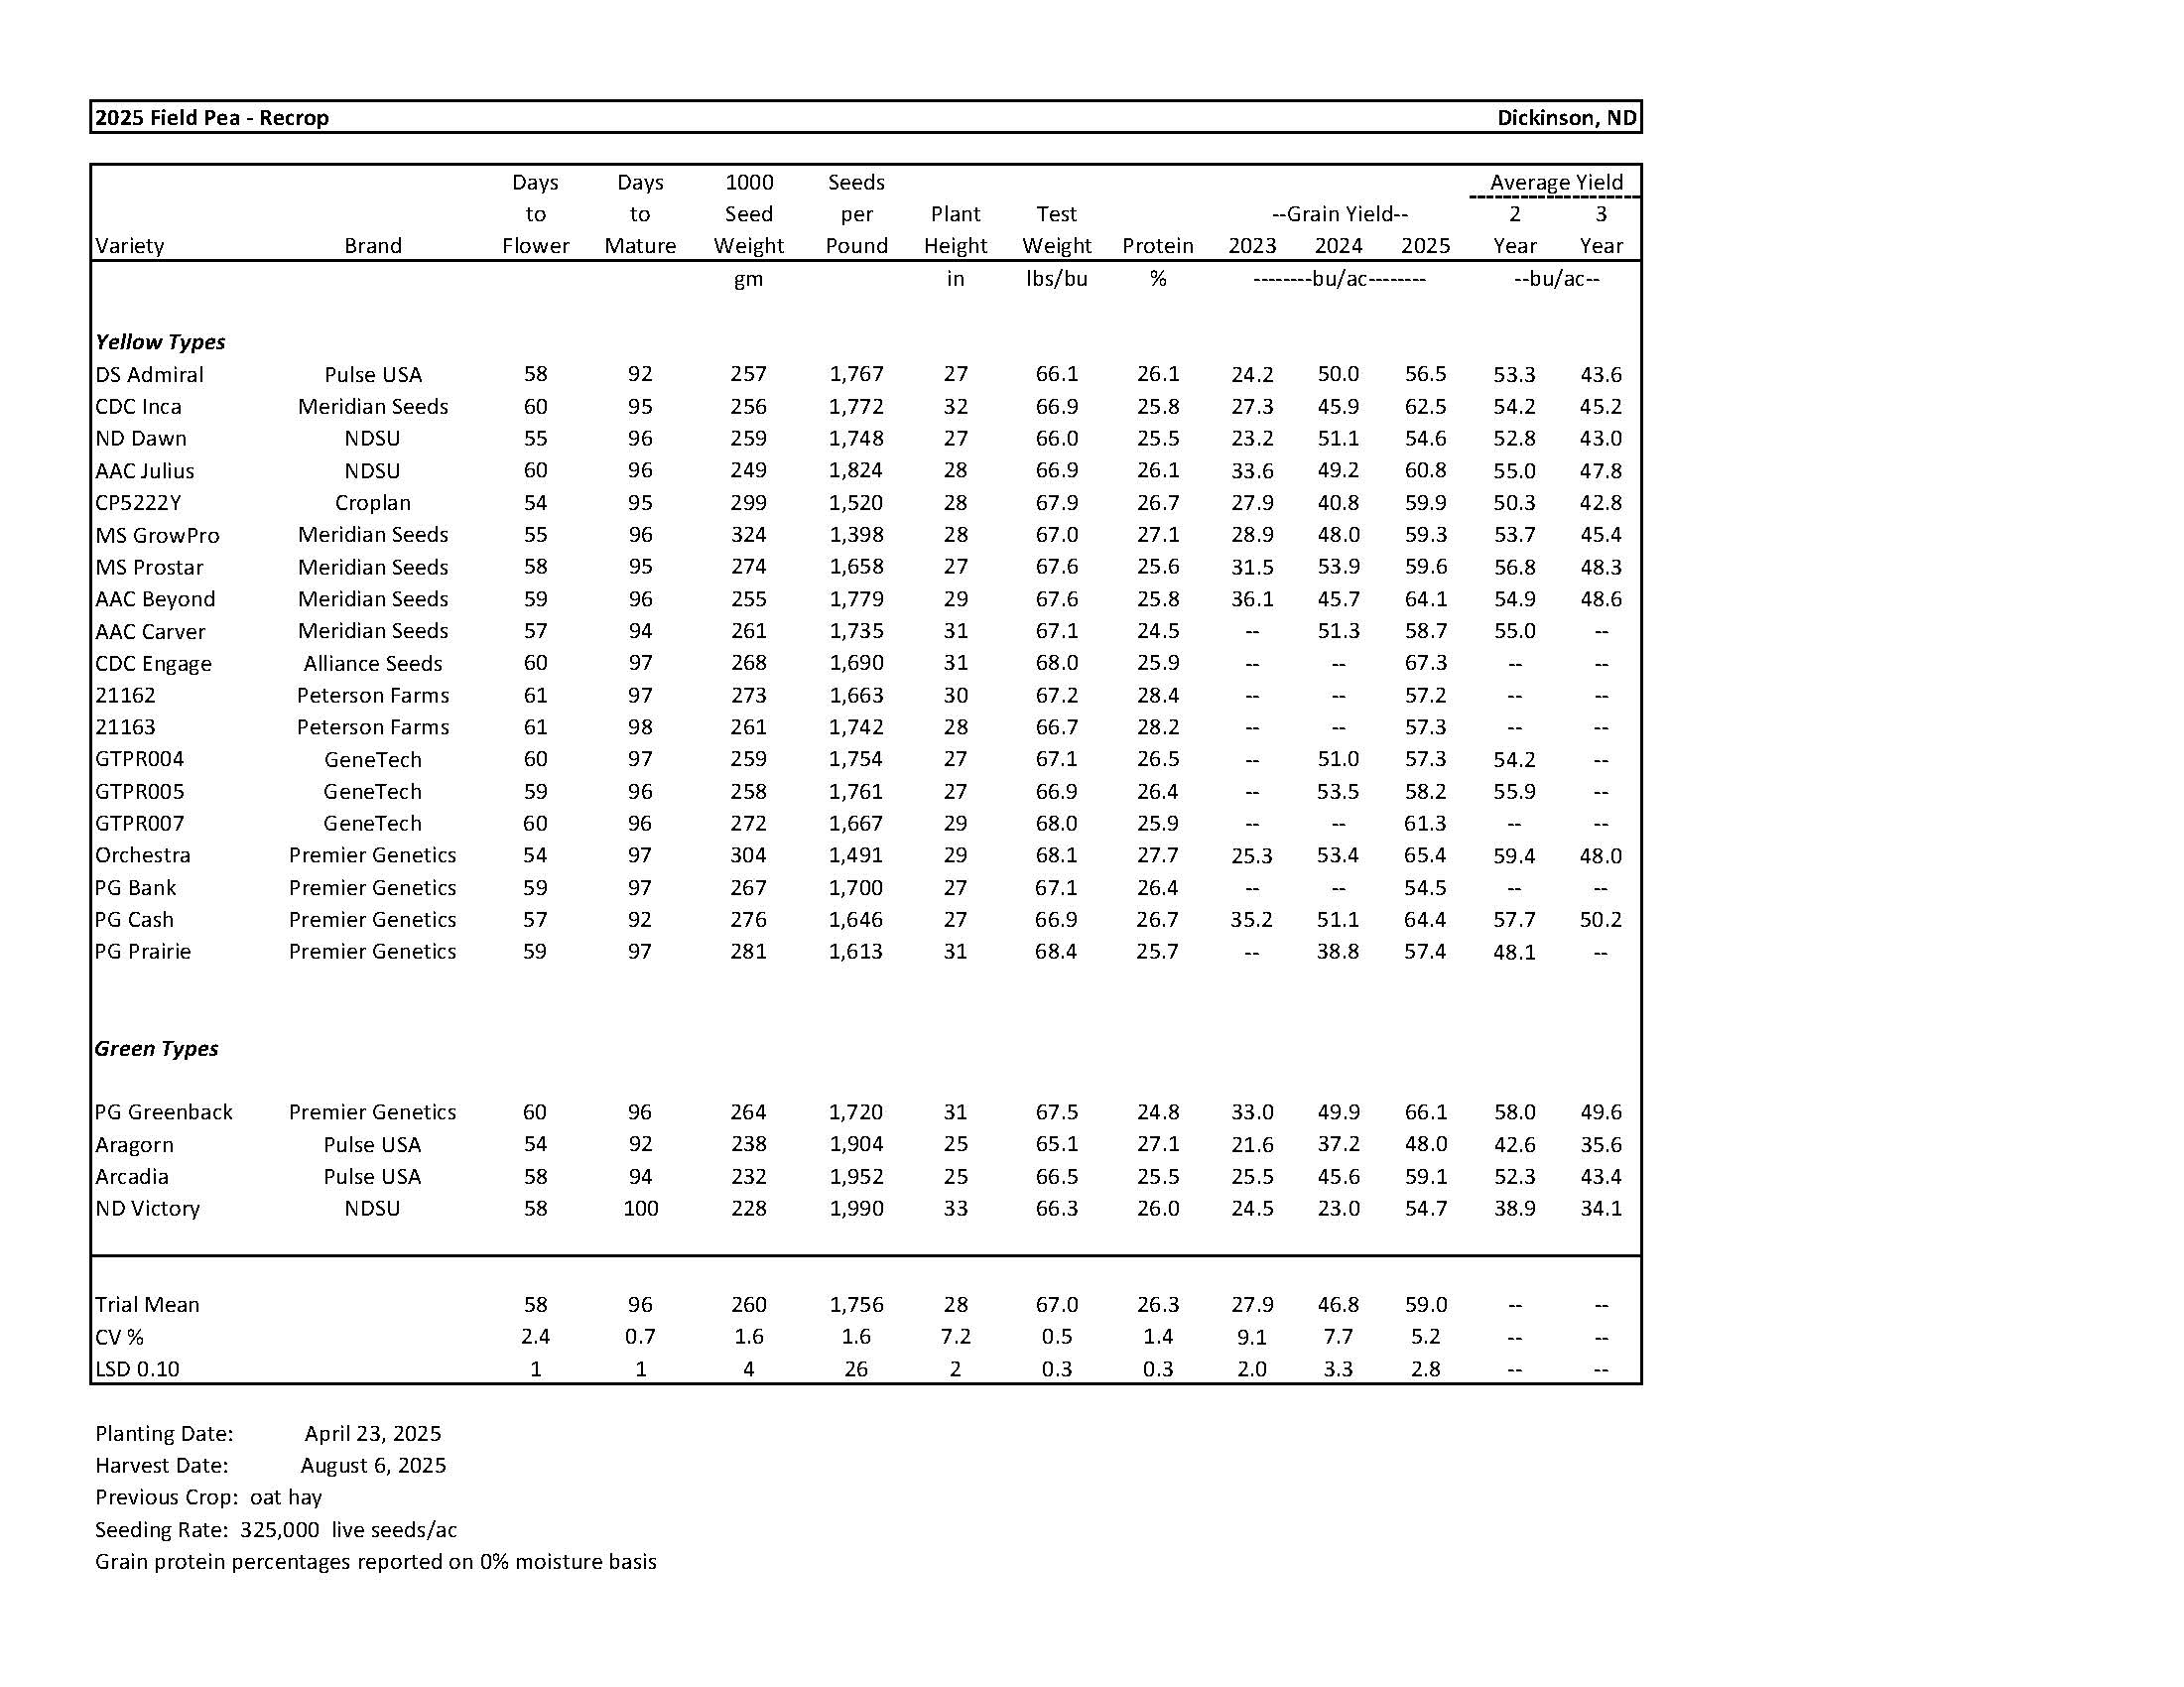
Field Pea............................................................................................................................... 8
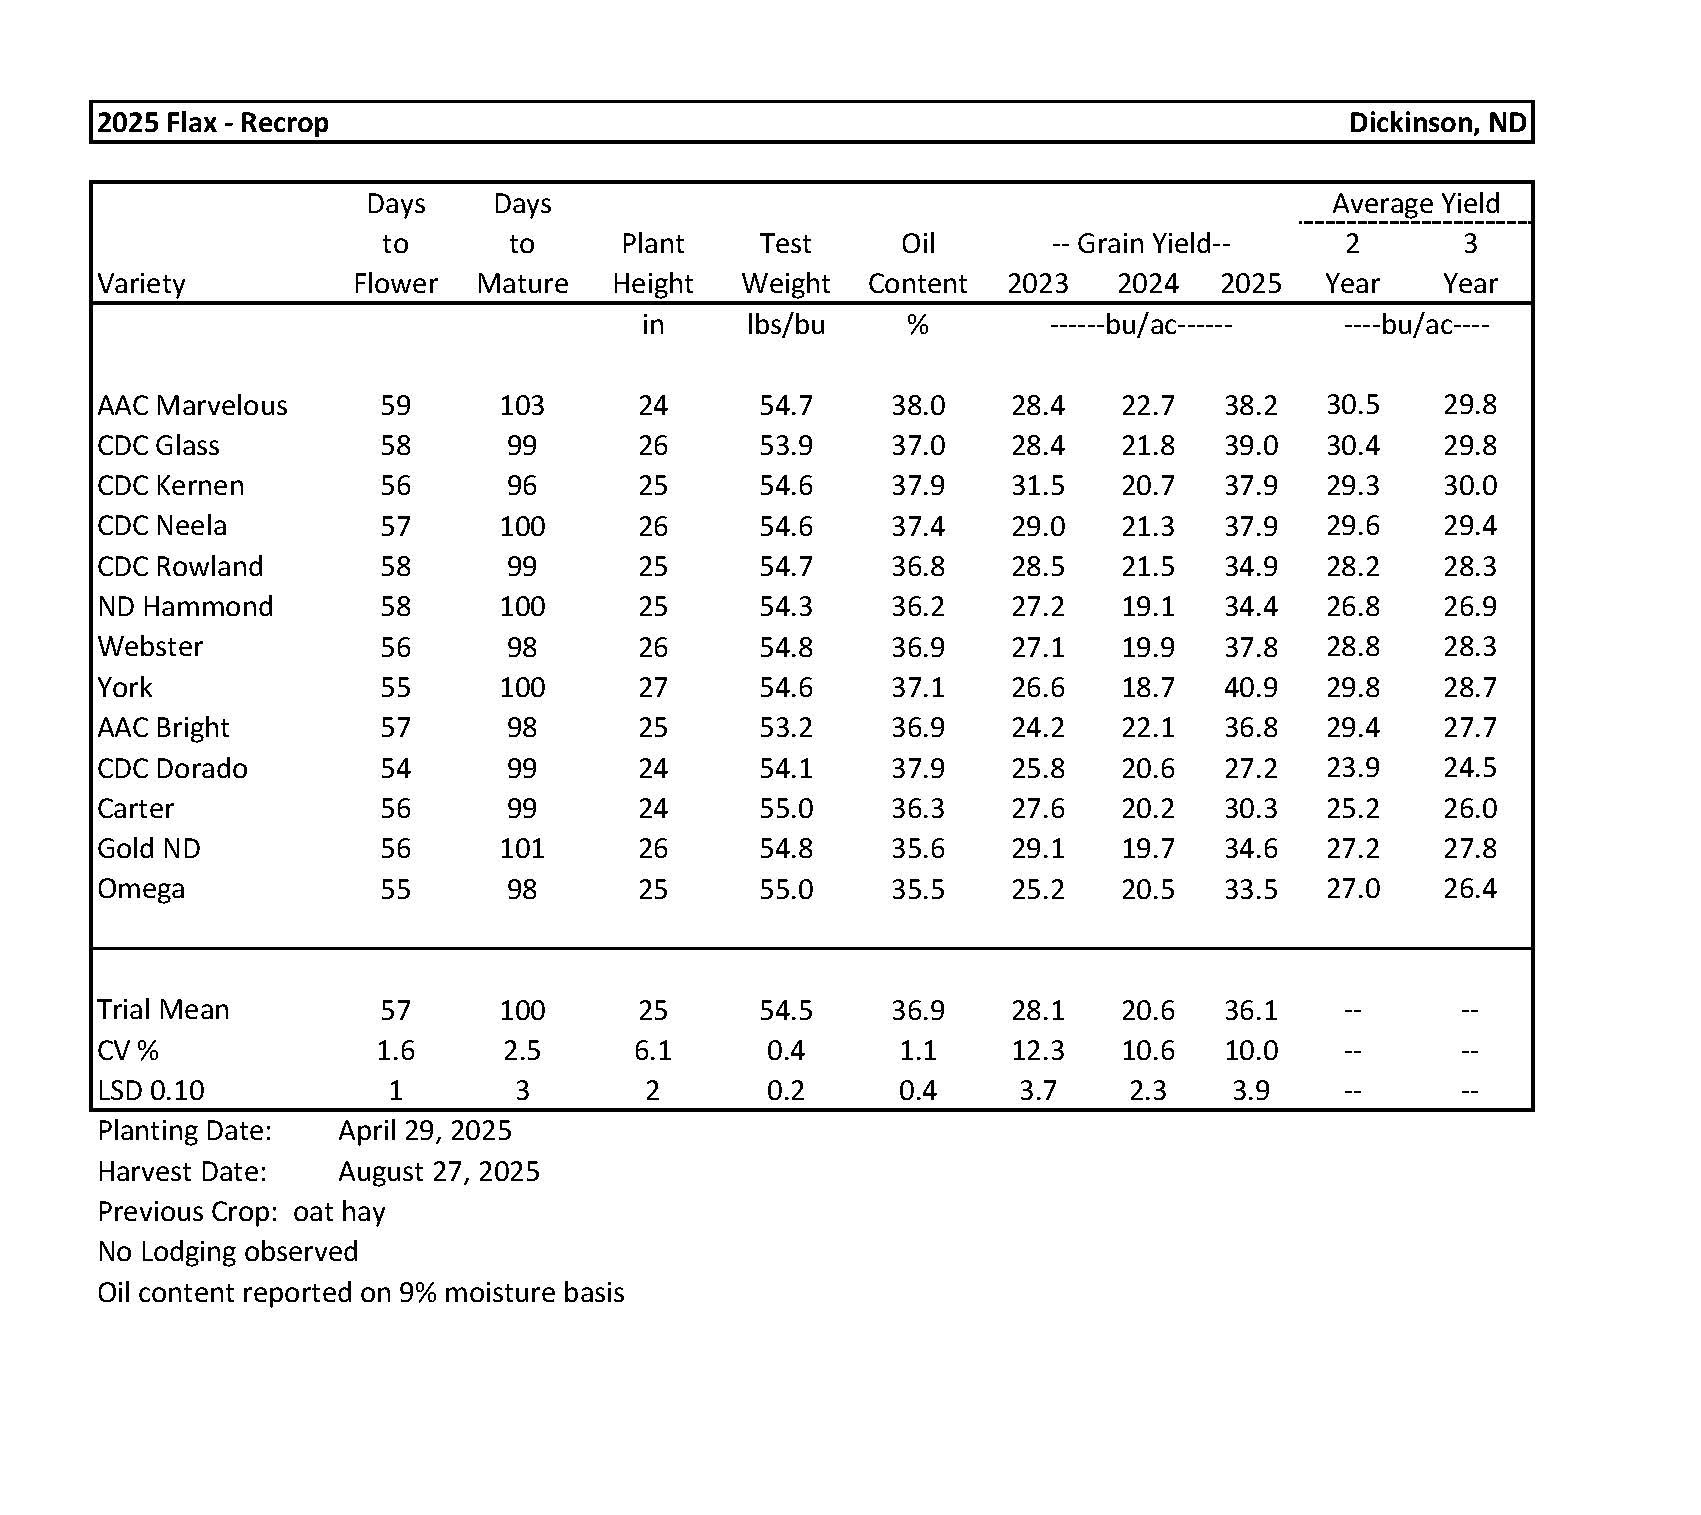
Flax....................................................................................................................................... 9
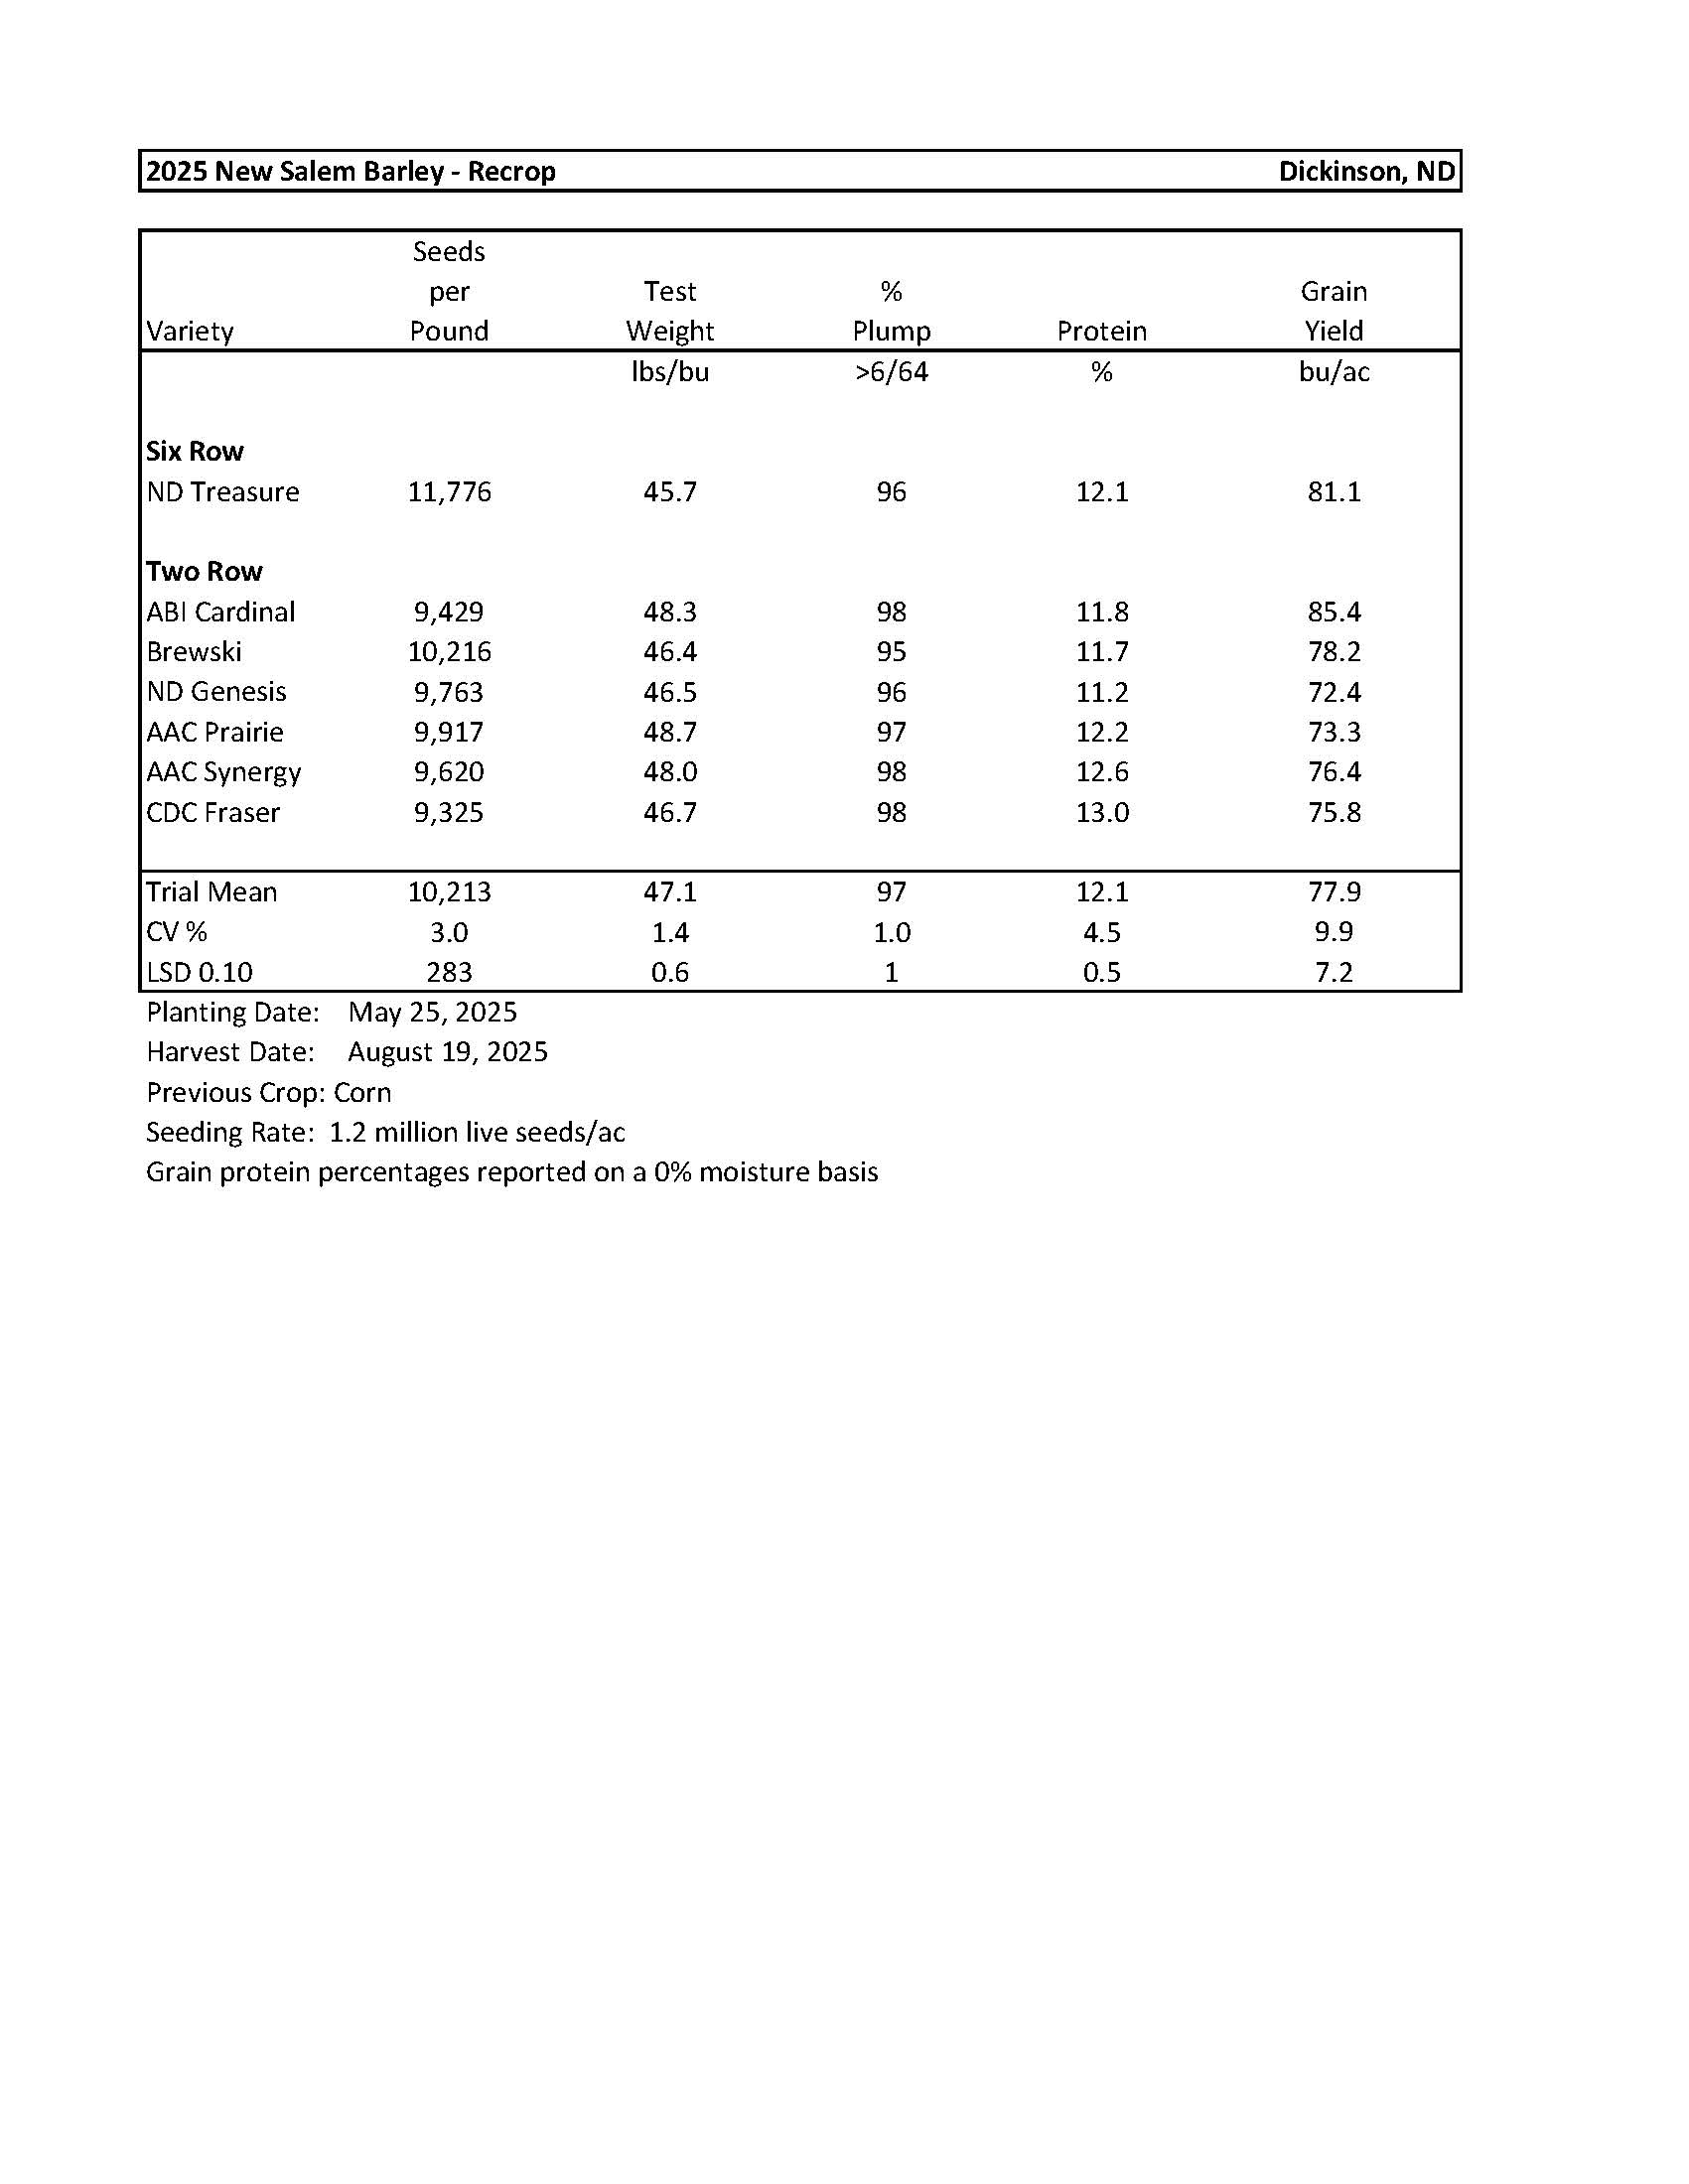
Barley-New Salem............................................................................................................... 10
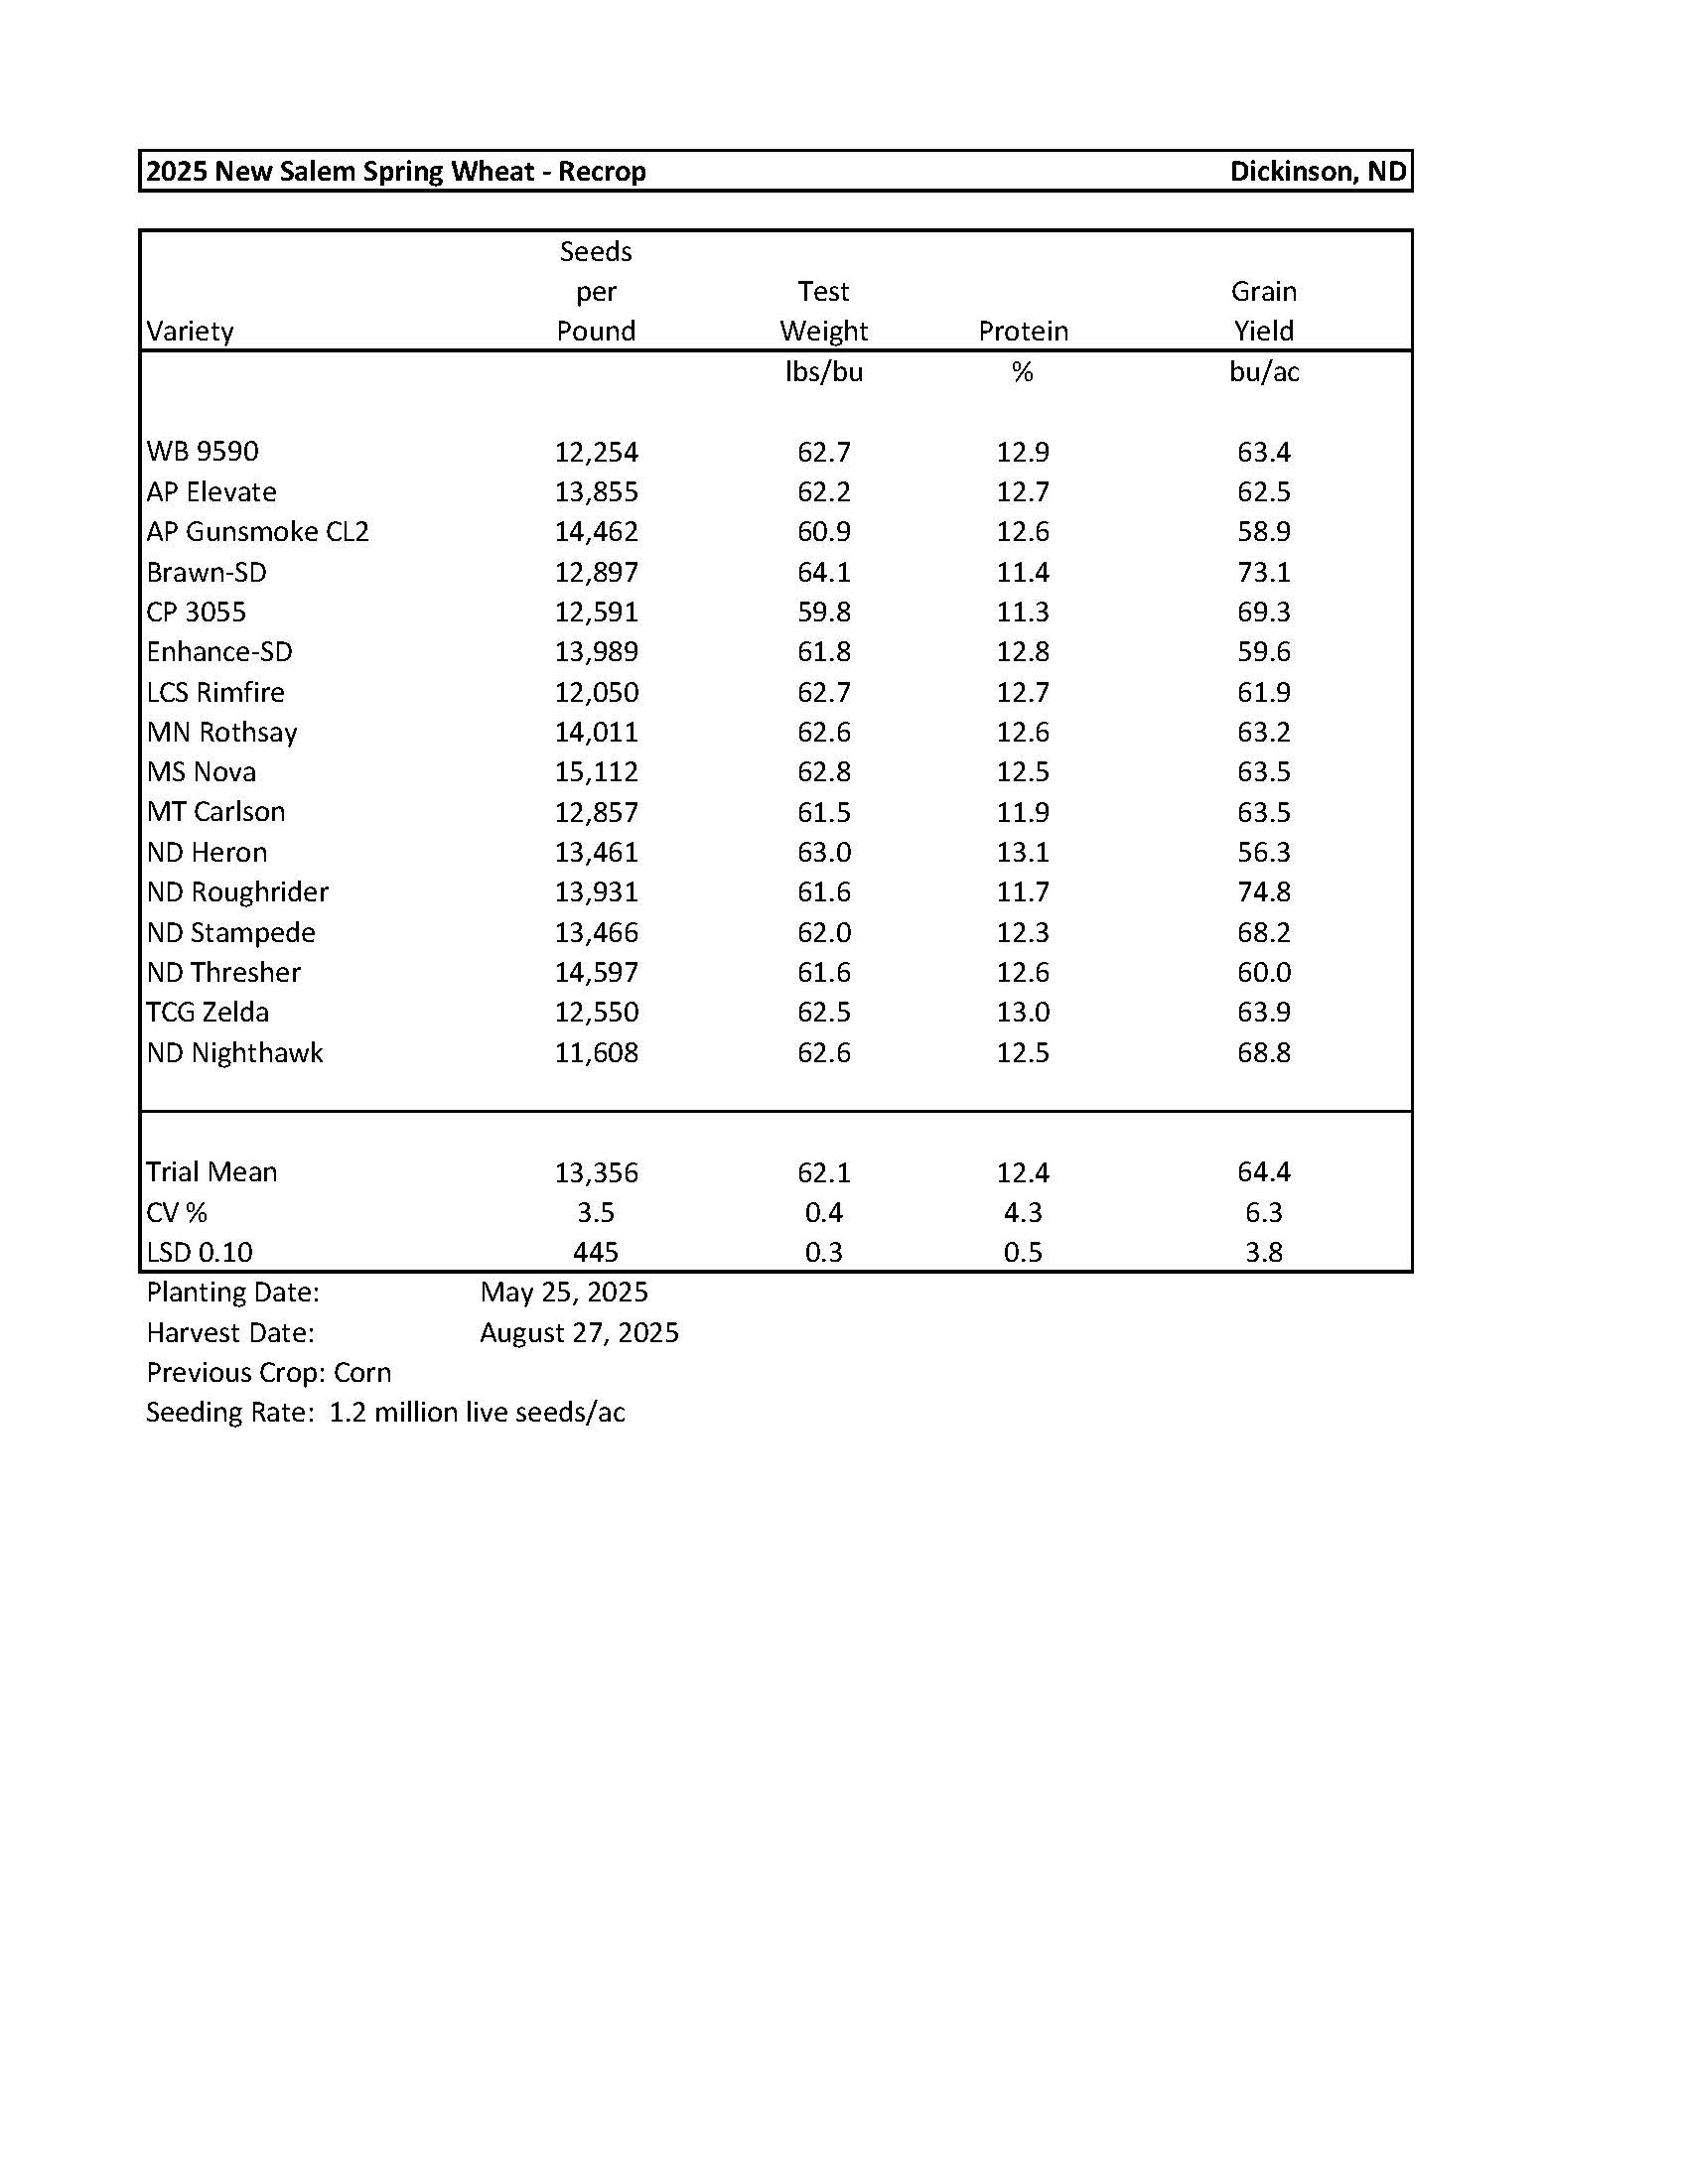
Spring Wheat-New Salem..................................................................................................... 11
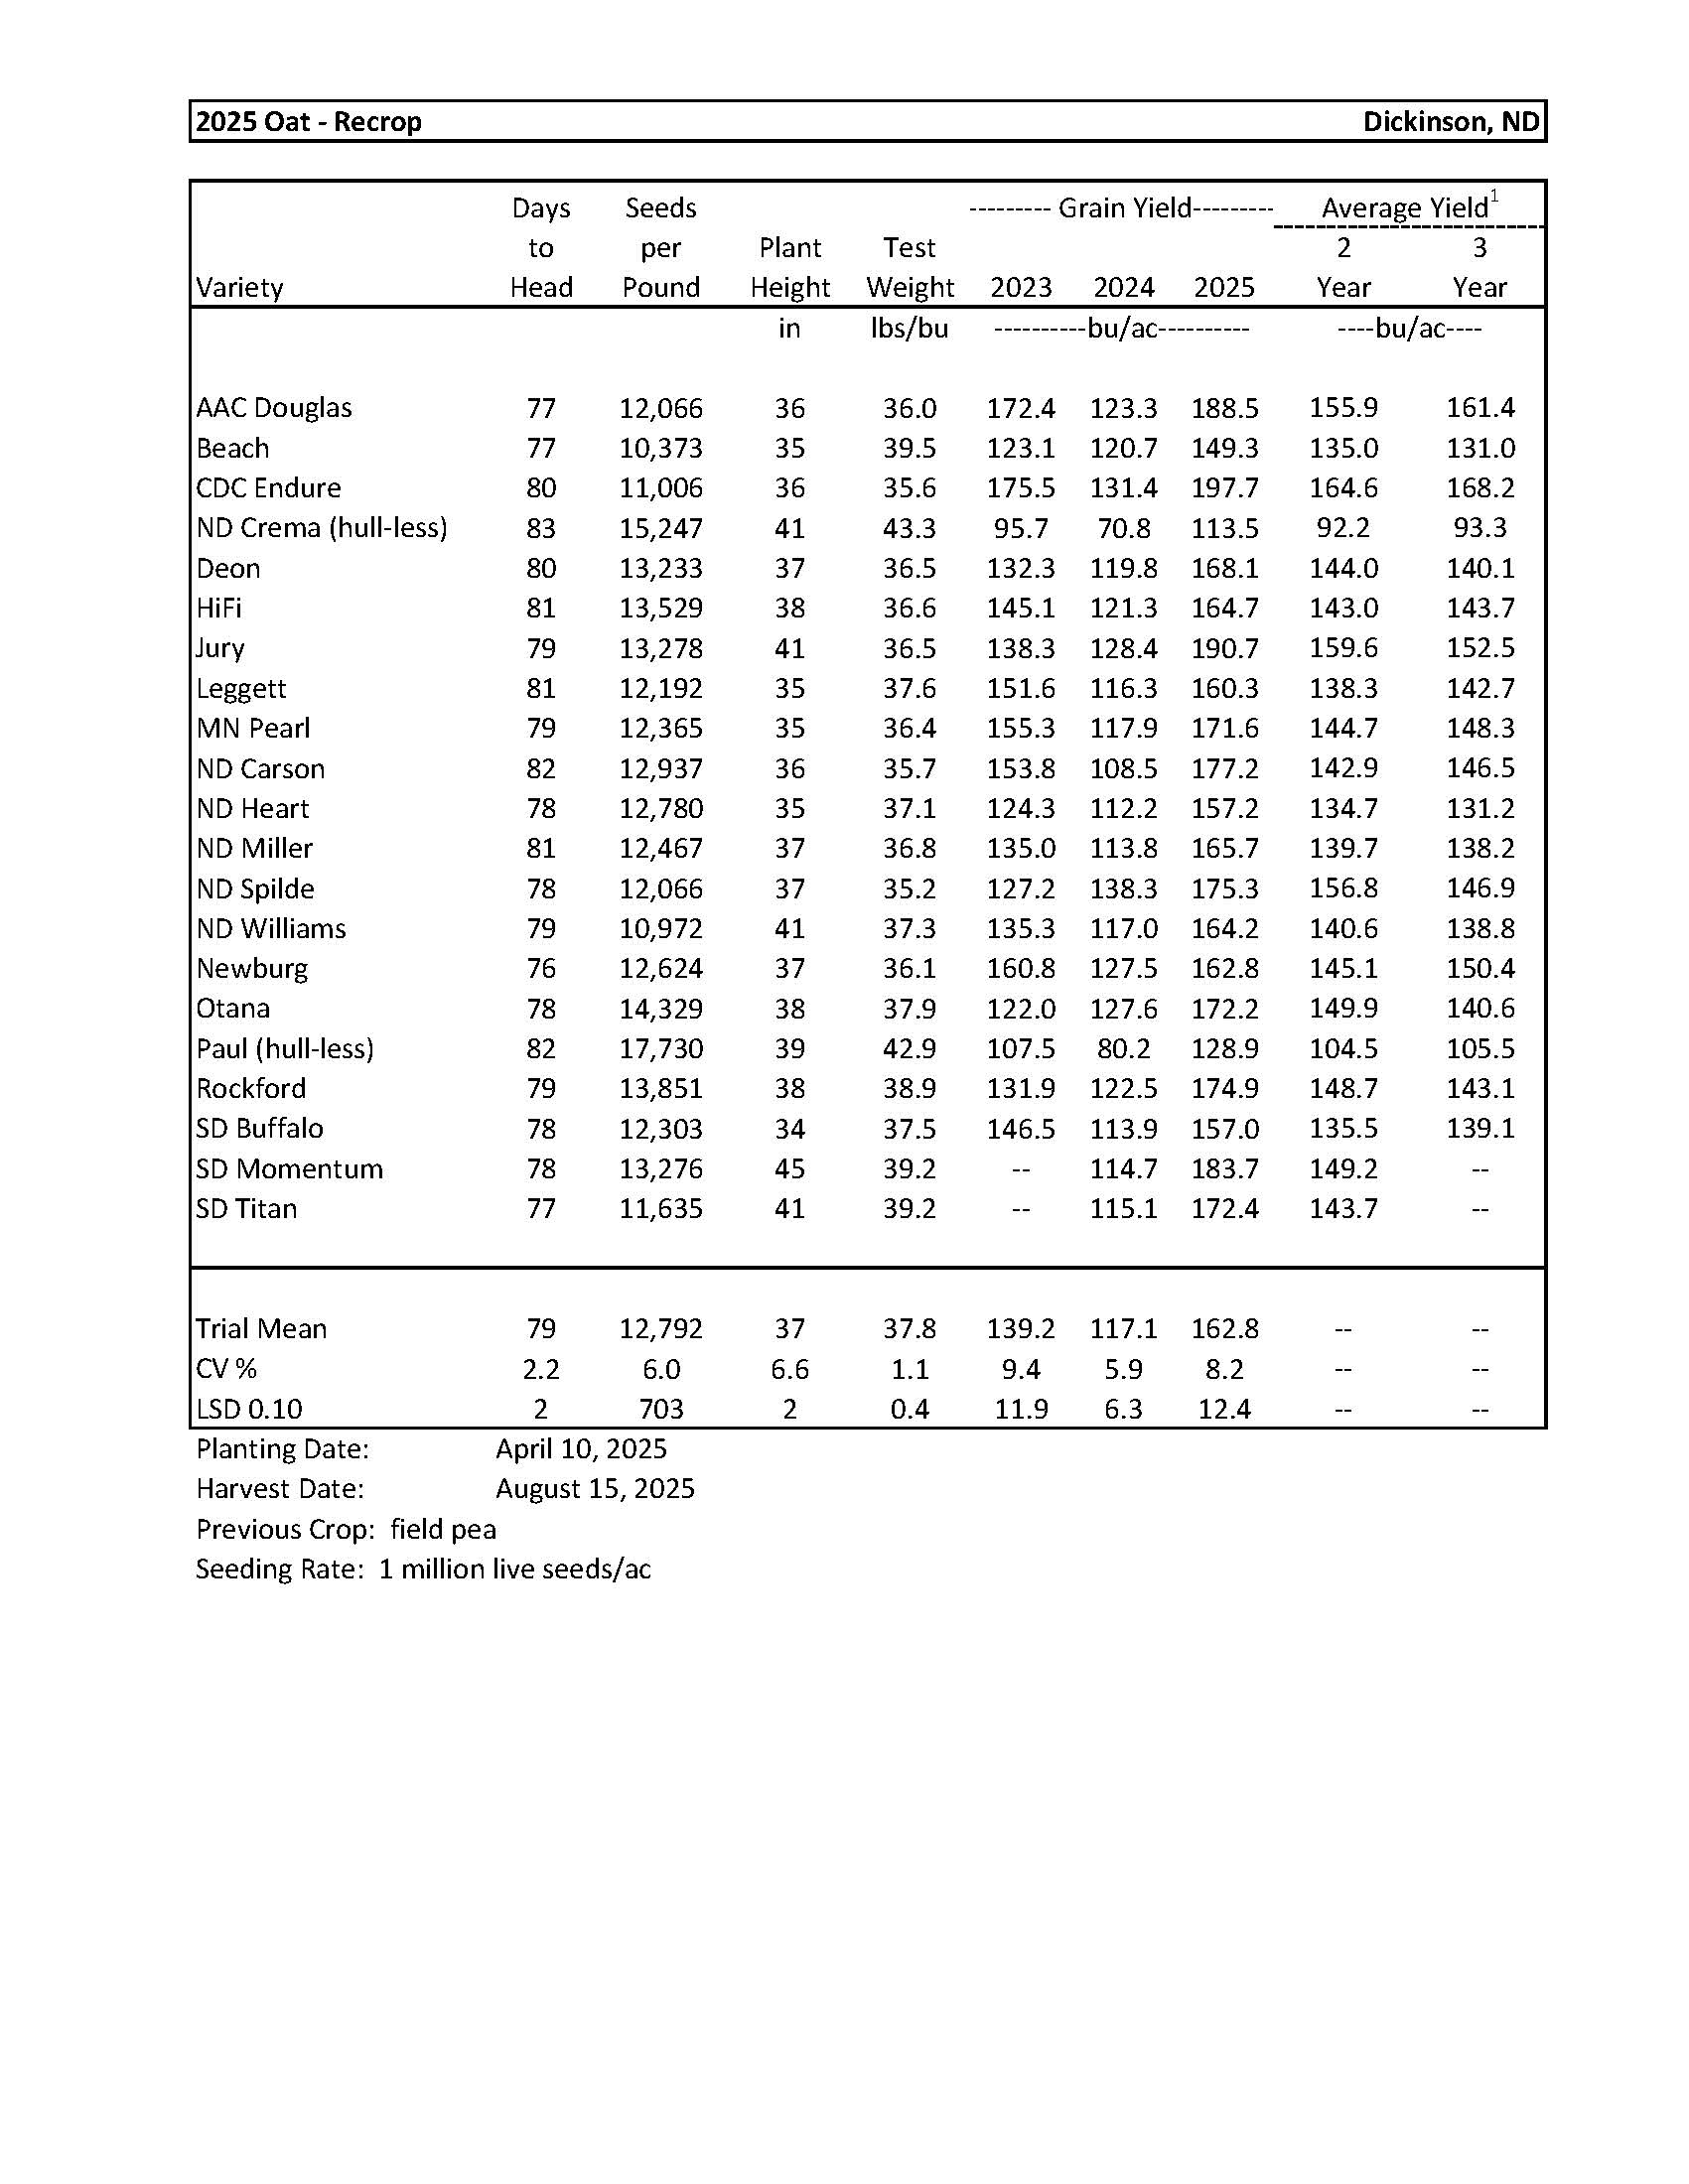
Oat...................................................................................................................................... 12
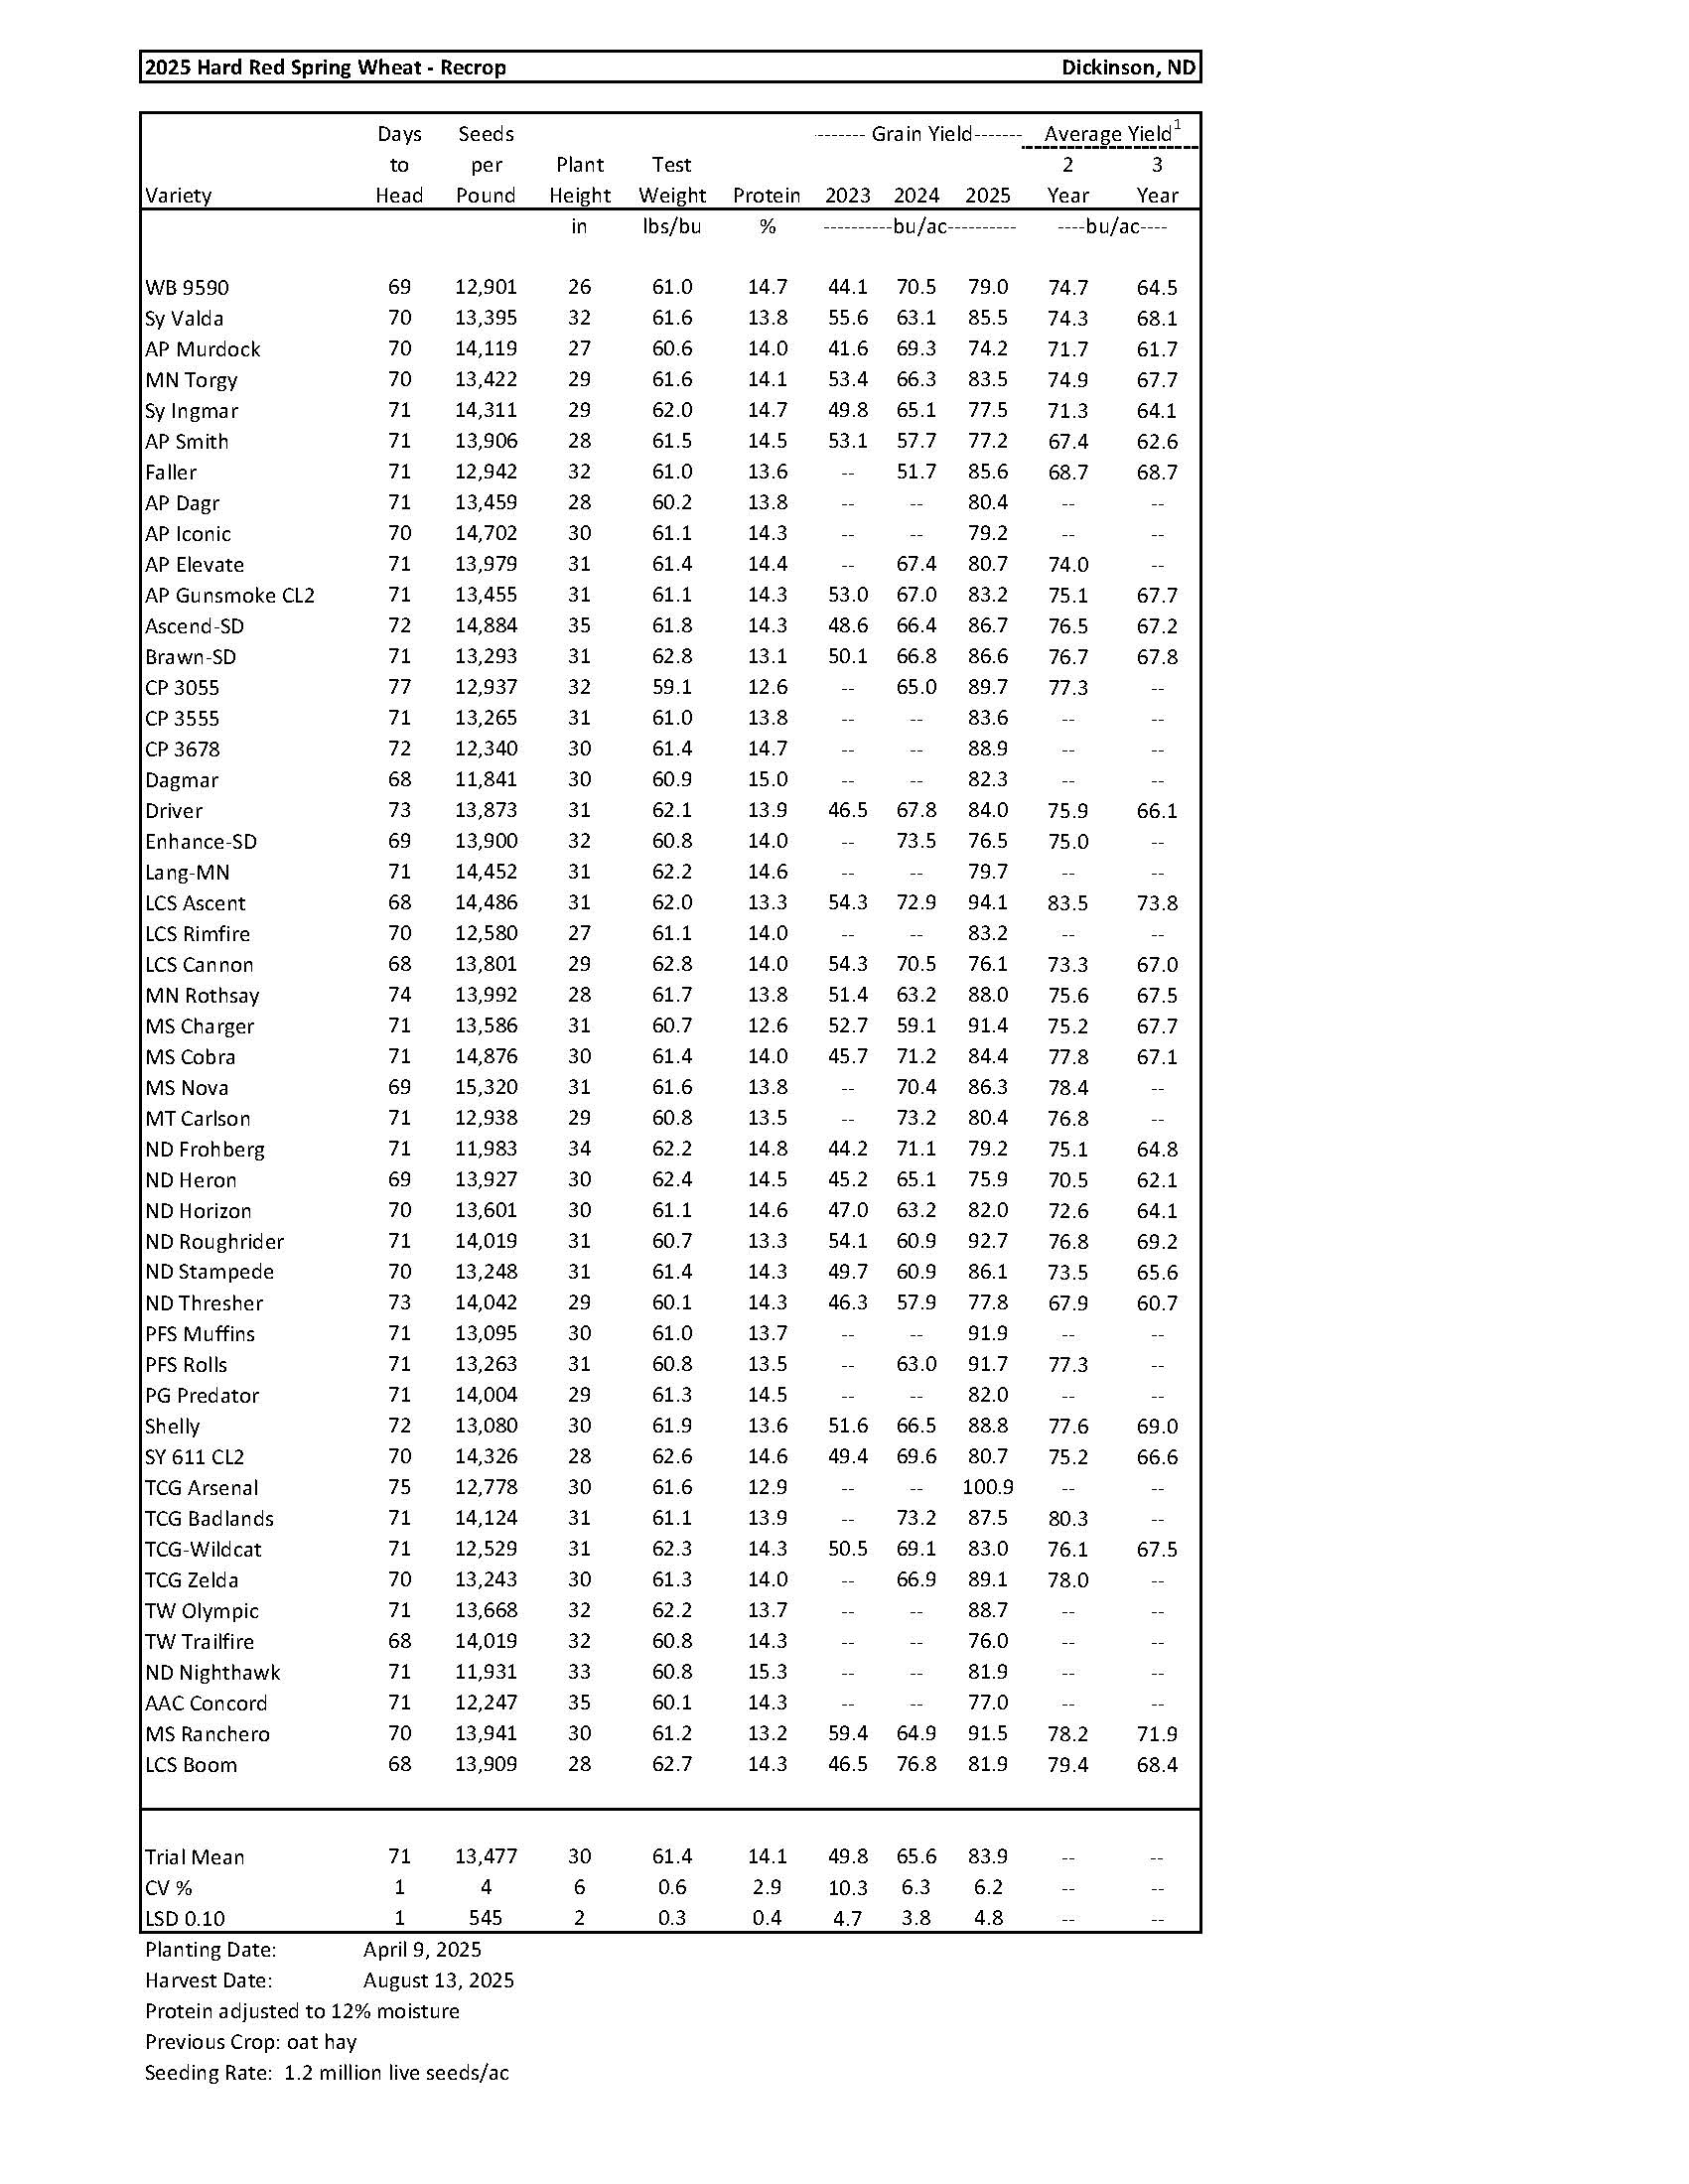
Hard Red Spring Wheat........................................................................................................ 13
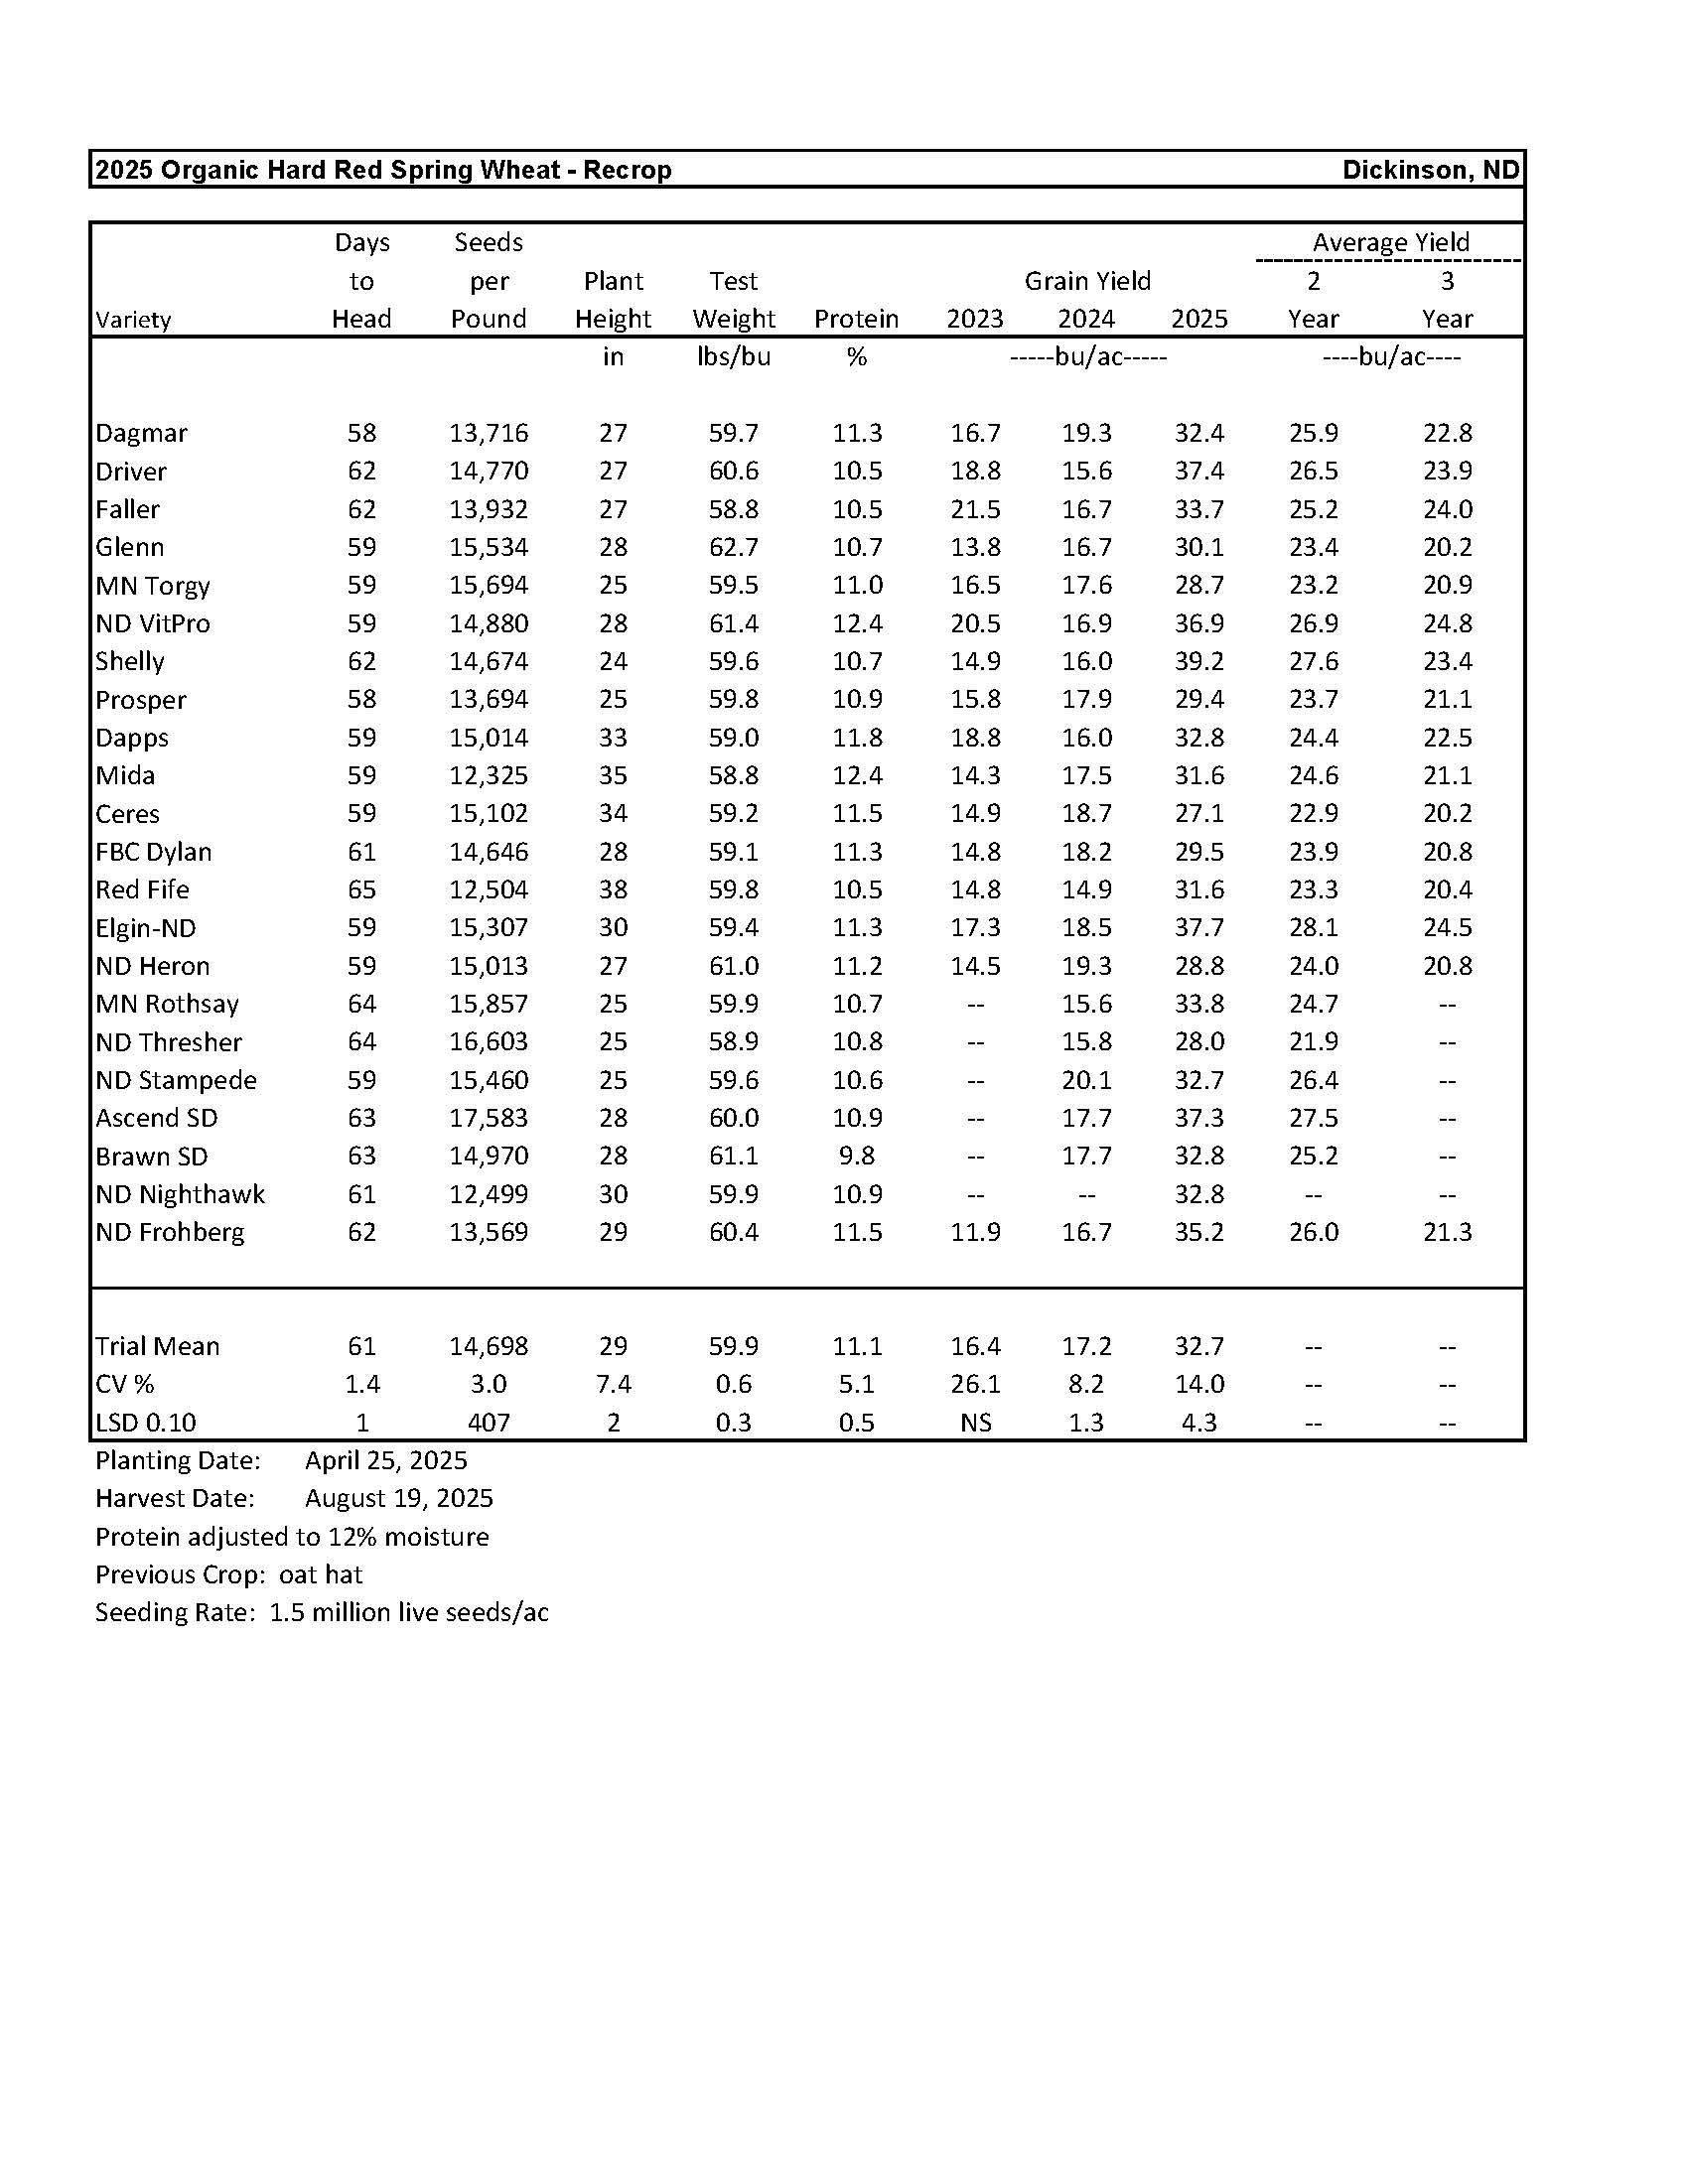
Organic Hard Red Spring Wheat........................................................................................... 14
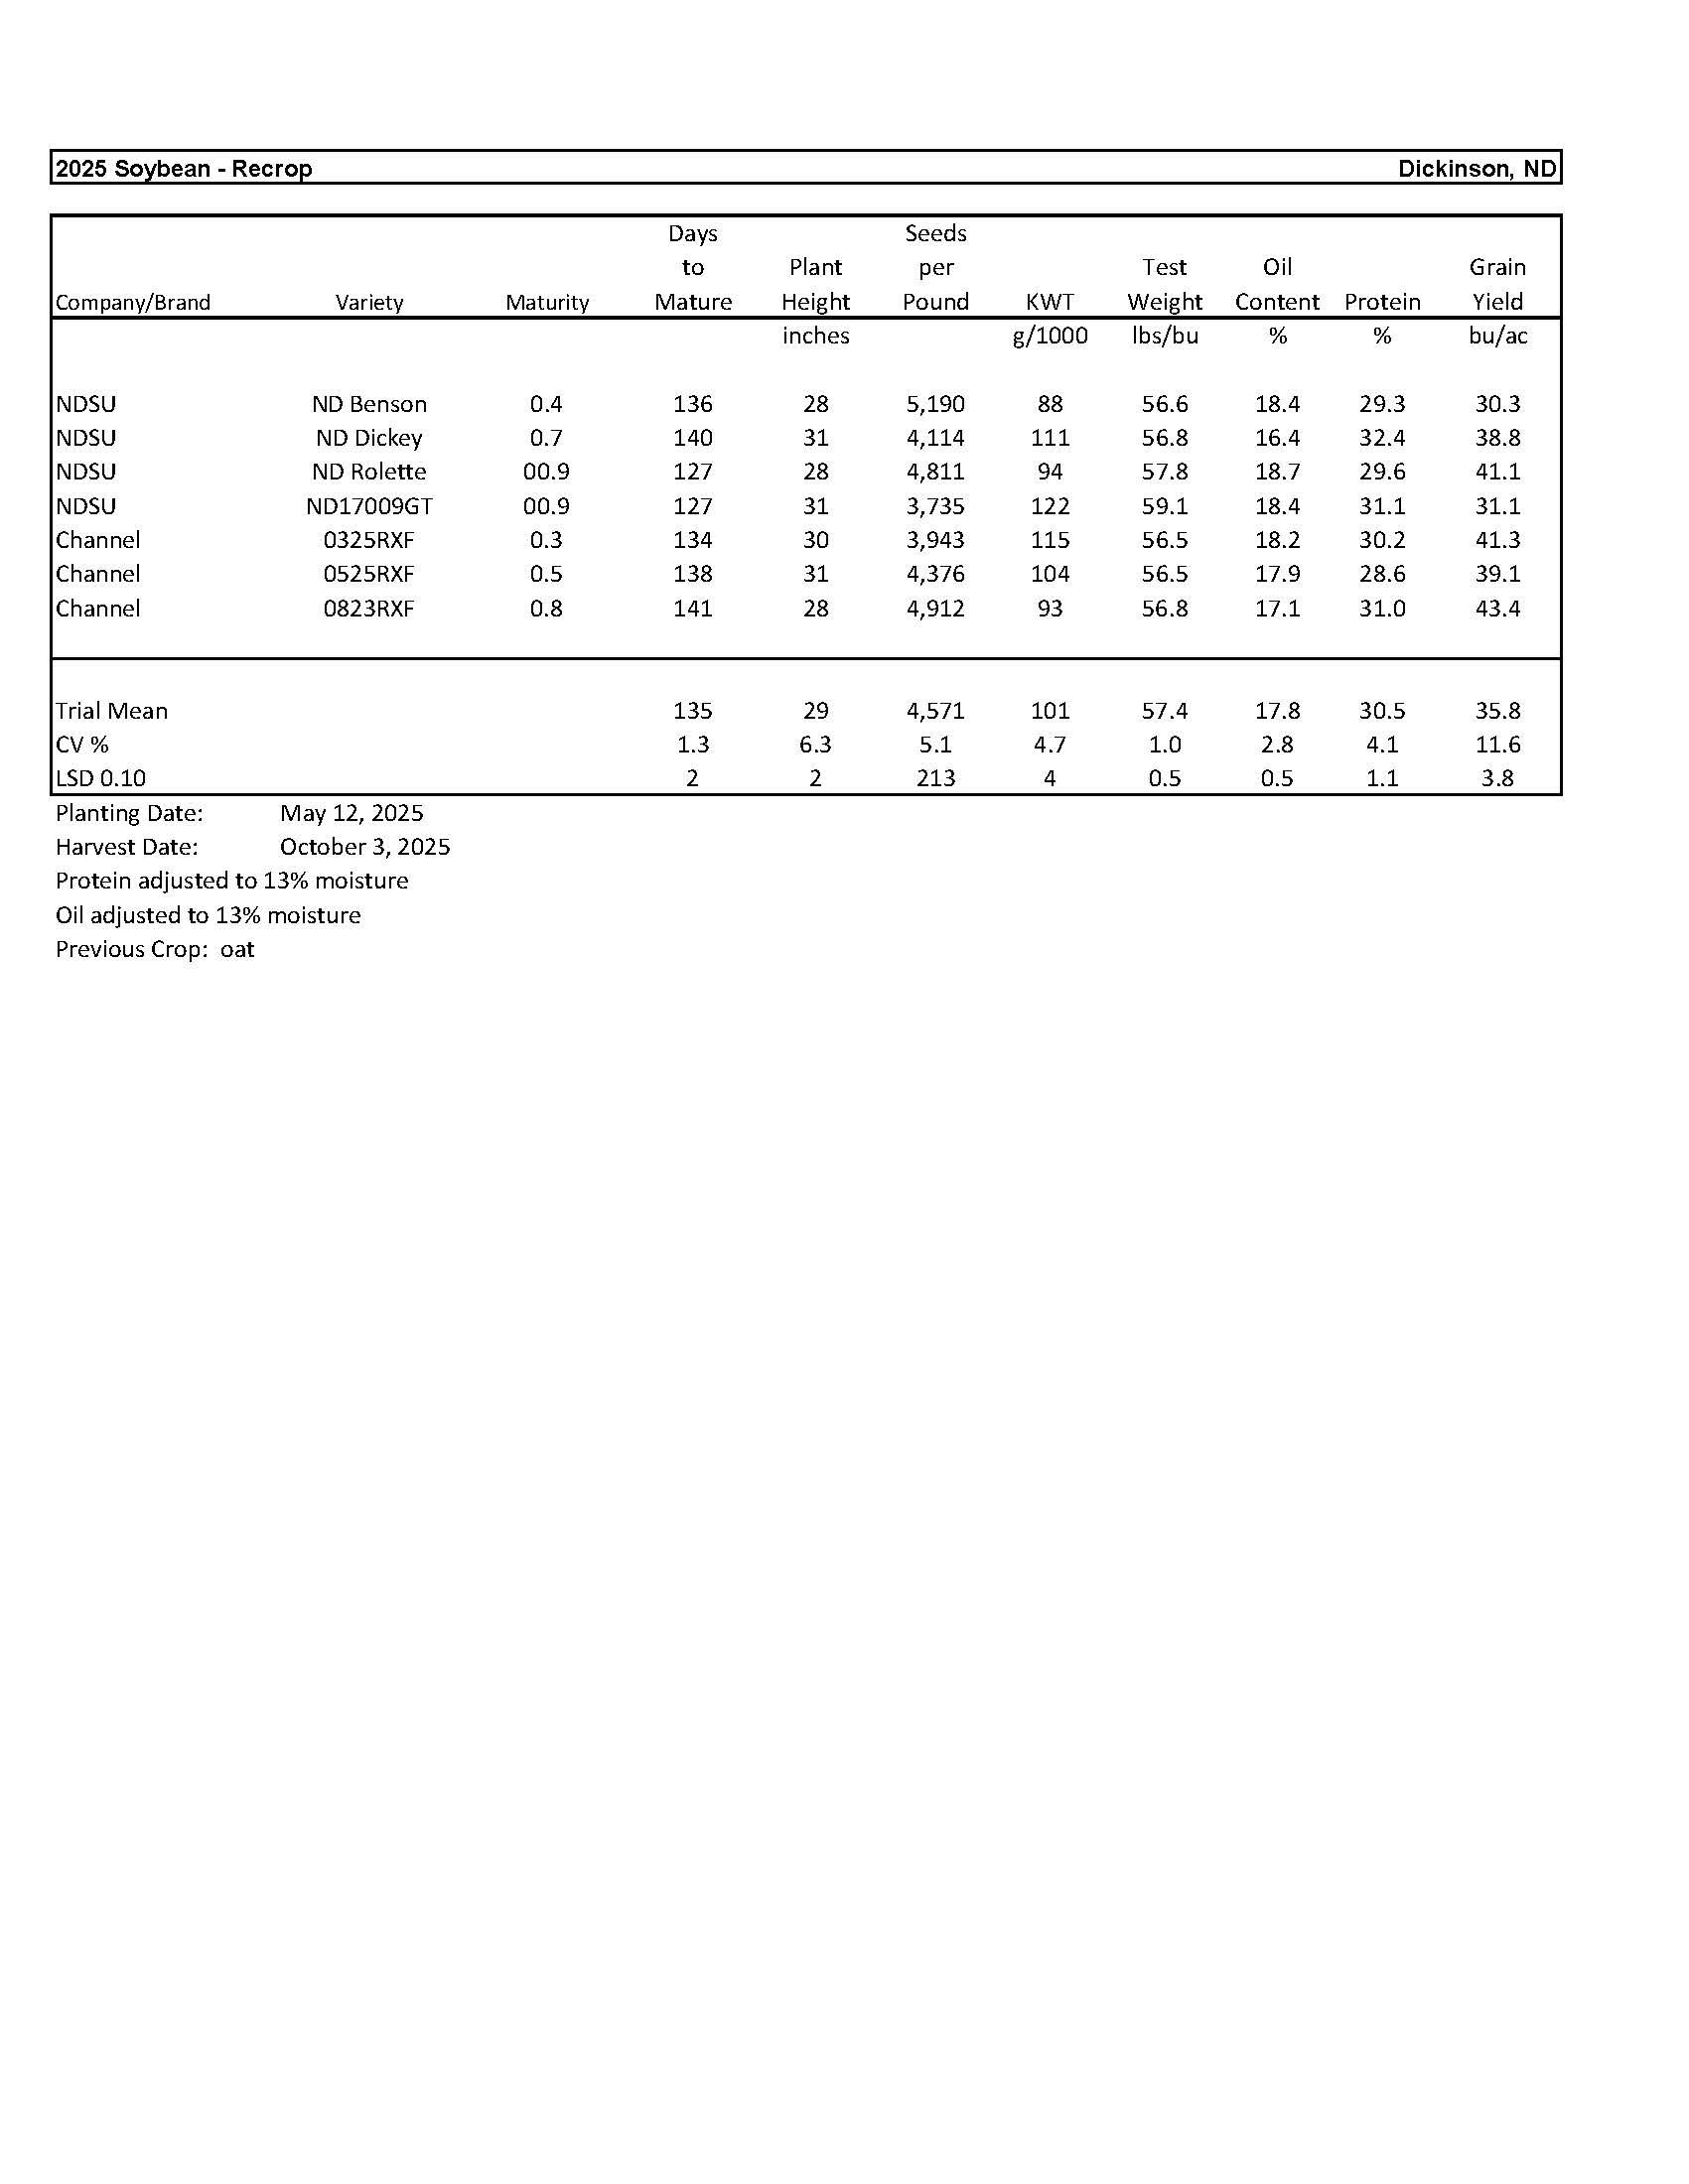
Soybean.............................................................................................................................. 15
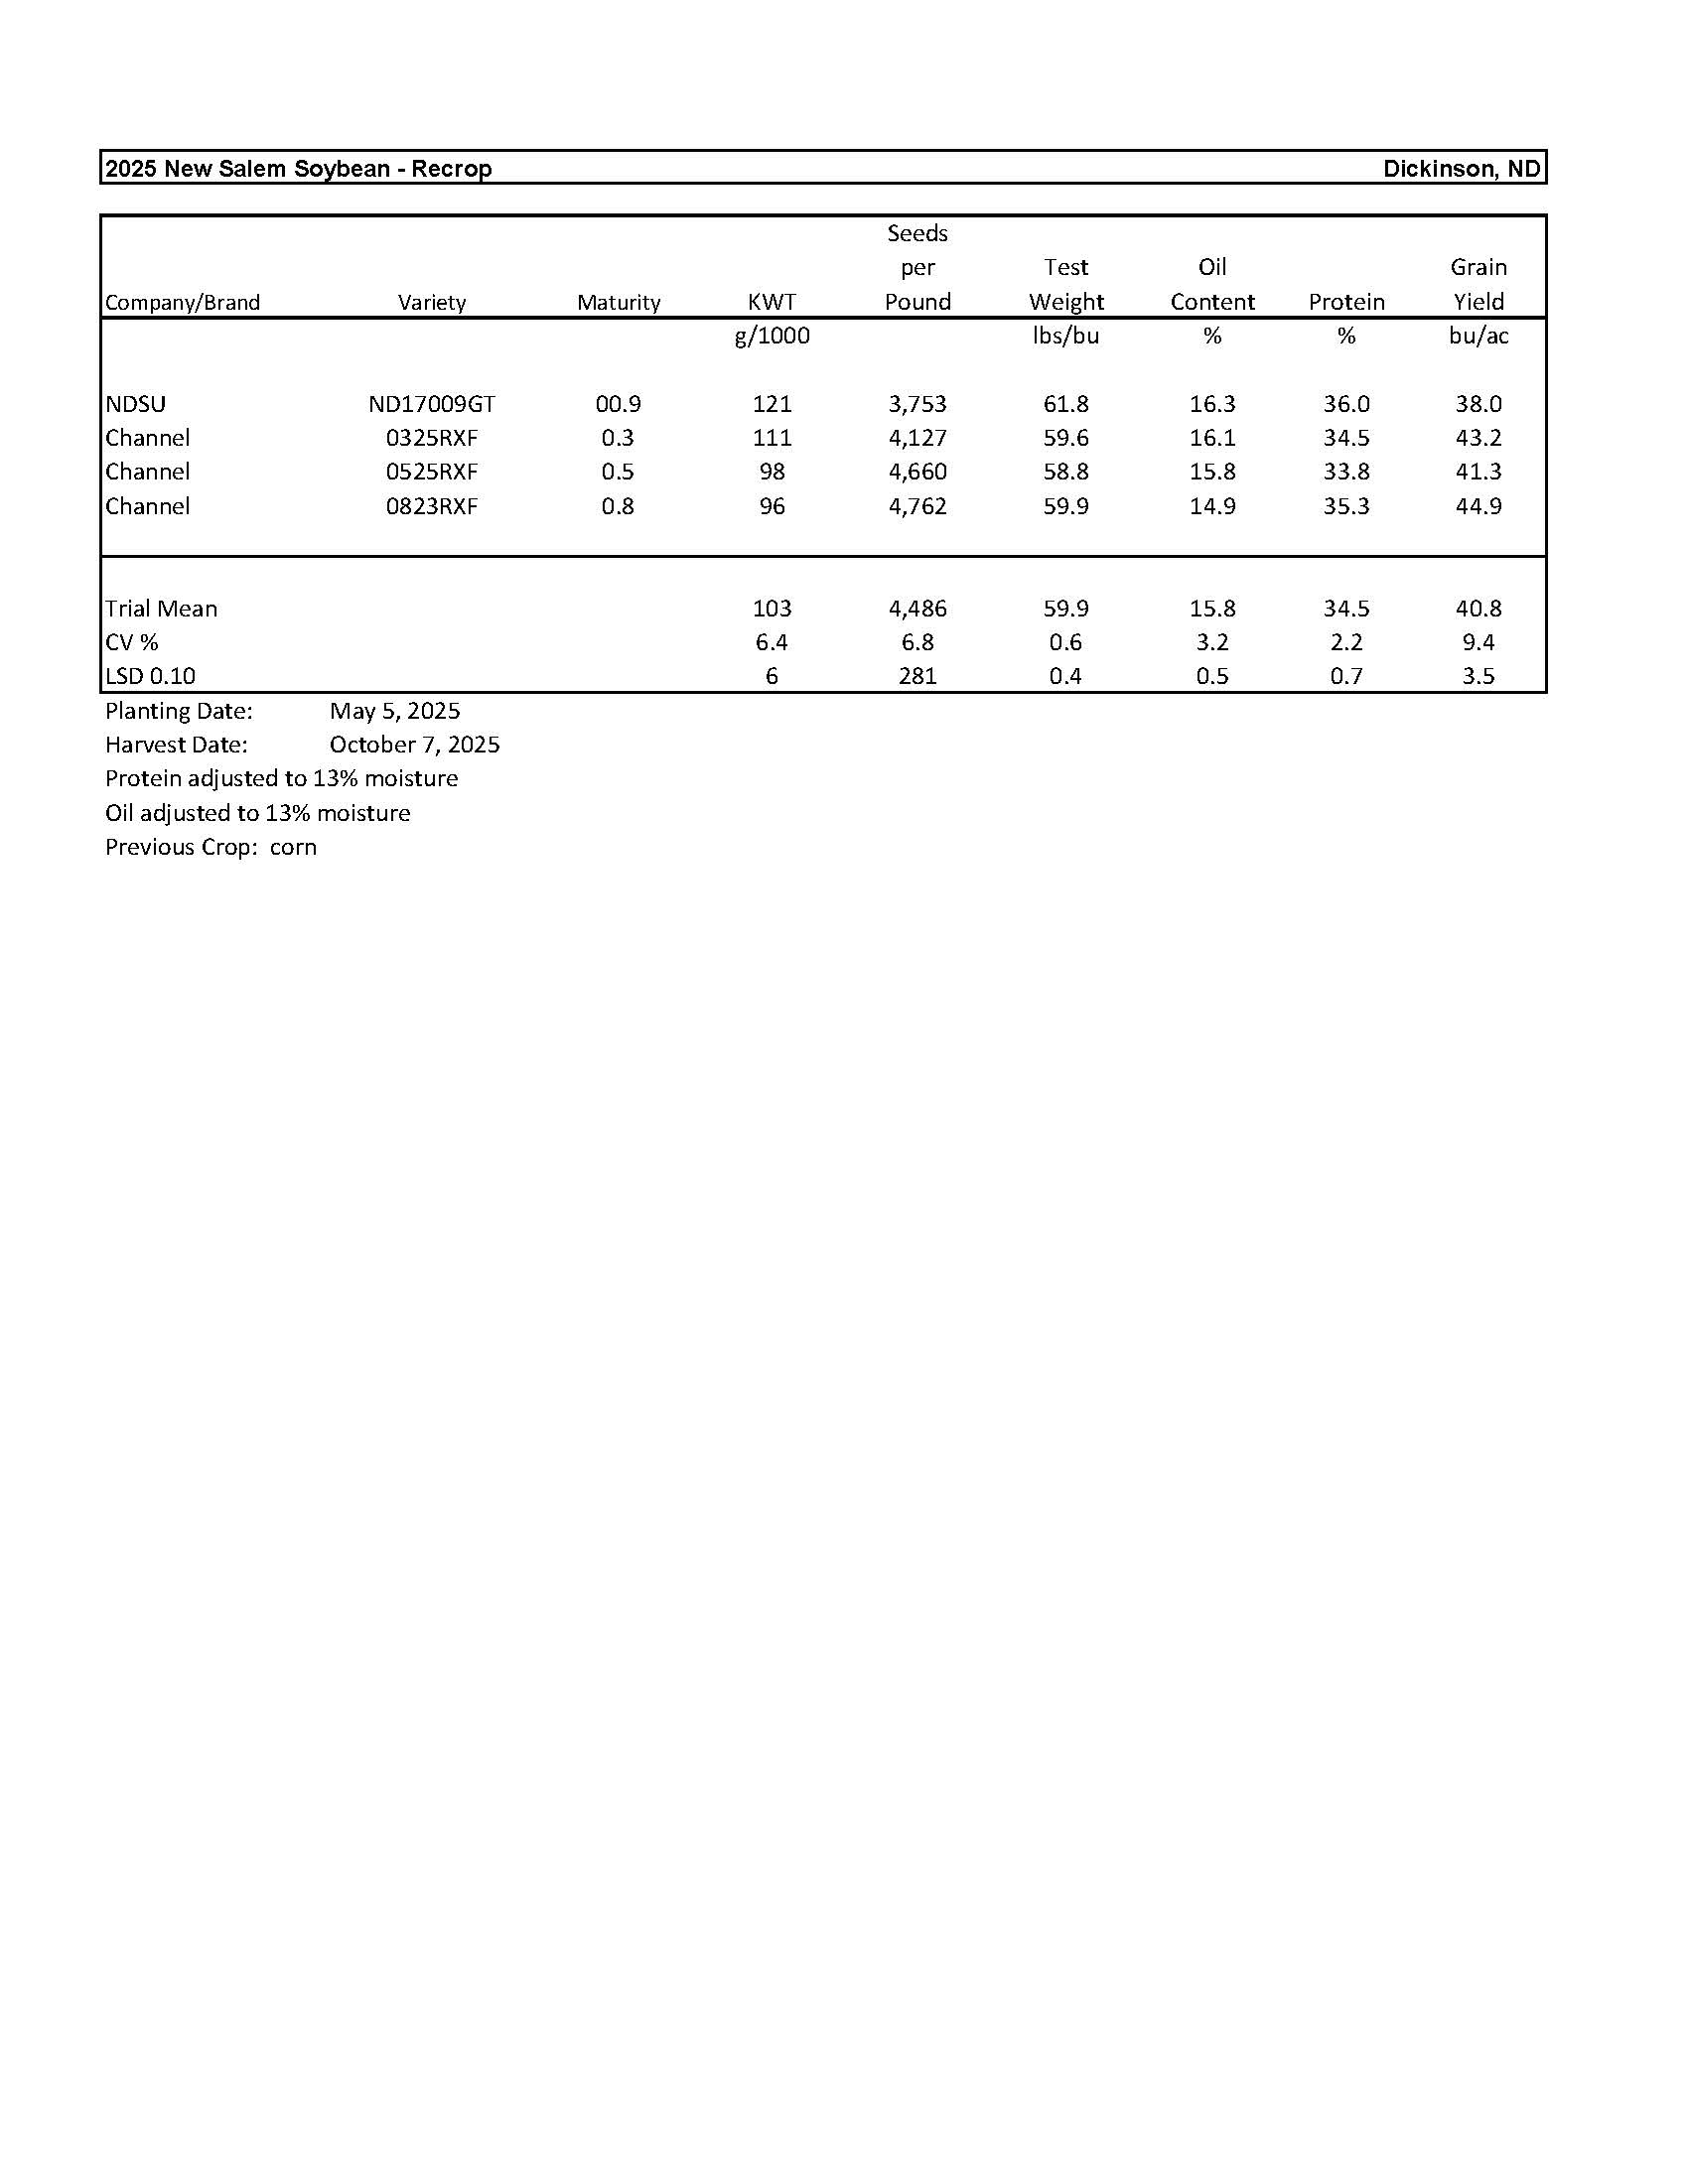
New Salem Soybean............................................................................................................. 16
Grassland Research
Restoration of Grassland Ecosystems to Full Functionality Requires Replacement
of Traditional Grazing Practices................................................................................... 17
Range Plant Growth Related to Climatic Factors of Western North Dakota, 1982-2024............ 23
Wildryes as Fall Complimentary Pastures for the Northern Plains........................................... 33
Agronomy Research
Determining Soybean Inoculation Strategies in Western North Dakota.................................... 44
Emergence and Early Growth of Hard Red Spring Wheat in Acid Soils of
Western North Dakota................................................................................................. 46
Boron Fertilization to Boost Canola Production in Western North Dakota................................ 53
Managing Soybean Inoculation in Western North Dakota Acidic Soils.................................... 58
Sulfur Fertilizer for Spring Canola Production in Western North Dakota.................................. 61
Sulfur Fertilizer for Spring Wheat Production in Western North Dakota-Year 3....................... 63
Soil Amendments and Inoculum to Improve Corn Production Under Soil Acidity and
No-Till Dryland System in Western North Dakota........................................................ 65
Lime Impacts on Spring Wheat Yield.................................................................................... 68
Sugarbeet Waste Lime Impacts on Field Pea Aphanomyces.................................................... 69
Livestock Research
Integrated Crop-Livestock System Research Publications: Past, Present, and Future................. 70
Drought Effects on Soil Microbial Activity, pH and Plant Nutrient Activity............................. 72
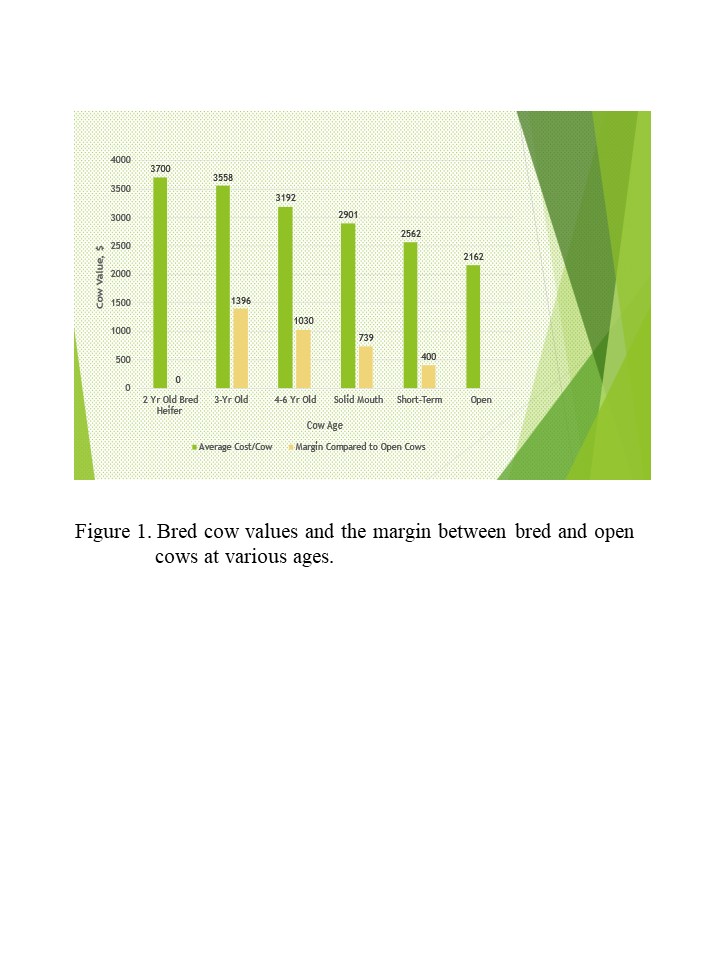
Extending the Breeding Season: Managing for Increased Profit............................................... 74
DREC Outreach
Outreach List 2025............................................................................................................... 75
Outreach Collaborators and Grants 2025................................................................................ 77
2025 Weekly Updates........................................................................................................... 78
Manning Weather Summary.................................................................................................. 80
Dickinson Weather Summary................................................................................................ 81
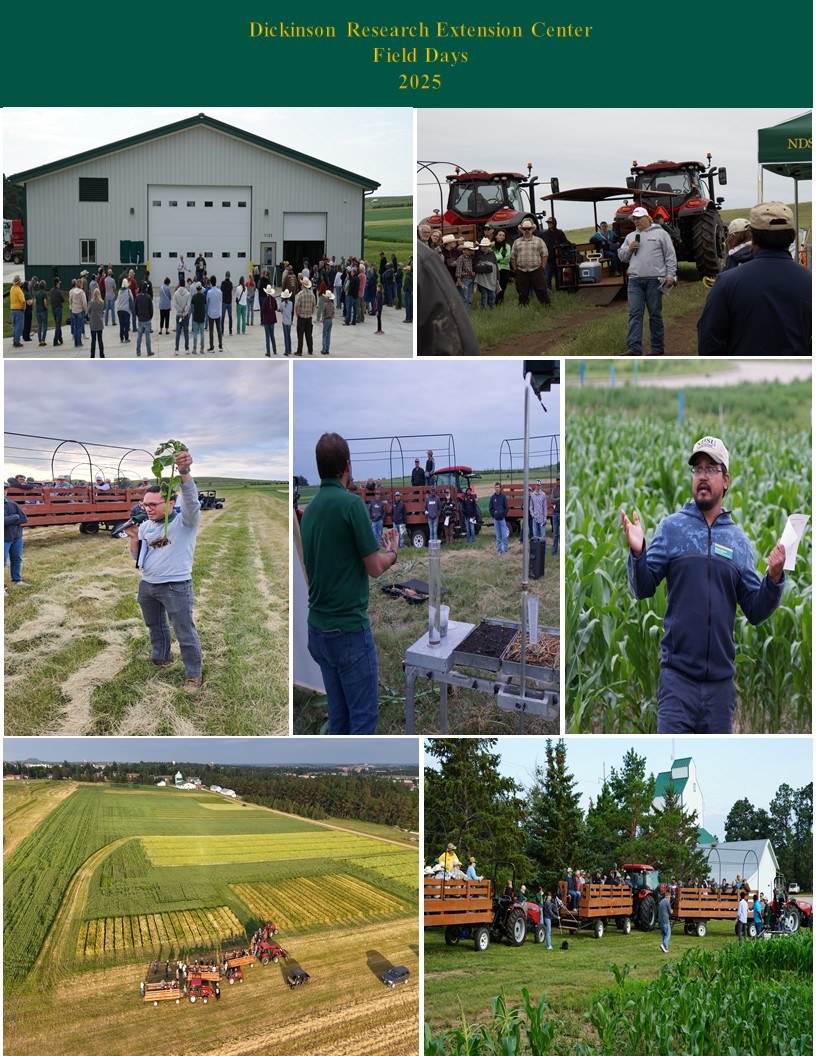
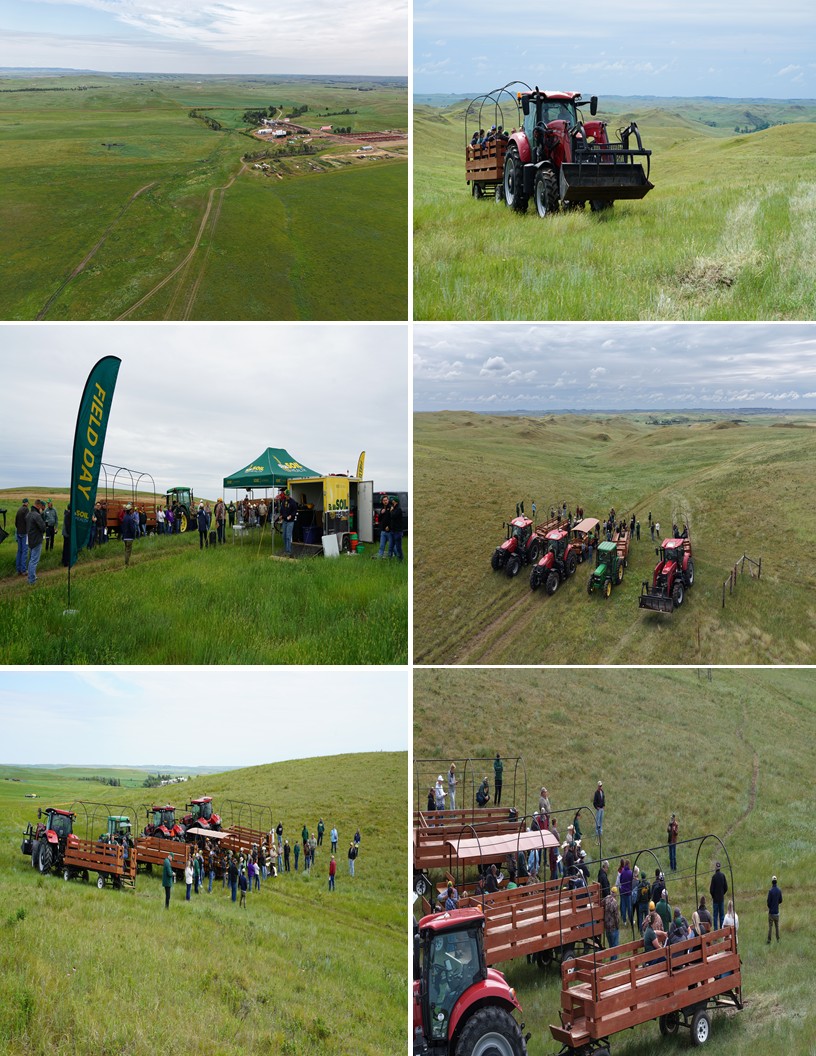
Pictures from Field Days 2025..............................................................................................82
2025 Variety Trials
Grassland Research
Range Plant Growth Related to Climatic Factors
of Western North Dakota, 1982-2024.
Llewellyn L. Manske PhD
Scientist of Rangeland Research
North Dakota State University
Dickinson Research Extension Center
Report DREC 25-1078n
Introduction
Successful long-term management of grassland ecosystems requires knowledge of the relationships of range plant growth and regional climatic factors. Range plant growth and development are regulated by climatic conditions. Length of daylight, temperature, precipitation, and water deficiency are the most important climatic factors that affect rangeland plants (Manske 2011).
Light
Light is necessary for plant growth because light is the source of energy for photosynthesis. Plant growth is affected by variations in quality, intensity, and duration of light. The quality of light (wavelength) varies from region to region, but the quality of sunlight does not vary enough in a given region to have an important differential effect on the rate of photosynthesis. However, the intensity (measurable energy) and duration (length of day) of sunlight change with the seasons and affect plant growth. Light intensity varies greatly with the season and with the time of day because of changes in the angle of incidence of the sun’s rays and the distance light travels through the atmosphere. Light intensity also varies with the amount of humidity and cloud cover because atmospheric moisture absorbs and scatters light rays.
The greatest variation in intensity of light received by range plants results from the various degrees of shading from other plants. Most range plants require full sunlight or very high levels of sunlight for best growth. Shading from other plants reduces the intensity of light that reaches the lower leaves of an individual plant. Grass leaves grown under shaded conditions become longer but narrower, thinner (Langer 1972, Weier et al. 1974), and lower in weight than leaves in sunlight (Langer 1972). Shaded leaves have a reduced rate of photosynthesis, which decreases the carbohydrate supply and causes a reduction in growth rate of leaves and roots (Langer 1972). Shading increases the rate of senescence in lower, older leaves. Accumulation of standing dead leaves ties up carbon and nitrogen. Decomposition of leaf material through microbial activity can take place only after the leaves have made contact with the soil. Standing dead material not in contact with the soil does not decompose but breaks down slowly as a result of leaching and weathering. Under ungrazed treatments the dead leaves remain standing for several years, slowing nutrient cycles, restricting nutrient supply, and reducing soil microorganism activity in the top 12 inches of soil. Standing dead leaves shade early leaf growth in spring and therefore slow the rate of growth and reduce leaf area. Long-term effects of shading, such as that occurring in ungrazed grasslands and under shrubs or leafy spurge, reduce the native grass species composition and increase composition of shade-tolerant or shade- adapted replacement species like smooth bromegrass and Kentucky bluegrass.
Day-length period (photoperiod) is one of the most dependable cues by which plants time their activities in temperate zones. Day-length period for a given date and locality remains the same from year to year. Changes in the photoperiod function as the timer or trigger that activates or stops physiological processes bringing about growth and flowering of plants and that starts the process of hardening for resistance to low temperatures in fall and winter. Sensory receptors, specially pigmented areas in the buds or leaves of a plant, detect day length and night length and can activate one or more hormone and enzyme systems that bring about physiological responses (Odum 1971, Daubenmire 1974, Barbour et al. 1987).
The phenological development of rangeland plants is triggered by changes in the length of daylight. Vegetative growth is triggered by photoperiod and temperature (Langer 1972, Dahl 1995), and reproductive initiation is triggered primarily by photoperiod (Roberts 1939, Langer 1972, Leopold and Kriedemann 1975, Dahl 1995) but can be slightly modified by temperature and precipitation (McMillan 1957, Leopold and Kriedemann 1975, Dahl and Hyder 1977, Dahl 1995). Some plants are long-day plants and others are short-day plants. Long-day plants reach the flower phenological stage after exposure to a critical photoperiod and during the period of increasing daylight between mid April and mid-June. Generally, most cool-season plants with the C3 photosynthetic pathway are long-day plants and reach flower phenophase before 21 June. Short-day plants are induced into flowering by day lengths that are shorter than a critical length and that occur during the period of decreasing day length after mid-June. Short-day plants are technically responding to the increase in the length of the night period rather than to the decrease in the day length (Weier et al. 1974, Leopold and Kriedemann 1975). Generally, most warm-season plants with the C4 photosynthetic pathway are short-day plants and reach flower phenophase after 21 June.
The annual pattern in the change in daylight duration follows the seasons and is the same every year for each region. Grassland management strategies based on phenological growth stages of the major grasses can be planned by calendar date after the relationships between phenological stage of growth of the major grasses and time of season have been determined for a region.
Temperature
Temperature is an approximate measurement of the heat energy available from solar radiation. At both low and high levels temperature limits plant growth. Most plant biological activity and growth occur within only a narrow range of temperatures, between 32o F (0o C) and 122o F (50o C) (Coyne et al. 1995). Low temperatures limit biological reactions because water becomes unavailable when it is frozen and because levels of available energy are inadequate. However, respiration and photosynthesis can continue slowly at temperatures well below 32o F if plants are “hardened”. High temperatures limit biological reactions because the complex structures of proteins are disrupted or denatured.
Periods with temperatures within the range for optimum plant growth are very limited in western North Dakota. The frost-free period is the number of days between the last day with minimum temperatures below 32o F (0o C) in the spring and the first day with minimum temperatures below 32o F (0o C) in the fall and is approximately the length of the growing season for annually seeded plants. The frost-free period for western North Dakota generally lasts for 120 to 130 days, from mid to late May to mid to late September (Ramirez 1972). Perennial grassland plants are capable of growing for periods longer than the frost-free period, but to continue active growth they require temperatures above the level that freezes water in plant tissue and soil. Many perennial plants begin active growth more than 30 days before the last frost in spring and continue growth after the first frost in fall. The growing season for perennial plants is considered to be between the first 5 consecutive days in spring and the last 5 consecutive days in fall with mean daily temperature at or above 32o F (0o C). In western North Dakota the growing season for perennial plants is considered to be generally from mid April through mid October. Low air temperature during the early and late portions of the growing season greatly limits plant growth rate. High temperatures, high evaporation rates, drying winds, and low precipitation levels after mid summer also limit plant growth.
Different plant species have different optimum temperature ranges. Cool-season plants, which are C3 photosynthetic pathway plants, have an optimum temperature range of 50o to 77o F (10o to 25o C). Warm-season plants, which are C4 photosynthetic pathway plants, have an optimum temperature range of 86o to 105o F (30o to 40o C) (Coyne et al. 1995).
Water (Precipitation)
Water, an integral part of living systems, is ecologically important because it is a major force in shaping climatic patterns and biochemically important because it is a necessary component in physiological processes (Brown 1995). Water is the principal constituent of plant cells, usually composing over 80% of the fresh weight of herbaceous plants. Water is the primary solvent in physiological processes by which gases, minerals, and other materials enter plant cells and by which these materials are translocated to various parts of the plant. Water is the substance in which processes such as photosynthesis and other biochemical reactions occur and a structural component of proteins and nucleic acids. Water is also essential for the maintenance of the rigidity of plant tissue and for cell enlargement and growth in plants (Brown 1977, Brown 1995).
Water Deficiency
Temperature and precipitation act together to affect the physiological and ecological status of range plants. The biological situation of a plant at any time is determined by the balance between rainfall and potential evapotranspiration. The higher the temperature, the greater the rate of evapotranspiration and the greater the need for rainfall to maintain homeostasis. When the amount of rainfall received is less than potential evapotranspiration demand, a water deficiency exists. Evapotranspiration demand is greater than precipitation in the mixed grass and short grass prairie regions. The tall grass prairie region has greater precipitation than evapotranspiration demand. Under water deficiency conditions, plants are unable to absorb adequate water to match the transpiration rate, and plant water stress develops. Range plants have mechanisms that help reduce the damage from water stress, but some degree of reduction in herbage production occurs.
Plant water stress limits growth. Plant water stress develops in plant tissue when the rate of water loss through transpiration exceeds the rate of water absorption by the roots. Water stress can vary in degree from a small decrease in water potential, as in midday wilting on warm, clear days, to the lethal limit of desiccation (Brown 1995).
Early stages of water stress slow shoot and leaf growth. Leaves show signs of wilting, folding, and discoloration. Tillering and new shoot development decrease. Root production may increase. Senescence of older leaves accelerates. Rates of cell wall formation, cell division, and protein synthesis decrease. As water stress increases, enzyme activity declines and the formation of necessary compounds slows or ceases. The stomata begin to close; this reaction results in decreased rates of transpiration and photosynthesis. Rates of respiration and translocation decrease substantially with increases in water stress. When water stress becomes severe, most functions nearly or completely cease and serious damage occurs. Leaf and root mortality induced by water stress progresses from the tips to the crown. The rate of leaf and root mortality increases with increasing stress. Water stress can increase to a point that is lethal, resulting in damage from which the plant cannot recover. Plant death occurs when meristems become so dehydrated that cells cannot maintain cell turgidity and biochemical activity (Brown 1995).
Study Area
The study area is the region around the Dickinson Research Extension Center (DREC) Ranch, Dunn County, western North Dakota, USA. Native vegetation in western North Dakota is the Wheatgrass-Needlegrass Type (Barker and Whitman 1988, Shiflet 1994) of the mixed grass prairie.
The climate of western North Dakota has changed several times during geologic history (Manske 1999). The most recent climate change occurred about 5,000 years ago, to conditions like those of the present, with cycles of wet and dry periods. The wet periods have been cool and humid, with greater amounts of precipitation. A brief wet period occurred around 4,500 years ago. Relatively long periods of wet conditions occurred in the periods between 2,500 and 1,800 years ago and between 1,000 and 700 years ago. Recent short wet periods occurred in the years from 1905 to 1916, 1939 to 1947, and 1962 to 1978. The dry periods have been warmer, with reduced precipitation and recurrent summer droughts. A widespread, long drought period occurred between the years 1270 and 1299, an extremely severe drought occurred from 1863 through 1875, and other more recent drought periods occurred from 1895 to 1902, 1933 to 1938, and 1987 to 1992. The current climatic pattern in western North Dakota is cyclical between wet and dry periods and has existed for the past 5,000 years (Bluemle 1977, Bluemle 1991, Manske 1994a).
Procedures
Daylight duration data for the Dickinson location of latitude 46o48' N, longitude 102 o 48' W, were tabulated from daily sunrise and sunset time tables compiled by the National Weather Service, Bismarck, North Dakota.
Temperature and precipitation data were taken from historical climatological data collected at the Dickinson Research Extension Center Ranch, latitude 47o 14' N, longitude 102o 50' W, Dunn County, near Manning, North Dakota, 1982-2024.
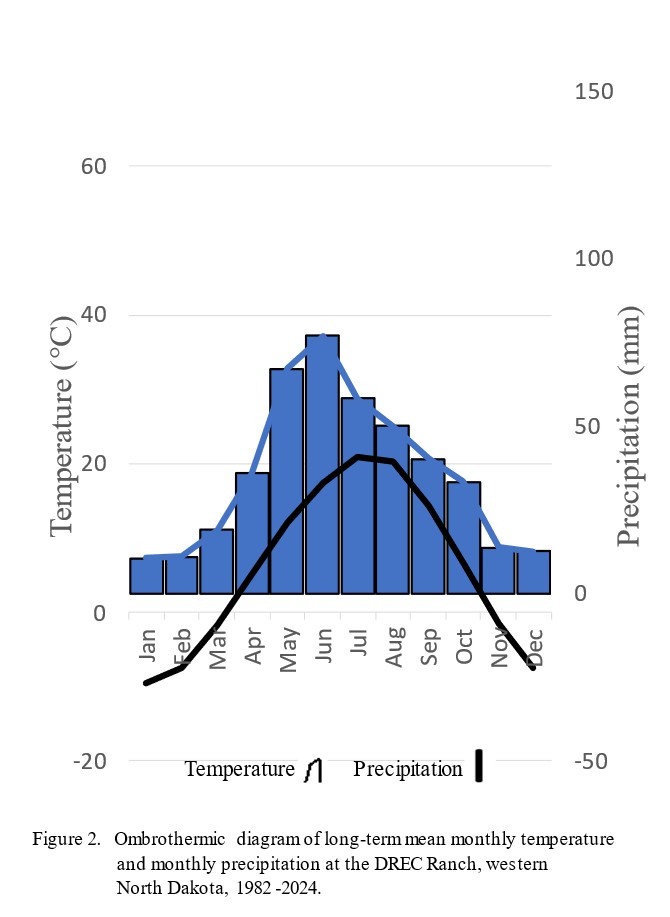
A technique reported by Emberger et al. (1963) was used to develop water deficiency months data from historical temperature and precipitation data. The water deficiency months data were used to identify months with conditions unfavorable for plant growth. This method plots mean monthly temperature (o C) and monthly precipitation (mm) on the same axis, with the scale of the precipitation data at twice that of the temperature data. The temperature and precipitation data are plotted against an axis of time. The resulting ombrothermic diagram shows general monthly trends and identifies months with conditions unfavorable for plant growth. Water deficiency conditions exist during months when the precipitation data bar drops below the temperature data curve and plants are under water stress. Plants are under temperature stress when the temperature curve drops below the freezing mark (0o C).
Results and Discussion
Light
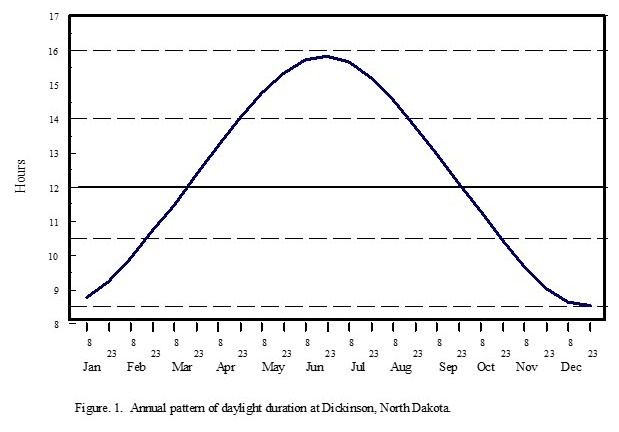
The tilt of the earth’s axis in conjunction with the earth’s annual revolution around the sun produces the seasons and changes the length of daylight in temperate zones. Dickinson (figure 1) has nearly uniform day and night lengths (12 hours) during only a few days, near the vernal and autumnal equinoxes, 20 March and 22 September, respectively, when the sun’s apparent path crosses the equator as the sun travels north or south, respectively. The shortest day length (8 hours, 23 minutes) occurs at winter solstice, 21 December, when the sun’s apparent path is farthest south of the equator. The longest day length (15 hours, 52 minutes) occurs at summer solstice, 21 June, when the sun’s apparent path is farthest north of the equator. The length of daylight during the growing season (mid April to mid October) oscillates from about 13 hours in mid April, increasing to nearly 16 hours in mid June, then decreasing to around 11 hours in mid October (figure 1).
Temperature
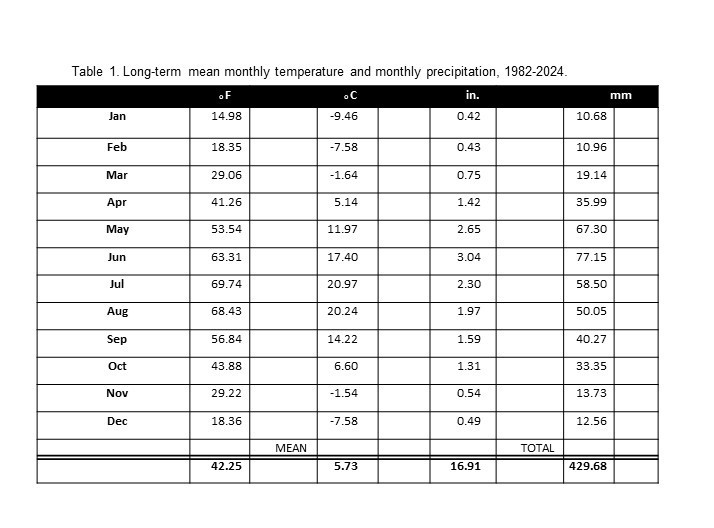
The DREC Ranch in western North Dakota experiences severe, windy, dry winters with little snow accumulation. The springs are relatively moist in most years, and the summers are often droughty but are interrupted periodically by thunderstorms. The long-term (43-year) mean annual temperature is 42.3o F (5.7o C) (table 1). January is the coldest month, with a mean temperature of 15.0o F (-9.5o C). July and August are the warmest months, with mean temperatures of 69.7o F (21.0o C) and 68.4o F (20.2o C), respectively. Months with mean monthly temperatures below 32.0o F (0.0o C) are too cold for active plant growth. Low temperatures define the growing season for perennial plants, which is generally from mid April to mid October (6.0 months, 183 days). During the other 6 months each year, plants in western North Dakota cannot conduct active plant growth. Soils are frozen to a depth of 3 to 5 feet for a period of 4 months (121 days) (Larson et al. 1968). The early and late portions of the 6- month growing season have very limited plant activity and growth. The period of active plant growth is generally 5.5 months (168 days).
Western North Dakota has large annual and diurnal changes in monthly and daily air temperatures. The range of seasonal variation of average monthly temperatures between the coldest and warmest months is 55.0o F (30.5o C), and temperature extremes in western North Dakota have a range of 161.0o F (89.4o C), from the highest recorded summer temperature of 114.0o F (45.6o C) to the lowest recorded winter temperature of -47.0o F (-43.9o C). The diurnal temperature change is the difference between the minimum and maximum temperatures observed over a 24-hour period. The average diurnal temperature change during winter is 22.0o F (12.2o C), and the change during summer is 30.0o F (16.7o C). The average annual diurnal change in temperature is 26.0o F (14.4o C) (Jensen 1972). The large diurnal change in temperature during the growing season, which has warm days and cool nights, is beneficial for plant growth because of the effect on the photosynthetic process and respiration rates (Leopold and Kriedemann 1975).
Precipitation
The long-term (43-year) annual precipitation for the Dickinson Research Extension Center Ranch in western North Dakota is 16.91 inches (429.68 mm). The long-term mean monthly precipitation is shown in table 1. The growing-season precipitation (April to October) is 14.28 inches (362.61 mm) and is 85.22% of annual precipitation. June has the greatest monthly precipitation, at 3.04 inches (77.15 mm).
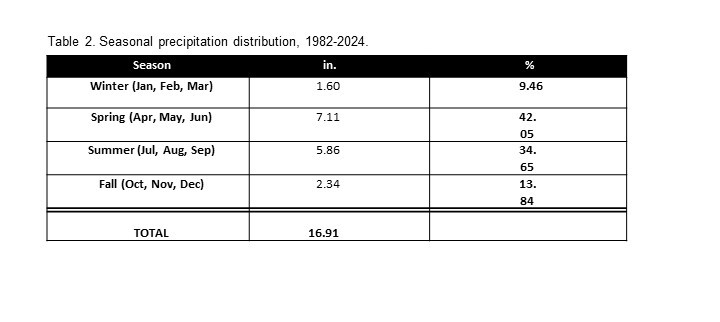
The seasonal distribution of precipitation (table 2) shows the greatest amount of precipitation occurring in the spring (7.11 inches, 42.05%) and the least amount occurring in winter (1.60 inches, 9.46%). Total precipitation received for the 5-month period of November through March averages less than 2.63 inches (15.55%). The precipitation received in the 3-month period of May, June, and July accounts for 47.25% of the annual precipitation (7.99 inches).
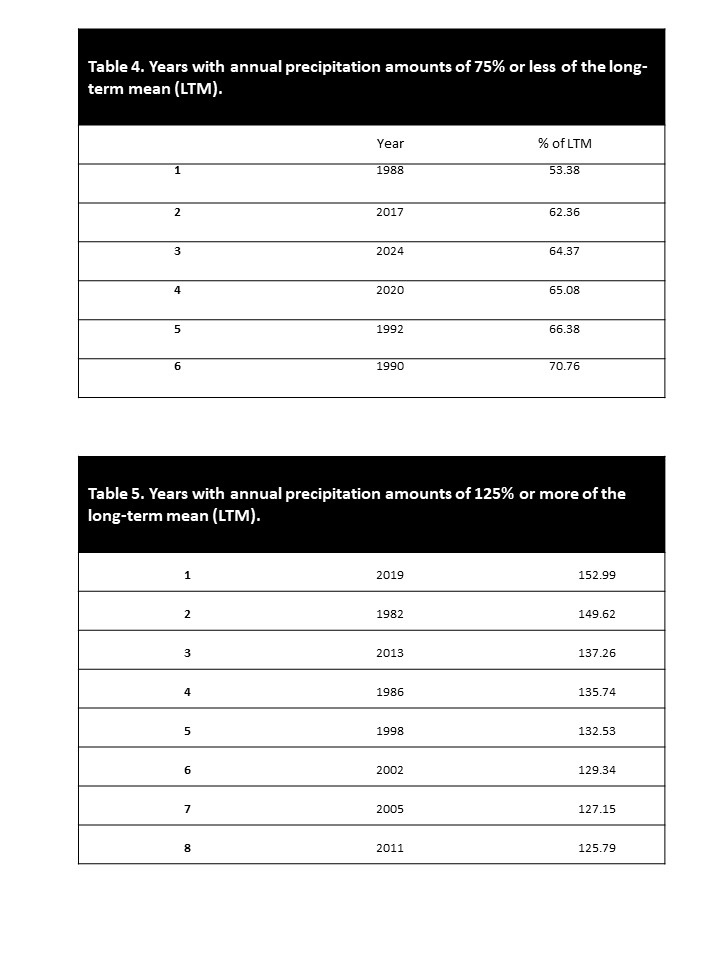
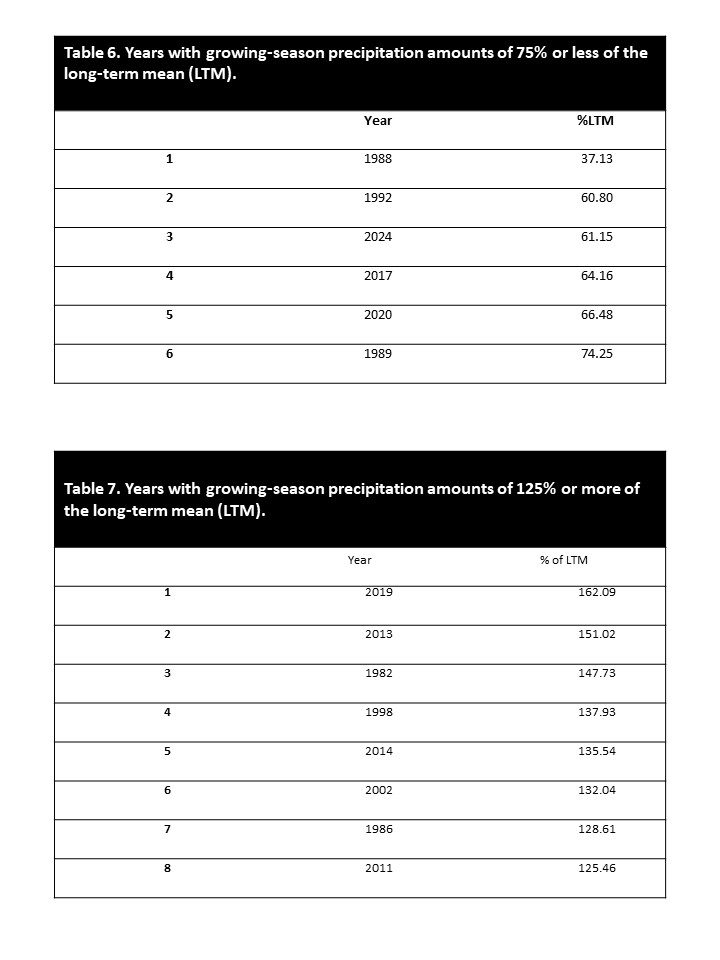
The annual and growing-season precipitation levels and percent of the long-term mean for 43 years (1982 to 2024) are shown in table 3. Drought conditions exist when precipitation amounts for a month, growing season, or annual period are 75% or less of the long-term mean. Wet conditions exist when precipitation amounts for a month, growing season, or annual period are 125% or greater of the long-term mean. Normal conditions exist when precipitation amounts for a month, growing season, or annual period are greater than 75% and less than 125% of the long-term mean. Between 1982-2024, 6 drought years (13.95%) (table 4) and 8 wet years (18.60%) (table 5) occurred. Annual precipitation amounts at normal levels, occurred during 29 years (67.44%) (table 3). The area experienced 6 drought growing seasons (13.95%) (table 6) and 8 wet growing seasons (18.60%) (table 7). Growing- season precipitation amounts at normal levels occurred during 29 years (67.44%) (table 3). The 6-year period (1987-1992) was a long period with near-drought conditions. The average annual precipitation for these 6 years was 12.12 inches (307.89 mm), only 71.67% of the long-term mean. The average growing-season precipitation for the 6- year period was 9.97 inches (253.11 mm), only 69.82% of the long-term mean (table 3).
Water Deficiency
Monthly periods with water deficiency conditions are identified on the annual ombrothermic graphs when the precipitation data bar drops below the temperature data curve. On the ombrothermic graphs, periods during which plants are under low-temperature stress are indicated when the temperature curve drops below the freezing mark of 0.0o C (32.0o F). The long-term ombrothermic graph for the DREC Ranch (figure 2) shows that near water deficiency conditions exist for August, September, and October. This finding indicates that range plants generally may have a difficult time growing and accumulating herbage biomass during these 3 months. Favorable water relations occur during May, June, and July, a condition indicating that range plants should be able to grow and accumulate herbage biomass during these 3 months.
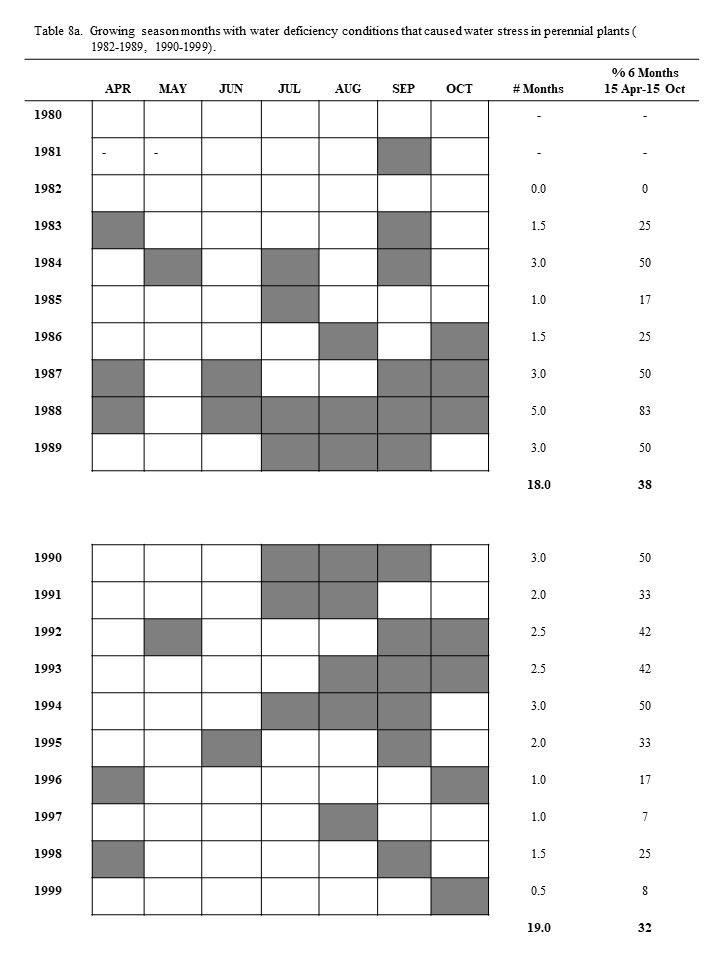
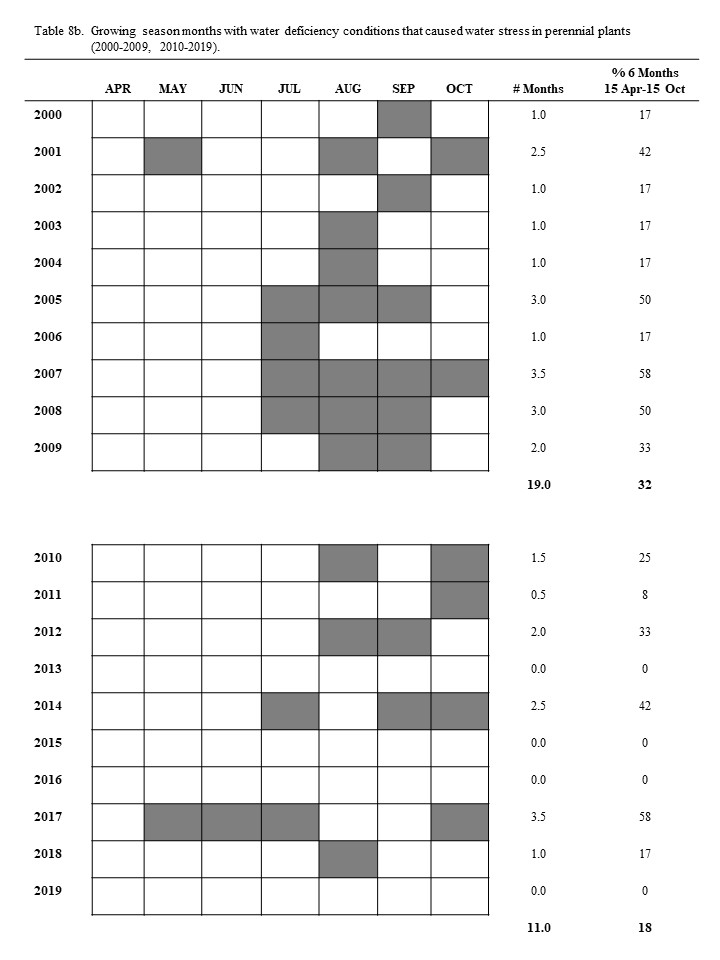
The ombrothermic relationships for the Dickinson Research Extension Center Ranch in western North Dakota are shown for each month in table 8. The 43-year period (1982 to 2024) had a total of 258 months during the growing season. Of these growing-season months, 78.5 months had water deficiency conditions, which indicates that range plants were under water stress during 30.4% of the growing-season months (tables 8 and 9): this amounts to an average of 2.0 months during every 6.0-month growing season range plants have been limited in growth and herbage biomass accumulation because of water stress. The converse indicates that only 4.0 months of an average year have conditions in which plants can grow without water stress.
Most growing seasons have months with water deficiency conditions. In only 6 of the 43 years (table 8) did water deficiency conditions not occur in any of the six growing-season months. In each growing-season month of 1982, 2013, 2015, 2016, 2019, and 2023, the amounts and distribution of the precipitation were adequate to prevent water stress in plants. Twenty years (47.51%) had water deficiency for 0.5 to 2.0 months during the growing season. Sixteen years (37.21%) had water deficiency conditions for 2.5 to 4.0 months during the growing season. One year (2.33%), 1988, had water deficiency conditions for 5.0 months during the growing season. None of the 43 years had water deficiency conditions for all 6.0 months of the growing season (table 8). The 6-year period (1987-1992) was a long period with low precipitation; during this period, water deficiency conditions existed for an average of 3.1 months during each growing season, which amounts to 51.33% of this period’s growing-season months (table 8).
May, June, and July are the 3 most important precipitation months and therefore constitute the primary period of production for range plant communities. May and June are the 2 most important months for dependable precipitation. Only 4 (9.30%) of the 43 years had water deficiency conditions during May, and 6 years (13.95%) had water deficiency conditions during June. One year (2017) had water deficiency conditions in both May and June. Fifteen (34.88%) of the 43 years had water deficiency conditions in July (table 9). Only one year (2017) has had water deficiency conditions during May, June, and July (table 8b).
Most of the growth in range plants occurs in May, June, and July (Goetz 1963, Manske 1994b). Peak aboveground herbage biomass production usually occurs during the last 10 days of July, a period that coincides with the time when plants have attained 100% of their growth in height (Manske 1994b). Range grass growth coincides with the 3- month period of May, June, and July, when 47.25% of the annual precipitation occurs.
August, September, and October are not dependable for positive water relations. August and September had water deficiency conditions in 46.51% and 53.49% of the years, respectively, and October had water deficiency conditions in 34.88% of the years (table 9). Visual observations of range grasses with wilted, senescent leaves in August indicate that most plants experience some level of water stress when conditions approach those of water deficiency. August, September, and/or October had water deficiency conditions during 81.40% of the growing seasons in the previous 43 years (table 8). These 3 months make up 42% of the growing season, and they had water deficiency conditions on the average of 45% of the time (table 9). The water relations in August, September, and October limit range plant growth and herbage biomass accumulation.
Over the last 43 years, drought years occurred 14.0% of the time. Drought growing seasons occurred 14.0% of the time. Water deficiency months occurred 30.4% of the time. Water deficiency occurred in May and June 9.3% and 14.0% of the time, respectively. July had water deficiency conditions 34.9% of the time. August, September, and October had water deficiency conditions 46.5%, 53.5%, and 34.9%. Water deficiency periods lasting for a month place plants under water stress severe enough to reduce herbage biomass production. These levels of water stress are a major factor limiting the quantity and quality of plant growth in western North Dakota and can limit livestock production if not considered during the development and implementation of long-term grazing management strategies.
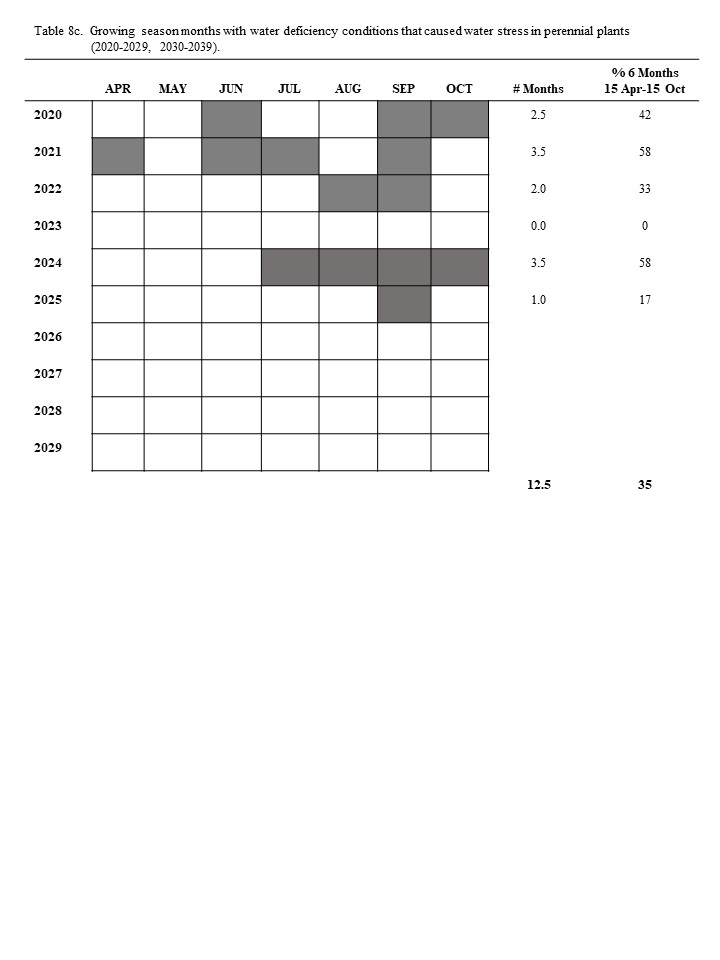
The ombrothermic procedure to identify growing season months with water deficiency treats each month as an independent event. Precipitation during the other months of the year may buffer or enhance the degree of water stress experienced by perennial plants during water deficiency months. The impact of precipitation during other months on the months with water deficiency can be evaluated from annual running total precipitation data (table 10). Water deficiency conditions occurred during 3.5 months in 2024 (table 10).
Conclusion
The vegetation in a region is a result of the total effect of the long-term climatic factors for that region. Ecologically, the most important climatic factors that affect rangeland plant growth are light, temperature, water (precipitation), and water deficiency.
Light is the most important ecological factor because it is necessary for photosynthesis. Changes in time of year and time of day coincide with changes in the angle of incidence of the sun’s rays; these changes cause variations in light intensity. Daylight duration oscillation for each region is the same every year and changes with the seasons. Shading of sunlight by cloud cover and from other plants affects plant growth.
Day-length period is important to plant growth because it functions as a trigger to physiological processes. Most cool-season plants reach flower phenophase between mid-May and mid-June. Most warm-season plants flower between mid-June and mid-September.
Plant growth is limited by both low and high temperatures and occurs within only a narrow range of temperatures, between 32o and 122o F. Perennial plants have a 6-month growing season, between mid-April and mid-October. Diurnal temperature fluctuations of warm days and cool nights are beneficial for plant growth. Cool- season plants have lower optimum temperatures for photosynthesis than do warm-season plants, and cool-season plants do not use water as efficiently as do warm-season plants. Temperature affects evaporation rates, which has a dynamic effect on the annual ratios of cool-season to warm-season plants in the plant communities. A mixture of cool- and warm-season plants is highly desirable because the grass species in a mixture of cool- and warm-season species have a wide range of different optimum temperatures and the herbage biomass production is more stable over wide variations in seasonal temperatures.
Water is essential for living systems. Average annual precipitation received at the DREC Ranch is 16.9 inches, with 84.4% occurring during the growing season and 47.3% occurring in May, June, and July. Plant water stress occurs when the rate of water loss through transpiration exceeds the rate of replacement by absorption. Years
with drought conditions have occurred 14.0% of the time during the past 43 years. Growing seasons with drought conditions have occurred 14.0% of the time.
Water deficiencies exist when the amount of rainfall received is less than evapotranspiration demand. Temperature and precipitation data can be used in ombrothermic graphs to identify monthly periods with water deficiencies. During the past 43 years, 30.4% of the growing-season months had water deficiency conditions that placed range plants under water stress: range plants were limited in growth and herbage biomass accumulation for an average of 2.0 months during every 6-month growing season. May, June, and July had water deficiency conditions 9.3%, 14.0%, and 34.9% of the time, respectively. August, September, and October had water deficiency conditions 46.5%, 53.5% and 34.9% of the time, respectively. One month with water deficiency conditions causes plants to experience water stress severe enough to reduce herbage biomass production.
Most of the growth in range grasses occurs in May, June, and July. In western North Dakota, 100% of range grass leaf growth in height and 86% to 100% of range flower stalk growth in height are completed by 30 July. Peak aboveground herbage biomass production usually occurs during the last 10 days of July, a period that coincides with the time during which plants are attaining 100% of their height. Most range grass growth occurs during the 3- month period of May, June, and July, when 47.3% of the annual precipitation occurs.
Grassland management should be based on phenological growth stages of the major grasses and can be planned by calendar date. Management strategies for a region should consider the climatic factors that affect and limit range plant growth.
Acknowledgment
I am grateful to Sheri Schneider for assistance in processing the weather data, compilation of the tables and figures, and production of this manuscript.
| Table 3. Precipitation in inches and percent of long-term mean for perennial plant growing season months, 1982-2024. | |||||||||
Apr |
May |
Jun |
Jul |
Aug |
Sep |
Oct |
Growing Season |
Annual Total | |
Long-Term Mean 1982-2024 |
1.42
|
2.65 |
3.04 |
2.30 |
1.97 |
1.59 |
1.31 |
14.28 |
16.91 |
| 1982 | 1.37 | 2.69 | 4.30 | 3.54 | 1.75 | 1.69 | 5.75 | 21.09 | 25.31 |
| % of LTM | 96.48 | 101.51 | 141.45 | 153.91 | 88.83 | 106.29 | 438.93 | 147.73 | 149.62 |
| 1983 | 0.21 | 1.53 | 3.26 | 2.56 | 4.45 | 0.86 | 0.72 | 13.59 | 15.55 |
| % of LTM | 14.79 | 57.74 | 107.24 | 111.30 | 225.89 | 54.09 | 54.96 | 95.20 | 91.92 |
| 1984 | 2.87 | 0.00 | 5.30 | 0.11 | 1.92 | 0.53 | 0.96 | 11.69 | 12.88 |
| % of LTM | 202.11 | 0.00 | 174.34 | 4.78 | 97.46 | 33.33 | 73.28 | 81.89 | 76.14 |
| 1985 | 1.24 | 3.25 | 1.58 | 1.07 | 1.84 | 1.69 | 2.13 | 12.80 | 15.13 |
| % of LTM | 87.32 | 122.64 | 51.97 | 46.52 | 93.40 | 106.29 | 162.60 | 89.66 | 89.44 |
| 1986 | 3.13 | 3.68 | 2.58 | 3.04 | 0.46 | 5.29 | 0.18 | 18.36 | 22.96 |
| % of LTM | 220.42 | 138.87 | 84.87 | 132.17 | 23.35 | 332.70 | 13.74 | 128.61 | 135.74 |
| 1987 | 0.10 | 1.38 | 1.15 | 5.39 | 2.65 | 0.78 | 0.08 | 11.53 | 14.13 |
| % of LTM | 7.04 | 52.08 | 37.83 | 234.35 | 134.52 | 49.06 | 6.11 | 80.77 | 83.53 |
| 1988 | 0.00 | 1.85 | 1.70 | 0.88 | 0.03 | 0.73 | 0.11 | 5.30 | 9.03 |
| % of LTM | 0.00 | 69.81 | 55.92 | 38.26 | 1.52 | 45.91 | 8.40 | 37.13 | 53.38 |
| 1989 | 2.92 | 1.73 | 1.63 | 1.30 | 1.36 | 0.70 | 0.96 | 10.60 | 13.07 |
| % of LTM | 205.63 | 65.28 | 53.62 | 56.52 | 69.04 | 44.03 | 73.28 | 74.25 | 77.26 |
| 1990 | 2.03 | 2.39 | 3.75 | 1.13 | 0.31 | 0.68 | 0.85 | 11.14 | 11.97 |
| % of LTM | 142.96 | 90.19 | 123.36 | 49.13 | 15.74 | 42.77 | 64.89 | 78.03 | 70.76 |
| 1991 | 1.97 | 1.16 | 3.95 | 1.43 | 0.55 | 2.17 | 1.31 | 12.54 | 13.30 |
| % of LTM | 138.73 | 43.77 | 129.93 | 62.17 | 27.92 | 136.48 | 100.00 | 87.84 | 78.62 |
| 1992 | 0.81 | 0.68 | 1.59 | 2.70 | 2.02 | 0.72 | 0.16 | 8.68 | 11.23 |
| % of LTM | 57.04 | 25.66 | 52.30 | 117.39 | 102.54 | 45.28 | 12.21 | 60.80 | 66.38 |
| 1993 | 1.41 | 1.71 | 4.57 | 5.10 | 1.24 | 0.18 | 0.05 | 14.26 | 17.36 |
| % of LTM | 99.30 | 64.53 | 150.33 | 221.74 | 62.94 | 11.32 | 3.82 | 99.89 | 102.62 |
| 1994 | 0.86 | 1.46 | 4.51 | 1.07 | 0.31 | 1.08 | 4.58 | 13.87 | 16.14 |
| % of LTM | 60.56 | 55.09 | 148.36 | 46.52 | 15.74 | 67.92 | 349.62 | 97.16 | 95.41 |
| Table 3 (cont). Precipitation in inches and percent of long-term mean for perennial plant growing season months, 1982- 2024. | |||||||||
Apr |
May |
Jun |
Jul |
Aug |
Sep |
Oct |
Growing Season |
Annual Total | |
Long-Term Mean 1982-2024 |
1.42 |
2.65 |
3.04 |
2.30 |
1.97 |
1.59 |
1.31 |
14.28 |
16.91 |
| 1995 | 1.01 | 4.32 | 0.68 | 4.62 | 3.16 | 0.00 | 0.67 | 14.46 | 16.24 |
| % of LTM | 71.13 | 163.02 | 22.37 | 200.87 | 160.41 | 0.00 | 51.15 | 101.29 | 96.00 |
| 1996 | 0.14 | 3.07 | 1.86 | 2.55 | 1.72 | 2.51 | 0.09 | 11.94 | 15.97 |
| % of LTM | 9.86 | 115.85 | 61.18 | 110.87 | 87.31 | 157.86 | 6.87 | 83.64 | 94.40 |
| 1997 | 2.89 | 0.95 | 5.02 | 5.41 | 0.76 | 1.75 | 0.78 | 17.56 | 18.61 |
| % of LTM | 203.52 | 35.85 | 165.13 | 235.22 | 38.58 | 110.06 | 59.54 | 123.01 | 110.01 |
| 1998 | 0.40 | 1.51 | 5.98 | 2.11 | 4.60 | 0.71 | 4.38 | 19.69 | 22.42 |
| % of LTM | 28.17 | 56.98 | 196.71 | 91.74 | 233.50 | 44.65 | 334.35 | 137.93 | 132.53 |
| 1999 | 1.10 | 4.93 | 1.59 | 1.80 | 2.70 | 2.40 | 0.00 | 14.52 | 15.56 |
| % of LTM | 77.46 | 186.04 | 52.30 | 78.26 | 137.06 | 150.94 | 0.00 | 101.71 | 91.98 |
| 2000 | 1.26 | 1.90 | 3.77 | 2.77 | 2.74 | 1.09 | 1.46 | 14.99 | 20.23 |
| % of LTM | 88.73 | 71.70 | 124.01 | 120.43 | 139.09 | 68.55 | 111.45 | 105.00 | 119.59 |
| 2001 | 2.70 | 0.53 | 6.36 | 4.87 | 0.00 | 1.94 | 0.00 | 16.40 | 18.03 |
| % of LTM | 190.14 | 20.00 | 209.21 | 211.74 | 0.00 | 122.01 | 0.00 | 114.88 | 106.58 |
| 2002 | 1.14 | 2.18 | 5.40 | 4.27 | 4.24 | 0.74 | 0.88 | 18.85 | 21.88 |
| % of LTM | 80.28 | 82.26 | 177.63 | 185.65 | 215.23 | 46.54 | 67.18 | 132.04 | 129.34 |
| 2003 | 1.30 | 4.34 | 1.42 | 2.03 | 0.82 | 2.37 | 0.74 | 13.02 | 19.12 |
| % of LTM | 91.55 | 163.77 | 46.71 | 88.26 | 41.62 | 149.06 | 56.49 | 91.20 | 113.03 |
| 2004 | 0.89 | 1.31 | 1.65 | 2.30 | 0.93 | 2.57 | 3.10 | 12.75 | 16.51 |
| % of LTM | 62.68 | 49.43 | 54.28 | 100.00 | 47.21 | 161.64 | 236.64 | 89.31 | 97.60 |
| 2005 | 0.96 | 6.01 | 6.05 | 0.60 | 1.52 | 0.50 | 1.96 | 17.60 | 21.51 |
| % of LTM | 67.61 | 226.79 | 199.01 | 26.09 | 77.16 | 31.45 | 149.62 | 123.29 | 127.15 |
| 2006 | 2.78 | 2.82 | 2.13 | 0.96 | 2.87 | 1.42 | 2.01 | 14.99 | 17.70 |
| % of LTM | 195.77 | 106.42 | 70.07 | 41.74 | 145.69 | 89.31 | 153.44 | 105.00 | 104.63 |
| 2007 | 1.58 | 4.64 | 1.80 | 1.05 | 0.78 | 0.76 | 0.26 | 10.87 | 13.94 |
| of LTM | 111.27 | 175.09 | 59.21 | 45.65 | 39.59 | 47.80 | 19.85 | 76.14 | 82.40 |
| Table 3 (cont). Precipitation in inches and percent of long-term mean for perennial plant growing season months, 1982- 2024. | |||||||||
Apr |
May |
Jun |
Jul |
Aug |
Sep |
Oct |
Growing Season |
Annual Total | |
Long-Term Mean 1982-2024 |
1.42 |
2.65 |
3.04 |
2.30 |
1.97 |
1.59 |
1.31 |
14.28 |
16.91 |
| 2008 | 0.61 | 2.79 | 4.02 | 1.06 | 1.02 | 1.04 | 1.68 | 12.22 | 14.88 |
| % of LTM | 42.96 | 105.28 | 132.24 | 46.09 | 51.78 | 65.41 | 128.24 | 85.60 | 87.96 |
| 2009 | 1.49 | 2.47 | 3.84 | 3.24 | 0.95 | 1.15 | 1.95 | 15.09 | 17.89 |
| % of LTM | 104.93 | 93.21 | 126.32 | 140.87 | 48.22 | 72.33 | 148.86 | 105.70 | 105.75 |
| 2010 | 1.43 | 3.70 | 3.50 | 1.94 | 1.39 | 4.09 | 0.13 | 16.18 | 19.03 |
| % of LTM | 100.70 | 139.62 | 115.13 | 84.35 | 70.56 | 257.23 | 9.92 | 113.34 | 112.49 |
| 2011 | 1.66 | 6.87 | 2.15 | 2.33 | 2.70 | 1.76 | 0.44 | 17.91 | 21.28 |
| % of LTM | 116.90 | 259.25 | 70.72 | 101.30 | 137.06 | 110.69 | 33.59 | 125.46 | 125.79 |
| 2012 | 2.38 | 1.58 | 4.31 | 1.98 | 0.82 | 0.21 | 2.35 | 13.63 | 15.46 |
| % of LTM | 167.61 | 59.62 | 141.78 | 86.09 | 41.62 | 13.21 | 179.39 | 95.48 | 91.39 |
| 2013 | 1.05 | 7.55 | 2.23 | 2.13 | 2.81 | 2.44 | 3.35 | 21.56 | 23.22 |
| % of LTM | 73.94 | 284.91 | 73.36 | 92.61 | 142.64 | 153.46 | 255.73 | 151.02 | 137.26 |
| 2014 | 1.41 | 3.73 | 3.38 | 0.37 | 8.84 | 1.03 | 0.59 | 19.35 | 21.11 |
| % of LTM | 99.30 | 140.75 | 111.18 | 16.09 | 448.73 | 64.78 | 45.04 | 135.54 | 124.79 |
| 2015 | 0.60 | 1.65 | 4.68 | 2.87 | 1.69 | 1.35 | 1.96 | 14.80 | 17.01 |
| % of LTM | 42.25 | 62.26 | 153.95 | 124.78 | 85.79 | 84.91 | 149.62 | 103.67 | 100.55 |
| 2016 | 3.44 | 2.26 | 1.96 | 3.61 | 1.86 | 2.66 | 1.80 | 17.59 | 19.70 |
| % of LTM | 242.25 | 85.28 | 64.47 | 156.96 | 94.42 | 180.95 | 137.40 | 123.22 | 116.45 |
| 2017 | 1.30 | 0.84 | 1.27 | 0.72 | 2.67 | 2.28 | 0.08 | 9.16 | 10.55 |
| % of LTM | 91.55 | 31.70 | 41.78 | 31.30 | 135.53 | 143.40 | 6.11 | 64.16 | 62.36 |
| 2018 | 0.48 | 1.22 | 4.23 | 2.01 | 0.55 | 1.84 | 0.66 | 10.99 | 14.39 |
| % of LTM | 33.80 | 46.04 | 139.14 | 87.39 | 27.92 | 115.72 | 50.38 | 76.98 | 85.06 |
| 2019 | 1.35 | 2.52 | 2.60 | 1.61 | 4.70 | 9.10 | 1.26 | 23.14 | 25.88 |
| % of LTM | 95.07 | 95.09 | 85.53 | 70.00 | 238.58 | 572.33 | 96.18 | 162.09 | 152.99 |
| 2020 | 0.59 | 1.45 | 1.10 | 2.67 | 2.56 | 0.86 | 0.26 | 9.49 | 11.01 |
| % of LTM | 41.55 | 54.72 | 36.18 | 116.09 | 129.95 | 54.09 | 19.85 | 66.48 | 65.08 |
| Table 3 (cont). Precipitation in inches and percent of long-term mean for perennial plant growing season months, 1982- 2024. | |||||||||
Apr |
May |
Jun |
Jul |
Aug |
Sep |
Oct |
Growing Season |
Annual Total | |
Long-Term Mean 1982-2024 |
1.42 |
2.65 |
3.04 |
2.30 |
1.97 |
1.59 |
1.31 |
14.28 |
16.91 |
| 2021 | 0.26 | 5.07 | 1.07 | 1.03 | 1.63 | 0.14 | 2.70 | 11.90 | 13.75 |
| % of LTM | 18.31 | 191.32 | 35.20 | 44.78 | 82.74 | 8.81 | 206.11 | 83.36 | 81.28 |
| 2022 | 4.16 | 3.17 | 2.02 | 3.71 | 0.28 | 0.93 | 1.84 | 16.11 | 20.16 |
| % of LTM | 292.96 | 119.62 | 66.45 | 161.30 | 14.21 | 58.49 | 140.46 | 112.85 | 119.17 |
| 2023 | 0.30 | 2.69 | 1.91 | 2.21 | 3.25 | 1.32 | 1.24 | 12.92 | 15.42 |
| % of LTM | 21.13 | 101.51 | 62.83 | 96.09 | 164.97 | 83.02 | 94.66 | 90.50 | 91.15 |
| 2024 | 1.35 | 2.35 | 2.75 | 0.88 | 1.28 | 0.12 | 0.00 | 8.73 | 10.89 |
| % of LTM | 95.07 | 88.68 | 90.46 | 38.26 | 64.97 | 7.55 | 0.00 | 61.15 | 64.37 |
| |||||||||||
| APR | MAY | JUN | JUL | AUG | SEP | OCT | #Months | % 6 Months 15 Apr-15 Oct | |||
| Total | 6 | 4 | 6 | 15 | 20 | 23 | 15 | 78.5 | 30.4 | ||
% of 43 YEARS | 14.0 | 9.3 | 14.0 | 34.9 | 46.5 | 53.5 | 34.9 | ||||
| Table 10. Monthly precipitation and running total precipitation compared to the long-term mean (LTM), 2024. | ||||||
Monthly Precipitation (in) | Running Total Precipitation (in) | |||||
Months |
LTM 1982-2023 |
Precipitation 2024 |
% of LTM | Running LTM 1982-2023 | Running Precipitation 2024 |
% of LTM |
| Jan | 0.43 | 0.23 | 53.49 | 0.43 | 0.23 | 53.49 |
| Feb | 0.43 | 0.29 | 67.44 | 0.86 | 0.52 | 60.47 |
| Mar | 0.76 | 0.57 | 75.00 | 1.62 | 1.09 | 67.28 |
| Apr | 1.42 | 1.35 | 95.07 | 3.04 | 2.44 | 80.26 |
| May | 2.66 | 2.35 | 88.35 | 5.70 | 4.79 | 84.04 |
| Jun | 3.04 | 2.75 | 90.46 | 8.74 | 7.54 | 86.27 |
| Jul | 2.34 | 0.88 | 37.61 | 11.08 | 8.42 | 75.99 |
| Aug | 1.99 | 1.28 | 64.32 | 13.07 | 9.70 | 74.22 |
| Sep | 1.62 | 0.12 | 7.41 | 14.69 | 9.82 | 66.85 |
| Oct | 1.34 | 0.00 | 0.00 | 16.03 | 9.82 | 61.26 |
| Nov | 0.55 | 0.15 | 27.27 | 16.58 | 9.97 | 60.13 |
| Dec | 0.48 | 0.92 | 191.67 | 17.06 | 10.89 | 63.83 |
| Total | 17.06 | 10.89 | 63.83 |
|
|
|
Literature Cited
Barbour, M.G., J.H. Burk, and W.D. Pitts. 1987. Terrestrial plant ecology. The Benjamin/Cummings Publishing Co., Menlo Park, CA. 634p.
Barker, W.T., and W.C. Whitman. 1988. Vegetation of the Northern Great Plains. Rangelands 10:266-272.
Bluemle, J.P. 1977. The face of North Dakota: the geologic story. North Dakota Geological Survey. Ed. Series 11. 73p.
Bluemle, J.P. 1991. The face of North Dakota: revised edition. North Dakota Geological Survey. Ed. Series 21. 177p.
Brown, R.W. 1977. Water relations of range plants. Pages 97-140. in R.E. Sosebee (ed.) Rangeland plant physiology. Range Science Series No. 4. Society for Range Management. Denver, CO.
Brown, R.W. 1995. The water relations of range plants: adaptations to water deficits. Pages 291-413. in D.J. Bedunah and R.E. Sosebee (eds.). Wildland plants: physiological ecology and developmental morphology. Society for Range Management. Denver, CO.
Coyne, P.I., M.J. Trlica, and C.E. Owensby. 1995. Carbon and nitrogen dynamics in range plants. Pages 59-167. in D.J. Bedunah and R.E. Sosebee (eds.). Wildland plants: physiological ecology and developmental morphology. Society for Range Management. Denver, CO.
Dahl, B.E., and D.N. Hyder. 1977. Developmental morphology and management implications. Pages 257-290. in R.E. Sosebee (ed.). Rangeland plant physiology. Range Science Series No. 4. Society for Range Management. Denver, CO.
Dahl, B.E. 1995. Developmental morphology of plants. Pages 22-58. in D.J. Bedunah and R.E. Sosebee (eds.). Wildland plants: physiological ecology and developmental morphology. Society for Range Management. Denver, CO.
Daubenmire, R.F. 1974. Plants and environment. John Wiley and Sons. New York, NY. 422p.
Dickinson Research Center. 1982-2024. Temperature and precipitation weather data.
Emberger, C., H. Gaussen, M. Kassas, and A. dePhilippis. 1963. Bioclimatic map of the Mediterranean Zone, explanatory notes. UNESCO-FAO. Paris. 58p.
Goetz, H. 1963. Growth and development of native range plants in the mixed grass prairie of western North Dakota. M.S. Thesis, North Dakota State University, Fargo, ND. 165p.
Jensen, R.E. 1972. Climate of North Dakota. National Weather Service, North Dakota State University, Fargo, ND. 48p.
Langer, R.H.M. 1972. How grasses grow. Edward Arnold. London, Great Britain. 60p.
Larson, K.E., A.F. Bahr, W. Freymiller, R. Kukowski, D. Opdahl, H. Stoner, P.K. Weiser, D. Patterson, and
O. Olson. 1968. Soil survey of Stark County, North Dakota. U.S. Government Printing Office, Washington, DC. 116p.+ plates.
Leopold, A.C., and P.E. Kriedemann. 1975. Plant growth and development. McGraw-Hill Book Co. New York, NY. 545p.
Manske, L.L. 1994a. History and land use practices in the Little Missouri Badlands and western North Dakota. Proceedings- Leafy spurge strategic planning workshop. USDI National Park Service, Dickinson, ND. p. 3-16.
Manske, L.L. 1994b. Problems to consider when implementing grazing management practices in the Northern Great Plains. NDSU Dickinson Research Extesion Center. Range Management Report DREC 94-1005, Dickinson, ND. 11p.
Manske, L.L. 1999. Prehistorical conditions of rangelands in the Northern Great Plains. NDSU Dickinson Research Extension Center. Summary Range Management Report DREC 99-3015, Dickinson, ND. 5p.
Manske, L.L. 2011. Range plant growth and development are affected by climatic factors. NDSU Dickinson Research Extension Center. Summary Range Management Report DREC 11-3019c, Dickinson, ND. 5p.
McMillan, C. 1957. Nature of the plant community. III. Flowering behavior within two grassland communities under reciprocal transplanting. American Journal of Botany 44 (2): 144-153.
National Weather Service. 1996. Sunrise and sunset time tables for Dickinson, North Dakota. National Weather Service, Bismarck, ND. 1p.
Odum, E.P. 1971. Fundamentals of ecology. W.B. Saunders Company. Philadelphia, PA. 574p.
Ramirez, J.M. 1972. The agroclimatology of North Dakota, Part 1. Air temperature and growing degree days. Extension Bulletin No. 15. North Dakota State University, Fargo, ND. 44p.
Roberts, R.M. 1939. Further studies of the effects of temperature and other environmental factors upon the photoperiodic response of plants. Journal of Agricultural Research 59(9): 699-709.
Shiflet, T.N. (ed.). 1994. Rangeland cover types. Society for Range Management. Denver, CO. 152p.
Weier, T.E., C.R. Stocking, and M.G. Barbour. 1974. Botany: an introduction to plant biology. John Wiley and Sons. New York, NY. 693p.
Wildryes as Fall Complementary Pastures for the Northern Plains
Llewellyn L. Manske PhD
Scientist of Rangeland Research
North Dakota State University
Dickinson Research Extension Center
Report DREC 25-4032b
Fall Complementary Pastures
The wildryes are the only perennial grass type that retains adequate nutritional quality to meet a lactating cows requirements during fall grazing from mid-October to mid-November. Despite these unique important characteristics, wildryes are not a popular fall pasture in the Northern Plains. The problem isn’t the grasses. The problem is the management. The wildryes do not grow and behave like native grasses of the Northern Mixed Grass Prairie and cannot be managed with the same techniques that the native grasses are managed. The native grasses plus crested wheatgrass and smooth bromegrass grow and behave as if they were types of perennial spring wheat. The wildrye grasses grow and behave as if they were types of perennial winter wheat. Proper management of wildrye fall pastures must be adjusted to accommodate these differences in growth and behavior.
There are numerous types of wildryes in the world. The two common types in the Northern Plains are Altai and Russian Wildryes.
Altai wildrye, Leymus angustus (Trin.) Pilg., is a member of the grass family, Poaceae, tribe, Triticeae, syn.: Elymus angustus Trin., and is a long lived perennial, monocot, cool-season, mid grass, that is drought tolerant, very winter hardy, highly tolerant of saline soils nearly at the level of tall wheatgrass, and fairly tolerant of alkaline soils. Altai wildrye was introduced into Canada as two seed lots. The first seed lot arrived in 1934 from Voronezh, USSR, located in the far western European Russian Steppe. The second seed lot arrived in 1939 from the Steppe of Kustanay located in the northern region of Kazakhstan. Three synthetic strains were developed from seed increase plots started in 1950 at the Swift Current Research Station followed by more sites at seven research stations in Alberta, Manitoba, and Saskatchewan, which produced the first released cultivar, Prairieland, in 1976. Seed from the increase fields at Swift Current was used to establish 60 acres of Altai wildrye monoculture at the NDSU Dickinson Research Extension Center for a replicated study of late season grazing during mid-October to mid-November conducted from 1983 to 2005 for 23 years. Early aerial growth consists of basal leaves from crown tiller buds. Basal leaf blades are 15-25 cm (6-10 in) long, 0.5-0.7 cm wide, erect, coarse, light green to bluegreen to blue, and can remain upright under deep wet snow. The leaf sheath is usually shorter than the internodes and grayish green. The membrane ligule is 0.5-1.0 mm long with an obtuse apex. Some early specimens of introduced strains showed vigorous rhizome charateristics and aggressive spreading which was considered to be undesirable. The available released plant material are generally weakly rhizomatous with short rhizomes. Unfortunately, fields seeded with plant material that has nonaggressive short rhizomes is limited by around a 20 to 25 year life expectancy. However, the uniquely deep extensive fibrous root system that can penetrate to depths of 3-4 m (9.8-13.1 ft) and efficiently absorb available soil water was retained. Regeneration is primarily asexual propagation by crown and short rhizome tiller buds. Seedlings have slow, weak growth and are successful only when competition from established plants is nonexistant. Flower stalks are erect, 60-100 cm (24-39 in) tall, mostly leafless and few in numbers. Inflorescence is a terminal spike 15-20 cm (6-8 in) long, 1 cm in diameter, that has closely spread overlapping spikelets of 2 or 3 florets, with 2 or 3 spikelets per node. Basal leaves are palatable to livestock and seed stalks are not. Wildryes maintain slightly higher levels of protein and digestibility with advancing maturity better than other species of perennial grasses. Wildryes are best used for late season grazing from mid-October to mid-November. Fire top kills aerial parts and kills deeply into the crown when soil is dry. Fire halts the processes of the four major defoliation resistance mechanisms and causes great reduction in biomass production and tiller density. This summary information on growth development and regeneration of Altai wildrye was based on works of Lawrence 1976, and St. John et al. 2010.
Russian wildrye, Psothyrostachys juncea (Fisch.) Nevski., is a member of the grass family, Poaceae, tribe, Triticeae, syn.: Elymus junceus Fisch., and is a long-lived perennial, monocot, cool-season, mid grass, that is exceptionally drought tolerant, tolerant of extremely cold temperatures, highly tolerant of saline soils, fairly tolerant of alkaline soils, intolerant of spring flooding or high water tables, and does not perform well on sandy soils. Russian wildrye was introduced into the United States from Siberia. It was brought to North Dakota in 1907, grown at the Dickinson Research Extension Center in 1913, and grown at the USDA-ARS at Mandan, ND. in 1927. It was introduced into Canada from Siberia in 1926. Early aerial growth consists of basal leaves from crown tiller buds. Basal leaf blades are 7-40 cm (3-16 in) long, 2-6 mm wide, soft, lax, numerous and dense. The split sheath has overlapping margins and open at the top. Previous years sheath bases are persistent and shredded into fibers. The collar is broad and continuous. The membrane ligule is 1 mm long with a blunt flat edge that has numerous small irregular cuts. The small auricles are 2 mm long, clasping, and clawlike. Some plants form no rhizomes, while other plants have several short rhizomes, while other plants have several short rhizomes that form clumps 20-30 cm (8-12 in) wide. Unfortunately, fields seeded with plant material that has nonaggressive short rhizomes is limited by around a 20 to 25 year life expectancy. All bunches have an extensive network of dense, fibrous roots with a lateral spread of 1.2-1.5 m (4-5 ft) that descend downward to 2.5-3.0 m (8-10 ft) deep. About 75% of the root biomass is in the top 15-61 cm (6-24 in) of soil that provides high plant competition to most other species. Regeneration is primarily asexual propagation by crown and short rhizome tiller buds. Seedlings are weak, develop slowly and are successful only when competition from established plants is nonexistant. Flower stalks are erect, hollow, 60-100 cm (24-39 in) tall, mostly leafless and few in number. Inflorescence is a terminal spike 6-11 cm (2.4-4.3 in) long, 5-9 mm wide, that has closely spaced overlapping spikelets of 1 to 4 florets, with 2 or 3 spikelets per node. Flower period in the Great Plains is May and June. Basal leaves are palatable to livestock and seed stalks are not. Wildryes maintain slightly higher levels of protein and digestibility with advancing maturity better than other species of perennial grasses. Wildryes are best used for late season grazing from mid-October to mid-November. Fire top kills aerial parts and kills deeply into the crown when soil is dry. Fire halts the processes of the four major defoliation resistance mechanisms and causes great reduction in biomass production and tiller density. This summary information on growth development and regeneration of Russian wildrye was based on works of Stevens 1963, Dodds 1979, Great Plains Flora Association 1986, Ogle et al. 2005, Taylor 2005, and Johnson and Larson 2007.
Wildryes Require Different Management Practices
Growth characteristics of Altai wildrye is quite different from native cool season grasses. Grazing cool season native grasses during vegetative growth stage prior to the flower stage activates vegetative tiller development from axillary buds. Lightly grazing of Altai wildrye prior to the flower stage did not activate vegetative tillers. Early season grazing actually decreased tiller basal cover. However, fall grazing during mid-October to mid-November that removed 50% or less of the standing leaf biomass greatly increased vegetative secondary tillers and fall tillers that develop during the following summer and early fall.
During early spring, the carryover tillers that survived the winter in the 50% residual herbage biomass of Altai wildrye tussocks regreened providing most of the carbohydrates and energy used for growth of the current leaves of the new seasons lead tillers. Removal of most of the herbage biomass during the fall grazing period causes termination of a major portion of the living crown tillers with greatly reduced active lead tiller growth and critical reductions in herbage biomass and nutritional quality the following growing season.
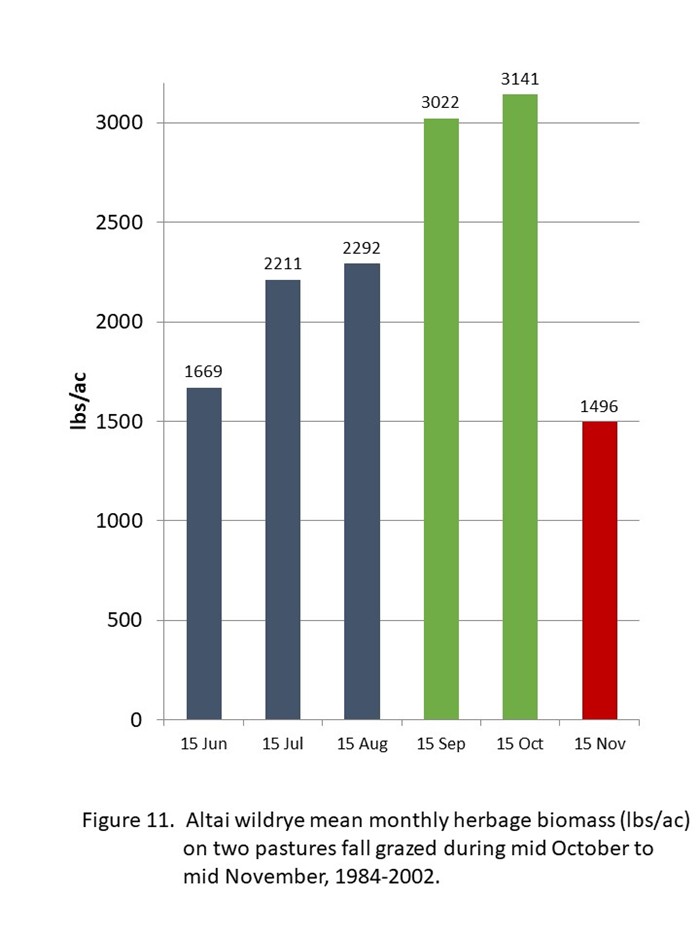
Lead tillers produce 3.5 new leaves around early June. The seed stalks develop early and are visible before 21 June. The carryover leaves senescence during June. Most of the aboveground herbage biomass weight in June (1668.80 lbs/ac) is the new leaves and stalks of the current lead tillers (figure 11). After the flower stage, the crude protein content of the lead tillers starts to decrease slowly. The vegetative tillers, that have been activated during the previous fall grazing period, begin visible growth shortly after the lead tillers reach the flower stage. The aboveground herbage biomass during July (2210.59 lbs/ac) and August (2291.83 lbs/ac) is the slowly senescent lead tillers and the rapidly growing vegetative tillers. From mid-August to about mid-October, the fall tillers develop and produce the additional herbage biomass during September (3021.91 lbs/ac) and October (3140.89 lbs/ac). By mid-October, the fall tillers should have around 10% to 12% crude protein, the vegetative tillers should have around 10% to 8% crude protein, and the lead tillers should have 8% to 6% crude protein. The ratio of the three tiller types would effect the mean crude protein level of the Altai wildrye forage during the fall grazing period from mid-October to mid-November (table 16, figure 11).
The lead tillers terminate at the end of their second growing season, the year they produce a seed head. The vegetative tillers carryover during the winter and become the next seasons lead tillers. The fall tillers carryover during the winter and become the next seasons vegetative tillers, a few well developed fall tillers may become lead tillers. The survival of the carryover vegetative tillers and fall tillers depends on the amount of leaf area they retain at the end of the fall grazing period. When 50% or more of the aboveground herbage remains on mid-November (1500.00 lbs/ac), most of the vegetative tillers and fall tillers survive to the next spring. However, when greater than 50% of the aboveground herbage is removed by mid November or during an injudicious longer grazing period after mid November, most of the vegetative tillers and fall tillers will have lost greater leaf biomass than they can recover from, resulting in an extremely low survival rate and a rapidly degrading wildrye stand. This devastating reduction in herbage biomass has been incorrectly blamed unto the grass, not on the management practice that truly caused the reductions.
The wildryes do not increase vegetative tiller growth by light grazing during the early vegetative growth stages of lead tillers before the flower stage. So do not graze wildryes during May or June. Vegetative secondary tillers and fall tillers are stimulated by fall grazing from mid-October to mid-November. There is no data of grazing stimulation during mid-September to mid-October. We know that grazing from mid-October to mid-November works when 1500 lbs/ac residual herbage remain from mid-November to spring. That seems like a lot of herbage to leave. Remember that at least 1500 lbs/ac of forage is available to be removed. If the 50% quantity of residual is not remaining at the end of the fall grazing period, the quantity of herbage produced for the next fall grazing period will be much less than the potential 3000 lbs/ac, plus a loss of a potential 1000 lbs/ac to 2000 lbs/ac in additional herbage that could be produced when the grasses remain healthy. The residual of 1500 lbs/ac must remain or your management will fail the vegetation, the stand will deteriorate in 20 to 25 years, and the grass receives the blame. By leaving 50% residual annually, the wildrye stand life expectancy could be perpetual. This will require another long-term research study.
Performance of Grass and Livestock
Altai wildrye is an excellent fall pasture during mid-October to mid-November. The wildryes have been considered to be difficult to grow because they respond differently than the native grasses and common domesticated grasses to standard grassland practices. The wildryes are different and require different management practices. The wildryes are not the problem. The standard management practices are the problem. With 27 years of research, the problems with the standard practices can be corrected.
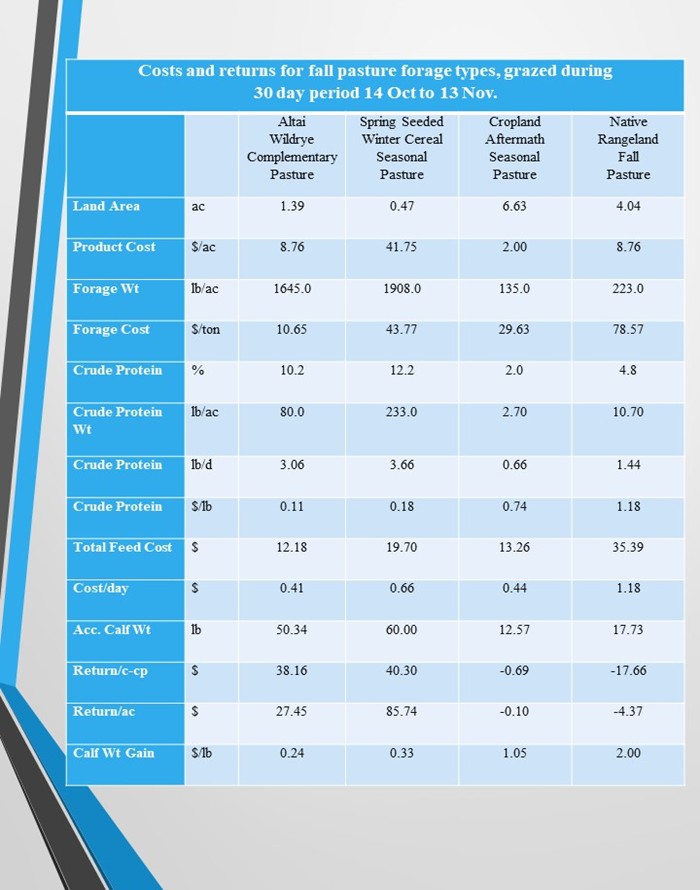
Four different forage sources for fall complementary pastures have been evaluated that compared two perennial grass forage types and compared two cropland forage types. Two biologically effective fall complementary pastures are Altai wildrye (perennial grass) and Spring Seeded Winter Cereal (cropland). Two traditional fall pastures are Native Rangeland (perennial grass) and Cropland Aftermath (cropland).
The biologically effective fall complementary perennial grass pasture was Altai wildrye. Cow and calf pairs grazed one pasture of Altai wildrye (replicated two times) at 1.41 ac/AUM for 30 days (1.39 ac/AU) from mid-October to mid-November (table 17).
The traditional fall complementary perennial grass pasture was native rangeland. Cow and calf pairs grazed one pasture of native rangeland (replicated two times) at 4.11 ac/AUM for 30 days (4.04 ac/AU) from mid-October to mid-November (table 17).
The one pasture traditional concept of native rangeland provided 891 lbs/ac herbage during the mid-October to mid-November grazing period leaving a residual of 668 lbs/ac, which would indicate a utilization rate of 223 lbs/ac. There is no new growth of native rangeland after mid October and leaf senescence is greatly accelerated, with nutritional quality below a lactating cows crude protein requirements.
The one pasture biologically effective concept of Altai wildrye provided 3141 lbs/ac herbage during the mid-October to mid-November grazing period leaving a residual of 1496 lbs/ac, which would indicate a utilization rate of 1645 lbs/ac. The residual herbage would include highly senescent lead tiller leaves that would contain 8% to 6% crude protein, secondary vegetative tiller leaves that would contain 10% to 8% crude protein, and fall tiller leaves that would contain 12% to 10% crude protein. Some of the residual would contain the totally senescent seed heads of which the cows do not consume.
On the Altai wildrye strategy, calf weight gain was 1.82 lbs per day, 37.12 lbs per acre, and accumulated weight gain was 50.34 lbs per head. Cow weight gain was 1.62 lbs per day, 32.22 lbs per acre, and accumulated weight gain was 42.60 lbs per head (table 18).
On the native rangeland strategy, calf weight gain was 0.59 lbs per day, 4.38 lbs per acre, and accumulated weight gain was 17.73 lbs per head. Cow weight loss was 1.74 lbs per day, 12.90 lbs per acre, and accumulated weight loss was 52.20 lbs per head (table 18).
Cow and calf weight performance on the Altai wildrye strategy was greater than those on the native range strategy. The calf weight gain per day was 208.47% greater, gain per head was 183.93% greater, and gain per acre was 747.49% greater. The cow weight gain per day was 193.10% greater, gain per head was 181.61% greater, and gain per acre was 349.77% greater (table 18).
Pasture costs were 65.58% lower and cost per day were 65.25% lower on the Altai wildrye strategy than those on the native range strategy (table 17). The dollar value captured was greater on the Altai wildrye strategy, pasture weight gain value was 183.96% greater, net return per cow-calf pair was 200.35% greater, and net return per acre was 391.56% greater, while cost per pound of calf gain was 87.94% lower, than those on the native range strategy (table 18).
The biologically effective fall complementary cropland pasture was spring seeded winter cereal. Cow and calf pairs grazed four pastures of spring seeded winter rye with each pasture grazed for one week (replicated two times) at 0.48 ac/AUM for 30 days (0.47 ac/AU) from mid-October to mid-November (table 19).
The traditional fall complementary cropland pasture was cropland aftermath of annual cereal residue of oat and/or barley stubble. Cow and calf pairs grazed one pasture of cereal residue forage (replicated two times) at 6.74 ac/AUM for 30 days (6.63 ac/AU) from mid-October to mid-November (table 19).
The one pasture traditional concept of cropland aftermath provided 270 lbs/ac herbage during the mid-October to mid-November grazing period leaving a residual of 135 lbs/ac, which would indicate a utilization rate of 135 lbs/ac. The nutrient content of stubble from annual cereal harvested for grain is almost nonexistent and lactating cows cannot find forage that meets their crude protein requirements.
The four pasture biologically effective concept of spring seeded winter cereal provided 1908 lbs/ac forage during the mid-October to mid-November grazing period leaving no standing residual vegetation. The livestock had access to one fresh pasture per week with reuse of previous pastures.
On the spring seeded winter cereal strategy, calf weight gain was 2.00 lbs per day, 127.66 lbs per acre, and accumulated weight gain was 60.00 lbs per head. Cow weight gain was 1.05 lbs per day, 67.02 lbs per acre, and accumulated weight gain was 31.50 lbs per head (table 20).
On the cropland aftermath strategy, calf weight gain was 0.42 lbs per day, 1.90 lbs per acre, and accumulated weight gain was 12.57 lbs per head. Cow weight loss was 1.61 lbs per day, 7.27 lbs per acre, and accumulated weight loss was 48.17 lbs per head (table 20).
Cow and calf weight performance on the spring seeded winter cereal strategy was greater than those on the cropland aftermath strategy. The calf weight gain per day was 376.19% greater, gain per head was 377.33% greater, and gain per acre was 6618.95% greater. The cow weight gain per day was 165.22% greater, gain per head was 165.39% greater, and gain per acre was 1021.87% greater (table 20).
Pasture costs were 48.57% greater and cost per day were 50.00% greater on the spring seeded winter cereal strategy than those on the cropland aftermath strategy (table 19). Even though the pasture costs were higher, the dollar value captured was greater on the spring seeded winter cereal strategy, pasture weight gain value was 377.27% greater, net return per cow-calf pair was 600.00% greater, and net return per acre was 7182.09% greater, while cost per pound of calf gain was 68.57% lower, than those on the cropland aftermath strategy (table 20).
Grazing native rangeland after mid October and grazing cropland aftermath of annual cereal residue stubble are old style traditional forage management practices previously used with low-performance livestock that do not work biologically nor economically with modern high-performance livestock. Both practices are deficient at providing adequate forage quality and inefficient at nutrient capture. The cows lose considerable weight and the calf weight gain is diminutive resulting in negative net returns (tables 18 and 20).
| Table 16. Conjectural contributions of weight/acre in pounds (lbs) and percentage (%) by the tiller types to total herbage biomass during monthly periods and percent (%) and pounds (lbs) of crude protein from tiller types during the mid October to mid November grazing period. | |||||||
|
|
|
|
| Grazing Period | ||
| Tiller Type | Jun | Jul | Aug | Sep | Oct | % CP | lbs CP |
| Lead Tillers | |||||||
| lbs/ac | 1669 | 1335 | 1068 | 855 | 684 | 8% | 54.7 |
| % | 100.0 | 60.4 | 46.6 | 28.3 | 21.8
|
|
|
| Secondary Tillers |
|
|
|
|
|
|
|
| lbs/ac |
| 876 | 1224 | 1591 | 1432 | 10% | 143.2 |
| % |
| 39.6 | 53.4 | 52.6 | 45.6
|
|
|
| Fall Tillers |
|
|
|
|
|
|
|
| lbs/ac |
|
|
| 576 | 1025 | 12% | 123.0 |
| % |
|
|
| 19.1 | 32.6
|
|
|
| Total Herbage |
|
|
|
|
|
|
|
| lbs/ac | 1669 | 2211 | 2292 | 3022 | 3141 | 10.2% | 320.9 |
| Table 17. Fall grazing period, stocking rate, and pasture cost on the Biologically Effective concept compared to those on the Traditional concept. | |||||||
Management Strategy Concept |
Grazing Period |
# Days |
# Months | Acres per C-C pr | Acres per AUM | Pasture Cost $ | Cost per day $ |
Biologically Effective Altai wildrye |
14 Oct to 13 Nov |
30 |
0.98 |
1.39 |
1.41 |
12.18 |
0.41 |
Traditional Native Rangeland |
14 Oct to 13 Nov
|
30 |
0.98 |
4.04 |
4.11 |
35.39 |
1.18 |
| % Difference | same | same | same | -65.59 | -65.69 | -65.58 | -65.25 |
| Table 18. Fall cow and calf weight performance and net returns on the Biologically Effective concept compared to those on the Traditional concept. | |||||||
Management Strategy Concept |
Gain per Head lbs |
Gain per Day lbs |
Gain per Acre lbs | Pasture Weight Gain Value $ |
Net Return per C-C pr $ |
Net Return per Acre $ |
Cost/lb Calf Gain $ |
Biologically Effective | |||||||
| Calf | 50.34 | 1.82 | 37.12 | 35.24 | 23.06 | 16.59 | 0.24 |
| Cow | 42.60 | 1.62 | 32.22 |
|
|
|
|
| Traditional |
|
|
|
|
|
|
|
| Calf | 17.73 | 0.59 | 4.38 | 12.41 | -22.98 | -5.69 | 1.99 |
| Cow | -52.20 | -1.74 | -12.90 |
|
|
|
|
| % Difference |
|
|
|
|
|
|
|
| Calf | 183.93 | 208.47 | 747.49 | 183.96 | 200.35 | 391.56 | -87.94 |
| Cow | 181.61 | 193.10 | 349.77 |
|
|
|
|
| Table 19. Fall grazing period, stocking rate, and pasture cost on the Biologically Effective concept compared to those on the Traditional concept. | ||||||||
Management Strategy Concept |
Grazing Period |
# Days |
# Months | Acres per C-C pr | Acres per AUM | Pasture Cost $ | Cost per day $ | |
Biologically Effective Spring Seeded Winter Cereal |
14 Oct to 13 Nov |
30 |
0.98 |
0.47 |
0.48 |
19.70 |
0.66 | |
Traditional Cropland Aftermath |
14 Oct to 13 Nov
|
30 |
0.98 |
6.63 |
6.74 |
13.26 |
0.44 | |
| % Difference | same | same | same | -92.91 | -92.88 | 48.57 | 50.00 | |
| Table 20. Fall cow and calf weight performance and net returns on the Biologically Effective concept compared to those on the Traditional concept. | |||||||
Management Strategy Concept |
Gain per Head lbs |
Gain per Day lbs |
Gain per Acre lbs | Pasture Weight Gain Value $ |
Net Return per C-C pr $ |
Net Return per Acre $ |
Cost/lb Calf Gain $ |
Biologically Effective | |||||||
| Calf | 60.00 | 2.00 | 127.66 | 42.00 | 22.30 | 47.45 | 0.33 |
| Cow | 31.50 | 1.05 | 67.02 |
|
|
|
|
| Traditional |
|
|
|
|
|
|
|
| Calf | 12.57 | 0.42 | 1.90 | 8.80 | -4.46 | -0.67 | 1.05 |
| Cow | -48.17 | -1.61 | -7.27 |
|
|
|
|
| % Difference |
|
|
|
|
|
|
|
| Calf | 377.33 | 376.19 | 6618.95 | 377.27 | 600.00 | 7182.09 | -68.57 |
| Cow | 165.39 | 165.22 | 1021.87 |
|
|
|
|

Literature Cited
Dodds, D.L. 1979. Common grasses and sedges in North Dakota. NDSU Extension Service R-658. Fargo, ND.
Great Plains Flora Association. 1986. Flora of the Great Plains. University of Kansas, Lawrence, KS.
Johnson, J.R., and G.E. Larson. 2007. Grassland plants of South Dakota and the Northern Great Plains. South Dakota University. B 566 (rev.). Brookings, SD.
Lawrence, T. 1976. Prairieland, Altai wildryegrass. Canadian Journal of Plant Science 56:991-992.
Ogle, D., L. St. John, J. Cornwell, L. Holzworth, M. Majerus, D. Tober, K.B. Jensen, and K. Sanders. 2005. Psothyrostachys juncea (Fisch.) Nevski. Plant Database. USDA. Natural Resources Conservation Services. Boise, ID. http://plants.usda.gov/
St. John, L., D.G. Ogle, W. Duckwitz, and D. Tober. 2010. Plant Guide for Altai wildrye (Leymus angustus). USDA. Natural Resources Conservation Service. Aberdeen, ID. http://plants.usda.gov/
Stevens, O.A. 1963. Handbook of North Dakota plants. North Dakota Institute for Regional Studies. Fargo, ND.
Taylor, J.E. 2005. Psothyrostachys juncea. Fire Effects Information System. USDA. Forest Service. http://www.fs.fed.us/database/feis/
Agronomy Research
Emergence and Early Growth of Hard Red Spring Wheat in Acid Soils of Western North Dakota
Victor Gomes1; Chris Augustin2
1Extension Cropping Systems Specialist, Dickinson Research Extension Center
2Director, Dickinson Research Extension Center
victor.gomes@ndsu.edu; 701.456.1102
Introduction
Acidic acres have been increasing in western North Dakota. Decades of nitrogen fertilizer usage paired with slightly acidic soil parent materials and poorly buffered soils has lowered soil pH below 5.5 on many farmable acres. These areas of strong acidity are adversely impacted by reduced nutrient availability, soil microbial activity, and stunted roots from aluminum (Al) toxicity, ultimately causing yield penalties.
While surface liming can improve these acidic areas, lime availability in western North Dakota remains limited. The Sidney (MT) sugar beet processing plant is one of the few local sources and supplies sugar beet waste lime to the region. However, considering the costs of hauling and application, lime remains a scarce and expensive resource, complicating efforts to address soil acidity effectively.
There is a critical need to help farmers identify alternatives to reduce yield losses on acid-affected soils. For wheat farmers, one potential alternative is variety selection. Yield is determined by three main components: plants per acre, seeds per plant, and seed size. Soil acidity can adversely affect all three components. Specifically, wheat seeds, being small, are typically planted at depths within the stratified acidic soil layer (0-3 inches), exposing them to stress early in their development. This stress can impair emergence, early growth, and overall plant stands.
Previous research conducted in Dickinson, Minot and Lefor looked at wheat variety selection in acidic soils (Buetow, 2022). However, these studies did not account the effects of soil pH on wheat plant stands. Additionally, the author of the study noted that drought conditions during the experimental period introduced high variability, preventing reliable recommendations from being drawn from the dataset (Buetow, 2022).
Because producers in North Dakota are not familiar with the need to lime and infrastructure of lime sources and application equipment in the region are in the early stages and considered costly, many are searching for alternative short-term solutions.
This project aims to assess the emergence and early growth of Hard Red Spring Wheat (HRSW) varieties in acidic soils of western North Dakota. By identifying wheat varieties better suited to low soil pH conditions, this research aims to provide short-term solutions for local farmers. The long-term goal is to use the collected data to select the best-performing varieties for future field trials that will also evaluate grain yield and quality.
Material and Methods
The study was conducted in a growth chamber (Conviron GEN1000), under controlled environmental conditions (12 hours of light at 25°C, 12 hours of dark at 20°C) using a completely randomized design with four replications. The assessed varieties were: AP Gunsmoke CL2, Ascend-SD, Brawn-SD, MN Rothsay, MT Carlson, MT Dutton, ND Heron, ND Stampede, ND Thresher, ND Horizon, ND Frohberg, ND Roughrider, and Dagmar. Additionally, the varieties Lanning and SY Soren were included as tolerant and susceptible checks, respectively.
In the spring, acidic soil (pH ≤ 5.5) was collected from a collaborating farmer's field near Lefor, ND. Soil pH characterization was conducted in situ using a Veris Cart (Veris Technologies, Inc., Salina, KS). Soil was collected from areas of the field with the lowest pH according to the map generated by the Veris Cart. Furthermore, soil samples were collected at the 0-3 inch depth and analyzed for chemical and physical attributes.
The acidic soil was then ground and placed in plastic trays and planted with ten seeds of each variety per cell. Due to in field variability, prior to experimental setup the batch of soil used in the study was tested again for soil pH using a portable handheld pH meter (MW802 PRO, Milwaukee Instruments, Rocky Mount, NC). The test indicated pH 4.8 for the batch of soil used in the study.
Daily emergence was assessed and the emergence rate index (ERI) was calculated using the formula:
ERI= (∑(i=1)^k x Ni)/k
Where:
- 𝑘 = Total number of time intervals (e.g., days)
- 𝑁𝑖 = The number of seeds that emerged in the time interval.
At 10 days after planting, final emergence counts were taken.
Four weeks after planting, whole plants (including roots) were hand-harvested and measured for plant height, root length, culm diameter, phenological stage, and fresh weight. Subsequently, wheat was placed in paper bags and dried in a forced-air circulation oven until constant weight, for dry mass calculation.
Data analysis was performed using the software SAS 9.4 (The SAS Foundation, Cary, NC).
Results
Soil analysis results are shown on Table 1.
| Soil Test | ||||||||||||||||
N (Nitrate) | P (Olsen) | K | Cl | S | B | Zn | Fe | Mg | Ca | Na | OM | CCE | Al (Exchangeable) | Soil pH | Buffer pH | |
lb/acre | ppm | ppm | lb/acre | lb/acre | ppm | ppm | ppm | ppm | ppm | ppm | (%) | (%) | ppm | |||
| 0-3" | 12 | 23 | 521 | 2 | 7 | 0.5 | 1.72 | 89.9 | 445 | 1456 | 13 | 6.3 | 0.6 | 2.90 | 5.5 | 6.3 |
Emergence
The emergence rate index (ERI) varied significantly (p < 0.05) among the evaluated HRSW varieties and the variety SD Ascend exhibited the greatest ERI (33.5), indicating the fastest emergence rate (Table 1). A higher ERI reflects a quicker and more uniform emergence, which favors rapid canopy development, improved early-season competition with weeds, and overall better stand establishment.
In contrast, SD Brawn and ND Roughrider recorded the lowest ERI values (17.70 and 13.44, respectively) and where statistically lower than all the other varieties. The lower ERI’s observed for these varieties may suggest a greater susceptibility to acidic soil conditions and potential aluminum toxicity.
Despite Lanning’s known genetic tolerance to aluminum toxicity and low soil pH, it did not outperform the other varieties in terms of ERI, including those that do not carry the TaAlmt1 gene responsible for aluminum tolerance. Fordyce et al. (2020) similarly reported that regionally adapted TaAlmt1 carriers did not outperform adapted noncarriers under field conditions. However, more positive results were observed for Lanning in terms of final emergence, where this variety outperformed the susceptible check and most other varieties.
Final emergence (%) did not differ significantly among varieties, ranging from 80% for ND Roughrider and 100% for SD Ascend. Despite the lack of statistical differences in total emergence, the variation in ERI underscores differences in early seedling vigor and tolerance to acidic soil conditions among the tested varieties.
Table 1. Emergence rate index (ERI) and final emergence rate (%) of 15 wheat varieties grown under acidic soil conditions (pH 4.8). | |||
Variety | Emergence Rate Index | Emergence (%) | |
AP Gunsmoke | 29.58 | AB | 87.5 |
Dagmar | 28.97 | AB | 90.0 |
Lanning (tolerant check) | 25.50 | B | 97.5 |
MN Rothsay | 29.72 | AB | 97.5 |
MT Carlson | 26.70 | AB | 87.5 |
MT Dutton | 28.97 | AB | 95.0 |
ND Frohberg | 24.42 | BC | 92.5 |
ND Heron | 26.43 | AB | 97.5 |
ND Horizon | 29.18 | AB | 97.5 |
ND Roughrider | 13.44 | D | 80.0 |
ND Stampede | 30.69 | AB | 97.5 |
NDThresher | 25.88 | B | 92.5 |
SD Ascend | 33.50 | A | 100.0 |
SD Brawn | 17.70 | CD | 85.0 |
SY Soren (susceptible check) | 31.01 | AB | 90.0 |
Means followed by the same letter within a column are not significantly different according to the least significant difference (LSD) test at 5%.
Early Growth
Among the evaluated hard red spring wheat (HRSW) varieties, only plant height, root length, and root fresh weight varied significantly (p < 0.05) (Table 2). Culm diameter averaged 1.7 mm, tops fresh weight 9.5 g, tops dry matter 1.6 g, root dry matter 2.5 g, and crop growth stage averaged Zadoks 17 across varieties.
Overall, SD Ascend outperformed all other varieties in terms of plant height, root length, and root fresh weight. The superior early growth performance of SD Ascend is consistent with its rapid emergence and likely reflects greater vigor and adaptation to acidic soil conditions.
Aluminum toxicity primarily targets the root apex, where Al exposure inhibits cell elongation and division, resulting in root stunting and impaired water and nutrient uptake (Panda et al., 2009). Consequently, root length is often used as an indicator of Al susceptibility or tolerance. In this study, varieties MT Dutton, ND Frohberg, ND Thresher, and SD Brawn exhibited the shortest roots, suggesting a higher sensitivity to aluminum toxicity. MT Dutton has been described as exhibiting partial/moderate tolerance to aluminum and acidic soils (Cook et al., 2023). However, we observed relatively short root length for MT Dutton under our experimental conditions (pH 4.8), suggesting that its tolerance may be limited under more severe acid stress or may be environment-dependent.
Root fresh weight also differed significantly among varieties (p < 0.05). SD Ascend had the greatest root fresh weight, confirming its superior vigor and ability to maintain active root growth under stress. In contrast, ND Frohberg, ND Thresher, and SD Brawn produced the lowest root fresh weights, consistent with their reduced root length.
Lanning also showed low root fresh weight despite showing intermediate root length. This discrepancy suggests that while Lanning was able to sustain primary root elongation under acidic conditions, its overall root biomass accumulation was limited. Such a response could indicate a reduced development of lateral roots or a lower root tissue density, both of which are common adaptive trade-offs observed in aluminum-tolerant genotypes (Kochian et al., 2015). Aluminum exclusion mechanisms, such as those mediated by the TaALMT1 gene, may protect the root apex but do not necessarily promote biomass accumulation if carbon allocation to roots is constrained under stress. Consequently, Lanning’s moderate elongation combined with lower root mass may reflect a tolerance mechanism centered on maintaining root function rather than vigorous root growth under low pH stress.
Root biomass accumulation represents an integrated response to both root elongation and lateral root proliferation. Varieties able to maintain greater root fresh weight under low pH likely possess more efficient carbon allocation to belowground tissues and enhanced physiological resilience against aluminum-induced growth inhibition. Conversely, reduced root biomass may limit nutrient and water uptake capacity, potentially constraining shoot development and yield potential under field conditions (Ofoe et al., 2023).
The variation observed in root fresh weight complements differences in emergence and early growth, highlighting genetic variability in tolerance to soil acidity and aluminum toxicity among the tested HRSW varieties.
Table 2. Plant height (cm), root length (cm), culm diameter (mm), tops fresh weight (g), root fresh weight (g), root dry matter (g), and crop stage (Zadoks) of 15 wheat varieties grown under acidic soil conditions (pH 4.8). | |||||||||||
| Variety | Plant Height (cm) | Root Length (cm) | Culm Diameter (mm) | Tops Fresh Weight (g) | Root Fresh Weight (g) | Tops Dry Matter (g) | Root Dry Matter (g) | Crop Stage (Zadoks) | |||
| AP Gunsmoke | 7.5 | EF | 11.4 | BC | 1.6 | 9.0 | 9.2 | BC | 1.6 | 2.0 | 17 |
| Dagmar | 7.0 | F | 13.4 | ABC | 1.6 | 8.4 | 8.7 | BC | 1.8 | 1.9 | 18 |
| Lanning (tolerant check) | 8.0 | BCDE | 11.3 | BC | 1.8 | 11.2 | 7.8 | C | 1.7 | 1.9 | 15 |
| MN Rothsay | 7.5 | EF | 12.8 | BC | 1.7 | 8.7 | 11.2 | BC | 1.6 | 2.8 | 17 |
| MT Carlson | 8.1 | BCDE | 12.1 | BC | 1.7 | 9.8 | 9.4 | BC | 1.7 | 2.1 | 16 |
| MT Dutton | 8.5 | BCD | 10.3 | C | 1.8 | 10.4 | 10.1 | BC | 1.8 | 2.8 | 18 |
| ND Frohberg | 8.6 | BCD | 10.3 | C | 1.6 | 9.8 | 8.1 | C | 1.6 | 1.9 | 17 |
| ND Heron | 8.7 | ABC | 11.5 | BC | 1.5 | 8.7 | 8.9 | BC | 1.5 | 2.3 | 15 |
| ND Horizon | 8.3 | BCDE | 14.5 | AB | 1.8 | 10.1 | 13.8 | BC | 2.1 | 3.7 | 16 |
| ND Roughrider | 8.8 | AB | 11.3 | BC | 1.9 | 8.3 | 10.3 | BC | 1.3 | 3.1 | 18 |
| ND Stampede | 8.4 | BCD | 10.8 | BC | 1.6 | 9.1 | 9.8 | BC | 1.5 | 2.7 | 16 |
| ND Thresher | 7.8 | DEF | 9.6 | C | 1.7 | 9.5 | 7.0 | C | 1.5 | 1.6 | 15 |
| SD Ascend | 9.6 | A | 16.9 | A | 1.9 | 12.3 | 19.2 | A | 2.3 | 4.6 | 18 |
| SD Brawn | 7.8 | CDEF | 9.9 | C | 1.6 | 7.8 | 6.6 | C | 1.4 | 2.4 | 17 |
| SY Soren (susceptible check) | 8.1 | BCDE | 10.7 | BC | 2.0 | 9.0 | 8.5 | BC | 1.4 | 2.1 | 16 |
Means followed by the same letter within a column are not significantly different according to the least significant difference (LSD) test at 5%.
Conclusions
- SD Ascend consistently demonstrated superior performance in terms of emergence rate, plant height, root length, and root biomass, indicating strong adaptation and vigor under acidic soil conditions.
- Varieties such as ND Frohberg, ND Thresher, and SD Brawn showed sensitivity to acidic conditions, exhibiting both shorter roots and lower root biomass, implying reduced ability to cope with aluminum stress.
- Variety selection represents a viable short-term management strategy for producers facing acid soils in western North Dakota, offering an immediate alternative while long-term liming solutions remain limited.
- The trial will be repeated one more time to confirm the results, as only one run of the trial is not sufficient to draw impactful conclusions and recommendations.
References
Cook, J., Heo, H., Blake, N., Lile, J., Wong, M., Nash, D., Holen, D., Torrion, J., Larson, D., McVey, K., Khan, Q., Eberly, J., Hammontree, J., Vetch, J., Medina, W., Lamb, P. F., Haney, E., Runner, T., Chen, C., … Kowatch, C. (2023). SPRING WHEAT VARIETY PERFORMANCE SUMMARY IN MONTANA.
Fordyce, S., Jones, C. A., Dahlhausen, S. J., Lachowiec, J., Eberly, J. O., Sherman, J. D., McPhee, K. E., & Carr, P. M. (2020). A simple cultivar suitability index for low-pH agricultural soils. Agricultural & Environmental Letters, 5(1), e20036. https://doi.org/10.1002/ael2.20036
Kochian, L. V., Piñeros, M. A., Liu, J., & Magalhaes, J. V. (2015). Plant Adaptation to Acid Soils: The Molecular Basis for Crop Aluminum Resistance. Annual Review of Plant Biology, 66(Volume 66, 2015), 571–598. https://doi.org/10.1146/annurev-arplant-043014-114822
Ofoe, R., Thomas, R. H., Asiedu, S. K., Wang-Pruski, G., Fofana, B., & Abbey, Lord. (2023). Aluminum in plant: Benefits, toxicity and tolerance mechanisms. Frontiers in Plant Science, 13, 1085998. https://doi.org/10.3389/fpls.2022.1085998
Panda, S. K., Baluska, F., & Matsumoto, H. (2009). Aluminum stress signaling in plants. Plant Signaling & Behavior, 4(7), 592–597. https://doi.org/10.4161/psb.4.7.8903
Acknowledgment
This study was sponsored by the North Dakota Weed Commission
Agronomy Research
Boron Fertilization to Boost Canola Production in Western North Dakota
Victor Gomes
Extension Cropping Systems Specialist Dickinson Research Extension Center
victor.gomes@ndsu.edu; 701.456.1102
Introduction
In recent years, canola acreage has significantly expanded in western North Dakota due to market downturns for small grains and advancements in cultivar traits. However, canola production in North Dakota is significantly impaired by plant nutrient availability, including micronutrients. Boron (B) is a critical nutrient for canola, as the crop is a heavy user of B and is highly sensitive to its deficiency.
Boron deficiency, although rare, typically occurs in sandy areas of fields. This deficiency may be exacerbated by aluminum toxicity to roots, a condition commonly associated with acidic sandy soils—an issue that is becoming increasingly prevalent in western North Dakota. According to AGVISE Laboratories, Inc. (2024), soil samples with soil test boron below 0.4 ppm in 2024 in western North Dakota were between 16-44%.
The current recommendation for boron application in North Dakota is 2 lbs/acre for canola. However, this recommendation is based on data generated in northeast North Dakota, a region characterized by cooler and more humid conditions compared to the semi-arid climate of western North Dakota. While claims of boron fertilization benefits in canola production exist, scientific evidence supporting these claims remains inconclusive, with inconsistent effects observed on yield, protein content, and oil quality.
To address this knowledge gap, the objective of this study is to evaluate the effects of different rates, timings, and modes of boron application on the yield and seed quality of canola in western North Dakota. This research aims to provide region-specific recommendations that optimize canola production and address nutrient management challenges in the area.
Material and Methods
Field experiments were conducted at the Dickinson Research Extension Center and the North Central Research Extension Center (Minot, ND). A randomized complete block design, with four replications was used. Treatments consisted of either three rates of granular B fertilizer (2, 5 and 10 lbs B ac-1) broadcasted after planting, or a foliar B application at 10-20% bloom stage at three different rates (0.25, 0.50 and 1 lbs B ac-1), or the combination of a granular application at planting (1lbs ac-1) and a foliar application at 10-20% bloom (0.25 and 0.50 lbs ac-1) plus a zero B control treatment.
The canola hybrids were InVigor® L345PC in Dickinson and DK400TL in Minot. In both locations, plots were solid seeded with a no-till drill. The seeding rate in Dickinson was 600,000 plants acre-1 and Minot it was 450,000 plants acre-1. Prior to planting, soil samples were pulled from the experimental area for soil chemical and physical analysis. Preference was given for fields deficient in Boron (B < 0.5 ppm).
In Dickinson, all plots received a baseline fertilization with 120 lbs. ac-1 Nitrogen as Urea and 20 lbs. ac-1 Sulfur as ammonium sulfate. In Minot, the plots received 150 lbs. ac-1 N (urea plus Anvol™), 50 lbs. ac-1 Phosphorus (MAP), and 30 lbs. ac-1 Sulfur (ammonium sulfate).
In Dickinson, granular boron at the rate of 0, 1, 2, 5 or 10 lbs B ac-1 was broadcasted immediately after seeding in each corresponding experimental plot. In Minot, those same rates of granular boron were placed in furrow. At 10-20% bloom stage, the remainder of the treatments received a foliar spray of Boron (Solubor®, Sodium Borate 20.5%), at 0.25, 0.50 and 1 lbs B ac-1, using a backpack sprayer.
Each experimental unit measured 10 ft x 30 ft (300 ft2). Local air temperatures and precipitation were quantified using NDAWN weather stations.
At the end of the growing season (after physiological maturity), plants in the central rows of each plot were mechanically harvested and quantified for grain yield, harvest moisture content, test weight, and, seed composition analysis (i.e., seed oil content), due to the importance of seed quality for end users.
Data was analyzed through an analysis of variance using a mixed-model approach (PROC GLIMMIX) in SAS 9.4. Within each site, the fixed factors were be fertilizer rates, timing and modes of application. The random factor was replication.
Results
Soil pH was moderately acidic at Dickinson (5.5) and near neutral at Minot (6.5), which may influence boron availability and uptake (Table 1). Boron concentrations were low and similar between sites (0.35 ppm at Dickinson and 0.44 ppm at Minot). However, boron soil tests are known to be highly variable and often unreliable (Marupaka et al., 2022).
| Site | pH | OM | N (nitrate) |
| K | Ca | Mg | S | Soluble Salts | B | CEC |
P (Olsen) | |||||||||||
% | lbs. ac-1 | ppm | ppm | ppm | ppm | lbs. ac-1 | mmho/cm | ppm | meq | ||
Dickinson (0-6”) | 5.5 | 4.0 | 17 | 19 | 332 | 1685 | 435 | 10 | 0.2 | 0.35 | 23 |
Minot (0-6”) | 6.5 | 3.3 | 10 | 11 | 356 | 2285 | 395 | 7 | 0.2 | 0.44 | 18 |
Both in Dickinson and Minot, a large precipitation (>2 inches) was recorded in the days following canola seeding, which resulted in poor plant establishment. In Dickinson, the plant population was 317,462 plants acre-1, equivalent to 53% of the target plant population.
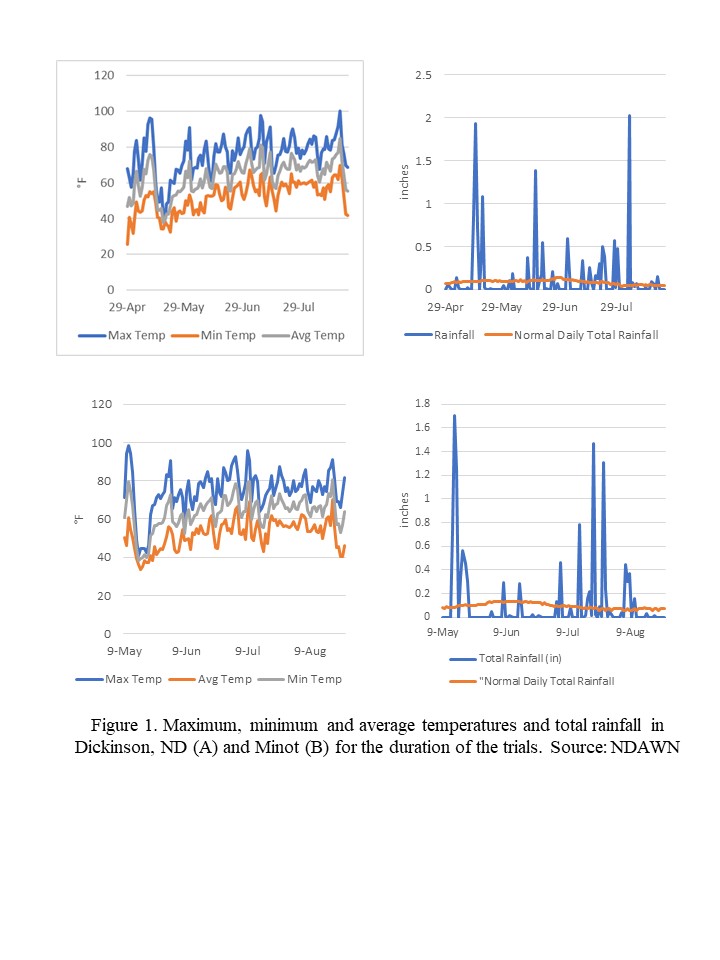
Significant differences in grain yield (p < 0.05) were observed only at the Dickinson site (Table 1). Seed oil content was not significant (p > 0.05) in any of the locations.
Grain yield at Dickinson responded positively to boron fertilization, with treatments producing higher yields than the untreated check. The combination of granular and foliar boron (1 lb/ac granular + 0.25 lb/ac foliar) resulted in the highest yield (2,351 lbs/ac), significantly outperforming the check (25% yield increase). The lowest rate treatment (0.25 lbs/a foliar) still provided a 14% yield increase in Dickinson.
Treatments with either foliar or granular boron alone generally showed intermediate yield gains. This could be due to the fact that canola plants need a steady supply of boron throughout the growing season, and one single application at planting may not be sufficient to meet the crop needs during the reproductive stages, when the plant’s boron demand increases (Ma et al., 2019).
In Minot, while the results were not statistically significant, we could still observe a yield gain trend with the different treatments compared to the control. The treatment consisting of 0.50 lbs B acre-1 had the greatest yield overall (2,448 lbs ac-1), with a 14% increase compared to the control treatment.
Overall, the results suggest that low rates and combined application methods tended to be more effective than single-source applications in enhancing canola yield under the conditions at Dickinson.
| Table 2. Grain yield (lbs ac-1) and seed oil content (%) of canola as a function of different boron fertilizer sources, rates and application timings in Dickinson, ND and Minot, ND (2025). | ||||
Dickinson | Minot | |||
| Treatment | Yield (lbs/ac) | Oil (%) | Yield (lbs/ac) | Oil (%) |
| 1 lb/ac Granular + 0.25 lb/ac Foliar | 2,351 A | 43.1 | 2,405 | 42.2 |
| 1 lb/ac Foliar | 2,296 AB | 43.0 | 2,307 | 42.0 |
| 1 lb/ac Granular + 0.50 lb/ac Foliar | 2,269 AB | 43.0 | 2,412 | 41.9 |
| 0.25 lb/a Foliar | 2,127 ABC | 43.5 | 2,344 | 42.6 |
| 10 lbs/ac Granular | 2,088 BCD | 43.0 | 2,328 | 42.4 |
| 2 lbs/ac Granular | 2,082 BCD | 42.8 | 2,399 | 42.7 |
| 5 lbs/ac Granular | 2,014 CD | 43.2 | 2,337 | 43.7 |
| 0.50 lbs/ac Foliar | 1,957 CD | 43.2 | 2,448 | 42.3 |
| Untreated Check | 1,874 D | 43.2 | 2,153 | 42.7 |
Means followed by the same letter within a column are not significantly different according to the least significant difference (LSD) test at 5%.
Conclusions
- The effects of Boron fertilization in canola yield seem to be positive.
- The combination of a granular B application at planting plus a foliar B application at 10-20% bloom produced the best results.
- This correlation, however, seems to be location dependent.
- Boron sources, rates and timing of application do not affect seed oil content in canola.
- The study will be conducted again next year to confirm the results and to provide more sound recommendations to canola growers.
Acknowledgments
This study was sponsored by the Northern Canola Growers Association.
References
AGVISE Soil Test Summary 2024 Minnesota, North Dakota South Dakota, Manitoba Regional summary of residual soil nitrate after major crops and soil test nutrient levels (2024). Available at: https://www.agvise.com/wp-content/uploads/2024/11/agvise-soil-test-summ…
Ma, B.-L., Zheng, Z., Whalen, J. K., Caldwell, C., Vanasse, A., Pageau, D., Scott, P., Earl, H., & Smith, D. L. (2019). Uptake and nutrient balance of nitrogen, sulfur, and boron for optimal canola production in eastern Canada. Journal of Plant Nutrition and Soil Science, 182(2), 252–264. https://doi.org/10.1002/jpln.201700615
Marupaka, V., Mylavarapu, R. S., Bergeron, J., Smidt, S. J., Hochmuth, G. J., & van Santen, E. (2022). Comparing Boron Soil Testing Methods for Coastal Plain Sandy Soils. Communications in Soil Science and Plant Analysis, 53(12), 1456–1472. https://doi.org/10.1080/00103624.2022.2046041
Managing Soybean Inoculation in Western North Dakota Acidic Soils
Victor Gomes1; Chris Augustin2
1Extension Cropping Systems Specialist, Dickinson Research Extension Center
2Director, Dickinson Research Extension Center
victor.gomes@ndsu.edu; 701.456.1102
Summary:
Soybean production in western North Dakota is challenged by the lack of native Rhizobium populations and increasing soil acidity caused by long term no-till associated with ammonia-based fertilizers. Acidic soils reduce Rhizobium survival, limiting nodulation and nitrogen fixation. This study examines the interaction between soil pH and inoculant type to improve soybean establishment and symbiotic performance under low pH soil conditions.
Objective:
Evaluate the performance of three commercial soybean inoculants under varying soil pH conditions to identify Rhizobium strains most tolerant to acidity and suitable for western North Dakota soils.
Methods:
Soybean variety ND17009GT was grown in 1-gallon pots under controlled conditions in a growth chamber simulating early-season weather in Stark County. Seeds received one of three inoculant treatments:
- Granular: LAL FIX Start (B. elkanii)
- Liquid: BYSI-N (B. japonicum)
- Peat: N-Charge Soybean (B. japonicum)
A non-inoculated control was also included.
In the spring, soil from a collaborating farmer field was collected. Soil pH was 5.1. The soil was placed in 1-gallon pots and adjusted to four pH levels (4.7, 5.1, 5.5, 6.0) using either aluminum sulfate to acidify the soil or pelletized lime to increase the soil pH. Emergence, nodulation, and early growth traits were evaluated.
Results
Emergence rate and final emergence were influenced by both inoculant and pH, though not their interaction (Table 1). Inoculated treatments had higher emergence (>85%) than the control (77%). Slightly acidic soils (pH 5.1–5.5) favored faster and more uniform emergence compared to strongly acidic (pH 4.7) or neutral (pH 6.0) soils.
| Table 1. Emergence rate index and final emergence of soybean as a function of inoculant products and soil pH. | |||||||
Inoculant | Emergence Rate Index | pH | Emergence Rate Index | Inoculant | Final Emergence (%) | pH | Final Emergence (%) |
| Granular | 52.71 A | 4.7 | 43.29 B | Granular | 93 A | 4.7 | 81 C |
| Liquid | 48.54 A | 5.1 | 51.87 A | Peat | 90 A | 5.1 | 93 A |
| Peat | 48.43 A | 5.5 | 51.79 A | Liquid | 87 A | 5.5 | 90 AB |
| UTC | 43.12 B | 6 | 45.86 B | UTC | 77 B | 6 | 83 BC |
Means followed by the same letter within a column are not significantly different according to the least significant difference (LSD) test at 5%.
Soybean early growth was influenced by soil acidity only (Table 2). Plants at pH 4.7 were elongated (etiolated) and had thinner stems, indicating stress and possible aluminum toxicity.
| Table 2. Plant height and stem diameter of soybean as a function of soil pH. | |||
| pH | Plant Height (cm) | Stem Diameter (mm) | |
| 4.7 | 24.85 A | 2.81 B | |
| 5.5 | 21.94 AB | 3.15 A | |
| 5.1 | 21.83 AB | 3.12 A | |
| 6.0 | 19.05 C | 3.24 A | |
Means followed by the same letter within a column are not significantly different according to the least significant difference (LSD) test at 5%.
The number of nodules per plant and the weight of nodules per plant varied significantly as a function of the interaction between inoculants and pH levels (p < 0.05) (Table 4). Overall, it was observed that the granular inoculant produced the greatest number of nodules per plant, followed by the liquid inoculant. Statistically, the peat inoculant was similar to the untreated check in terms of number of nodules.
One possible reason for the superior performance of the granular inoculant is the presence of Bacillus velezensis in its formulation. B. velezensis is known to promote phosphorus (P) solubilization, increasing the amount of plant-available P in the soil solution. In acidic soils, aluminum (Al³⁺) readily reacts with phosphate ions, forming insoluble aluminum phosphates and thereby reducing P availability to plants. By solubilizing P, B. velezensis may indirectly mitigate Al toxicity’s suppression of root growth and nodule formation. This mechanism may help explain the greater nodule numbers observed with the granular inoculant.
Support for this mechanism is found in the work of Buetow (2022), who reported that in furrow-applied phosphorus trials on acid-affected soils (pH < 5.5) in western North Dakota, adding P improved yield responses in a susceptible hard red spring wheat variety, suggesting P availability can alleviate some of the constraints imposed by low pH and Al toxicity. Similarly, a report from Oklahoma State University showed that in acid Oklahoma soils (pH < 5.5) banding P fertilizer significantly reduced Al toxicity and improved root performance in winter wheat.
In terms of weight of nodules, it was observed a linear growth for the granular inoculant that followed the pH increase. For the liquid inoculant, the weight of nodules at pH 5.1 was the greatest across all treatments. The peat inoculant had low nodule weight, being for the most part similar to the untreated check.
| Table 3. Number and weight of nodules per plant as a function of inoculant and soil pH. | |||||
Inoculant | pH | Number of nodules per plant | Weight of nodules per plant (g) | ||
Granular | 4.7 | 3.87 | D | 0.0344 | CDE |
5.1 | 19.47 | A | 0.0825 | BCD | |
5.5 | 15.20 | B | 0.0964 | BC | |
6.0 | 19.33 | A | 0.1030 | B | |
Liquid | 4.7 | 0.20 | DE | 0.0023 | E |
5.1 | 10.00 | C | 0.1711 | A | |
5.5 | 8.67 | C | 0.0788 | BCD | |
6.0 | 2.93 | DE | 0.0302 | DE | |
Peat | 4.7 | 0.00 | E | 0.0000 | E |
5.1 | 2.07 | DE | 0.0361 | CDE | |
5.5 | 1.40 | DE | 0.0058 | E | |
6.0 | 0.73 | DE | 0.0125 | DE | |
UTC | 4.7 | 0.07 | E | 0.0005 | E |
5.1 | 0.47 | DE | 0.0063 | E | |
5.5 | 0.47 | DE | 0.0038 | E | |
6.0 | 0.52 | DE | 0.0094 | DE | |
UTC | 4.7 | 0.07 | E | 0.0005 | E |
5.1 | 0.47 | DE | 0.0063 | E | |
5.5 | 0.47 | DE | 0.0038 | E | |
6.0 | 0.52 | DE | 0.0094 | DE |
Means followed by the same letter within a column are not significantly different according to the least significant difference (LSD) test at 5%.
Conclusions
- Inoculant type and soil pH significantly affect soybean emergence and nodulation.
- The granular inoculant (B. elkanii) performed best in acidic soils, producing more nodules.
- Extremely acidic conditions (pH 4.7) impaired plant growth, suggesting aluminum toxicity.
- Slightly acidic soils (pH 5.1–5.5) supported better plant emergence.
- A second experimental run is underway to confirm these results before developing grower recommendations.
Acknowledgements
This study was sponsored by the North Dakota Soybean Council.
References
Arnall, B. (2014). Phosphorus fertilizer protects roots from aluminum toxicity in acid Oklahoma soils. Oklahoma State University Extension Newsletter.
Buetow, R. (2022). Dickinson REC tackles regional soil acidity. North Dakota State University Newsletter.
Sulfur Fertilizer for Spring Canola Production in Western North Dakota-Year 3
Krishna Katuwal
Research Agronomist
Dickinson Research Extension Center
Introduction
Sulfur is the fourth key macronutrient for crop growth after nitrogen, phosphorus, and potassium. It is a component of the amino acids cysteine and methionine which are fundamental building blocks of proteins and enzymes, and supports chlorophyll synthesis and enhances plant tolerance to both biotic and abiotic stressors. Sulfur also activates enzymes such as acetyl-CoA carboxylase, contributing to oil formation in oilseed crops like canola through its role in lipid metabolism. NDSU currently recommends applying 20 lb/ac of sulfur for canola production in areas south and west of the Missouri Coteau in North Dakota (Franzen, 2017; Franzen and Grant, 2008). However, these guidelines are derived from older studies conducted north and east of the Coteau, where conditions are cooler and wetter. As canola acreage expands in southwest North Dakota, updated region-specific sulfur recommendations are needed. This project aims to (1) evaluate the effects of various sulfur fertilizer sources and application rates on spring canola yield and quality in western North Dakota, and (2) assess how these sulfur sources and rates interact with different nitrogen management strategies to influence spring canola performance in the region.
Materials and Methods
This project represents the third year (2025) of a trial initiated in 2023. Research was carried out at three locations across southwest North Dakota: Dickinson, Minot and Hettinger. Canola was solid-seeded in May, and all treatments were broadcast immediately after planting. The study included three different treatments. The first was sulfur fertilizer source, consisting of ammonium sulfate, gypsum and elemental sulfur. The second treatment was sulfur application rate: 0, 10, 20 and 30 lb S/ac. The third was nitrogen application rate: 0, 100 and 150 lb N/ac. Nitrogen rate of 0 lb/ac received nitrogen equivalent to 30 lb/ac of ammonium sulfate supplemented with urea. All treatments were replicated four times, with individual plot dimensions of 30 × 10 ft in Dickinson and Minot, and 22 × 5.33 ft in Hettinger. Our experimental design was randomized complete block design with a split-split-plot arrangement. At physiological maturity, the center 5 ft strip of each plot was harvested with a plot combine to measure seed yield and oil content. Seed moisture and test weight were determined using a commercial grain tester, and yields were adjusted to the standard 8.5% moisture content.
Results
This year’s results revealed a significant three-way interaction among sulfur source, sulfur rate and nitrogen rate. For ammonium sulfate, applying 20 lb/ac of sulfur ranked the top for seed yields in two out of three nitrogen levels (Fig. 1). In gypsum and elemental sulfur treatments, the 20 lb/ac sulfur rate again ranked the highest in two of the three nitrogen rates tested. While being 10 lb lower than 30 lb/ac rate, 20 lb/ac sulfur still produced mostly similar to or even outyielded 30 lb/ac rate in some cases. When comparing different sources, ammonium sulfate either outyielded or produced similar yield to gypsum and elemental sulfur.
Conclusions and recommendations to producers
Across three years of continuous research on sulfur fertilizer management in canola, we found that applying 20 lb/ac of sulfur together with adequate nitrogen consistently maximized canola production in western North Dakota. Ammonium sulfate yielded higher seed production than gypsum or elemental sulfur. Based on these results, producers are encouraged to apply 20 lb/ac of sulfur as ammonium sulfate when broadcasting fertilizer in the spring prior to planting. Additional studies comparing spring versus fall application timings are still needed to develop stronger region-specific sulfur recommendations for canola in western North Dakota.
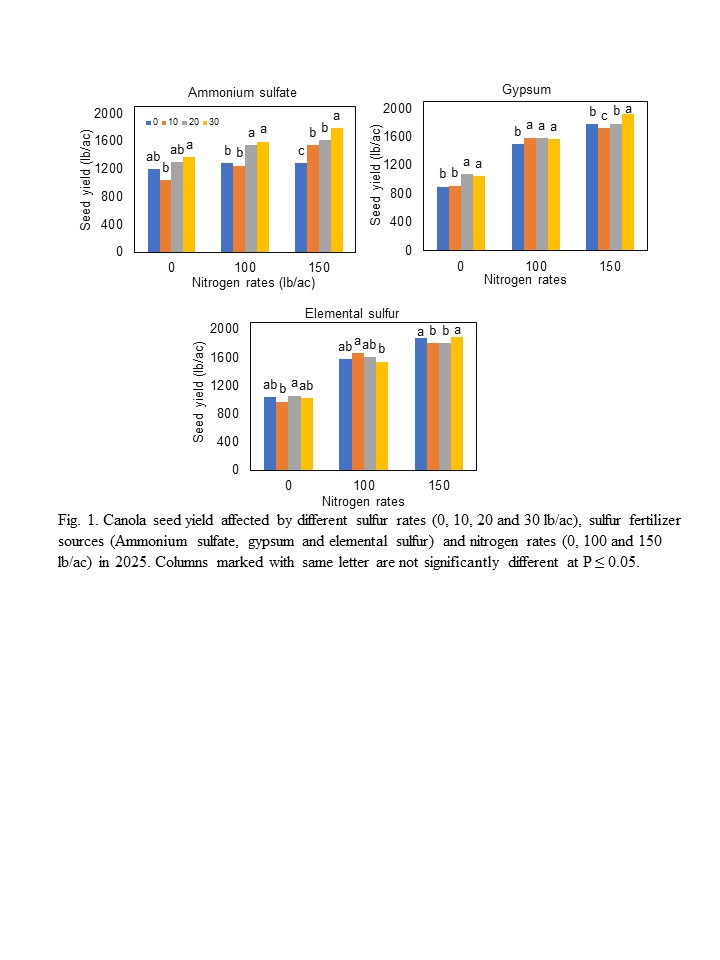
Sulfur Fertilizer for Spring Wheat Production in Western North Dakota-Year 3
Krishna Katuwal
Research Agronomist
Dickinson Research Extension Center
Introduction
Sulfur fertilization has gained increasing attention as sulfur deficiencies become more frequent across western North Dakota. Although plants require sulfur in relatively small amounts, it is essential for chlorophyll formation and overall growth. Historically, soils supplied most of the sulfur needed by crops, but sulfur availability is strongly influenced by environmental conditions that control mineralization. As a result, sulfur deficiencies have become more common, especially in sandy soils or soils with less than 2% organic matter, which often respond to sulfur fertilizer application (Franzen and Grant, 2008). Managing sulfur can be challenging. Sulfate-based fertilizers such as ammonium sulfate are generally the most dependable sources because they are immediately plant available. In contrast, elemental sulfur requires biological oxidation before becoming available, a process that may be too slow to meet the early-season demands of short-season crops like wheat. To address the limited information on sulfur requirements for hard red spring wheat in western North Dakota, this project aims to (1) evaluate the effects of various sulfur fertilizer sources and application rates on spring wheat yield and quality in western North Dakota, and (2) assess how these sulfur sources and rates interact with different nitrogen management strategies to influence spring wheat performance in the region.
Materials and Methods
This research has been conducted at three different locations in western North Dakota: Dickinson, Minot, and Hettinger since 2023. In 2025 trial, spring wheat was planted at 1.1 million pure live seeds/ac in early May, and all fertilizer treatments were broadcast immediately after planting. The study evaluated three fertilizer treatments: (1) sulfur sources (ammonium sulfate, gypsum and elemental sulfur); (2) sulfur application rates (0, 5, 10, 15 and 20 lb S/ac); and (3) nitrogen application rates (0 and 125 lb N/ac). The 0 lb N/ac treatment received nitrogen equivalent to 30 lb/ac of ammonium sulfate, supplemented with urea to balance N levels. Treatments were arranged in a randomized complete block design with a split-split-plot structure and four replications. Plot sizes were 30 × 10 ft in Dickinson and Minot, and 22 × 5.33 ft in Hettinger. At physiological maturity, the center 5 ft of each plot was harvested using a plot combine to measure seed yield and protein content. Seed moisture and test weight were determined with a commercial grain tester, and grain yield was adjusted to the standard 13.5% moisture.
Results
Our results in 2025 trial showed that 15 and 20 lb/ac sulfur produced the top spring wheat seed yield when ammonium sulfate was used as sulfur source (Fig. 1). When gypsum was used, again 15 lb/ac was one of the top seed yield producing sulfur rate particularly when no nitrogen was applied. With 125 lb/ac nitrogen application, no difference was observed for seed yield among different sulfur rates when gypsum was used as a sulfur source. Similarly, no differences were observed among different sulfur rates when applying elemental sulfur as sulfur source in both 0 and 125 lb/ac nitrogen rates.
Conclusions and recommendations to producers
With continuous three years of research on sulfur fertilizer management in spring wheat, we found that 15 lb/ac sulfur with ammonium sulfate as a sulfur source improves spring wheat yield in western North Dakota. When broadcasting sulfur fertilizer in spring before planting, producers are encouraged to apply ammonium sulfate as sulfur source as no yield gains were consistently observed with other sources such as gypsum and elemental sulfur. Yield gains with ammonium sulfate sulfur fertilizer application may be limited when weather becomes severe like extreme drought and heat. Additional research comparing spring versus fall application timings are still needed to develop stronger region-specific sulfur recommendations for spring wheat in western North Dakota.
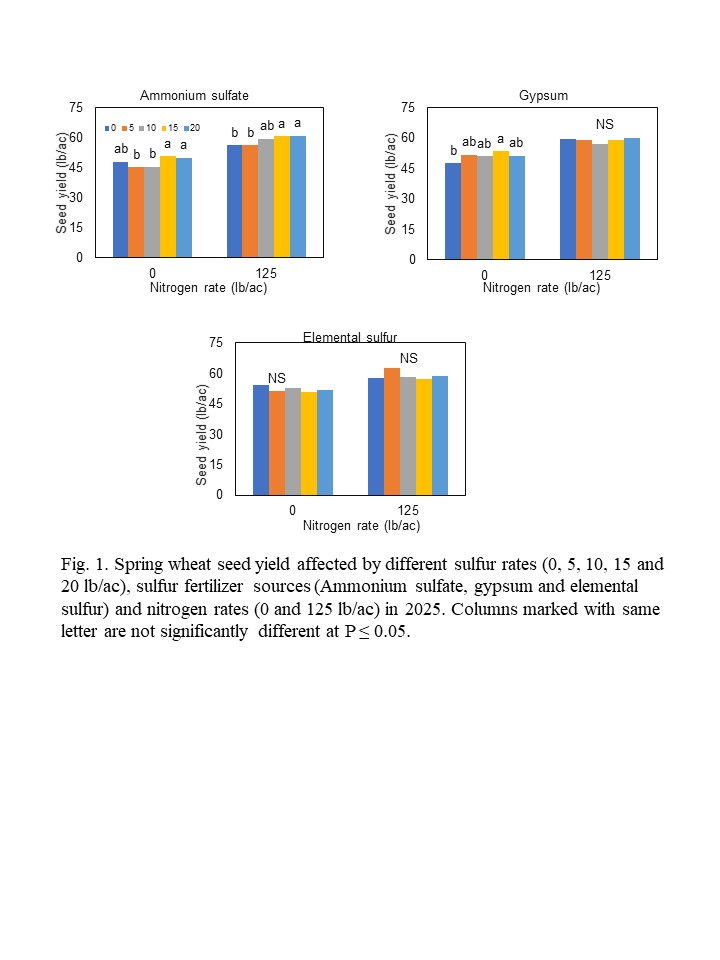
Reference
Franzen, D.W., and C.A. Grant. 2008. Sulfur response based on crop, source, and landscape position. Agron. Mono. pg. 105-116. Am. Soc. Agron. Madison, WI. DOI:10.2134/agormonogr50
Acknowledgements: We would like to thank North Dakota Wheat Commission for funding support and entire research crew for help.
Soil Amendments and Inoculum to Improve Corn Production Under Soil Acidity and No-Till Dryland System in Western North Dakota
Sudip Bhuwaji Chhetri and Krishna Katuwal
Dickinson Research Extension Center
Introduction
Dryland corn production is steadily expanding in the semi-arid western region of North Dakota due to the availability of early-maturing hybrids and widespread adoption of no-till systems. Corn helps diversify small-grain–dominated rotations and supports long-term soil health and pest management. However, precipitation in this region is low and highly variable, making drought a recurring challenge. In 2023, nearly 20% of corn acres in North Dakota were affected by moderate to exceptional drought, with the greatest impact occurring in the west (USDA-NASS, 2023). Because this region is semi-arid, moderate drought events occur periodically, and in 2025 the crop experienced combined moisture stress and soil-acidity stress.
A growing concern in no-till dryland corn systems is the accumulation of surface soil acidity due to long-term use of ammonium-based nitrogen fertilizers without soil mixing. Corn is moderately sensitive to low pH, and increased acidity can intensify drought effects by restricting nutrient availability, reducing root growth, and limiting water uptake. Soil amendments such as biochar, lime, and arbuscular mycorrhizal fungi (AMF) inoculum have the potential to alleviate acidity and improve soil water retention and nutrient uptake. Biochar can enhance cation exchange capacity and moisture storage, lime supplies base cations that neutralize acidity, and AMF increases effective root area and improves nutrient and water acquisition. When combined, these amendments may offer complementary or synergistic benefits that help corn tolerate the combined stresses of acidity and moisture limitation.
The objective of this study was to evaluate the effects of single and combined applications of lime, biochar, and AMF inoculum on corn growth and yield under no-till dryland conditions at the Dickinson Research Extension Center (DREC) in western North Dakota.
Materials and Methods
Field Operations and Treatments
This field experiment was conducted at the Dickinson Research Extension Center, North Dakota, in 2025 under no-till dryland conditions. Eight soil-amendment treatments were evaluated in a Randomized Complete Block Design (RCBD) with four replications. Each plot measured 30 ft × 10 ft. The treatments included AMF, AMF + Biochar, Biochar, Control (no amendment), Lime, Lime + AMF, Lime + AMF + Biochar, and Lime + Biochar.
Field operations began with application of pelletized lime at 6.9 tons/acre, a commercial AMF inoculant containing 300 propagules g⁻¹ of Rhizophagus intraradices applied at 8 lb/acre, and commercial biochar applied at 1% of soil weight in the surface 6-inch layer (Genesis Biochar). Biochar was split-applied before planting this year. A mixture of all three amendments at their single rates and a no-amendment control were also included.
Biochar and lime were applied on April 30, 2025, followed by pre-emergence herbicide application. Urea fertilizer was applied at 190 lb N/acre on May 1, and corn was planted on May 8 targeting ~40,000 plants/acre (≈292 seeds per 300 ft², assuming 95% germination).
Data Collection and Analysis
Three subsamples were collected from each plot to assess plant growth. Leaf Area Index (LAI) was measured on September 9, 2025. Grain weight (lb) and moisture (%) were recorded on October 10, 2025, and grain yields were adjusted to the standard corn moisture content of 15.5% following established procedures (Hicks & Thomison, 2020). The moisture-adjusted yields were then converted to bushels per acre (bu/acre) by dividing the values (lb/acre) by 56, the standard test weight for corn at 15.5% moisture.
Statistical analysis was conducted using ANOVA for RCBD, and treatment means were separated using Fisher’s LSD at α = 0.05. All analyses and graphing were performed in RStudio version 4.5.1, and results are reported as mean ± standard deviation (SD).
Results
Leaf Area Index (LAI)
LAI showed significant treatment effects (P < 0.05). From figure 1, AMF alone (Treatment A) produced the highest LAI (0.62), significantly greater than most other treatments. Treatments with combined lime, biochar, and AMF generally produced intermediate LAI values. The lowest LAI values were observed in AMF+Biochar (B) and Control (D), indicating that AMF effectiveness may be influenced by amendment combinations.
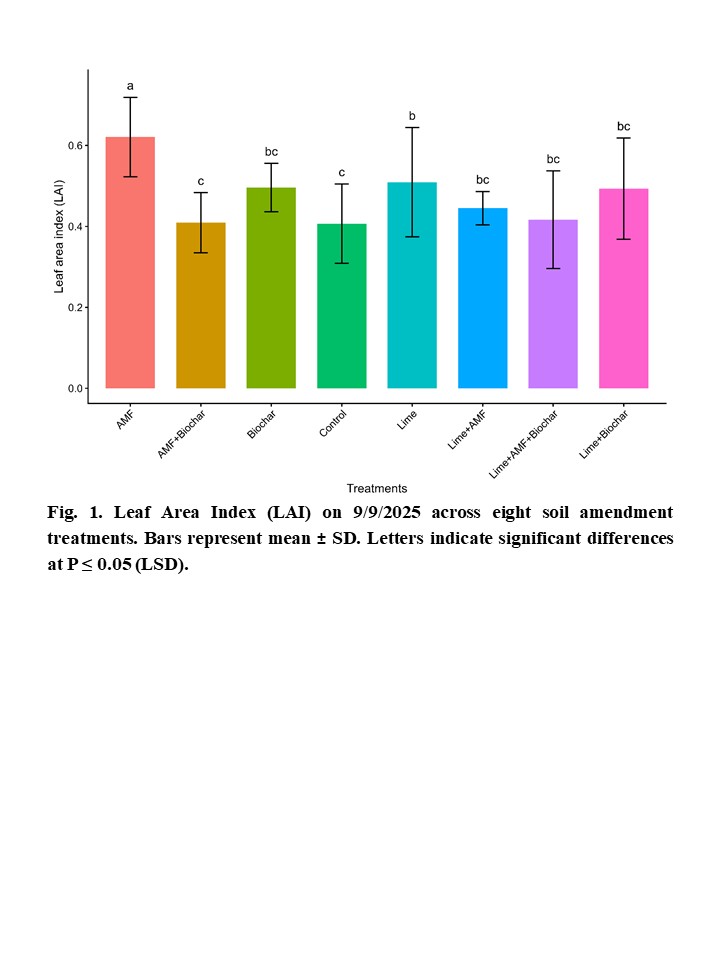
Grain Yield (Bu/acre)
Yield response differed significantly among treatments (Fig. 2). The Lime + AMF + Biochar treatment produced the highest yield at ≈142 bu/acre, followed closely by Lime + AMF and Lime, which also showed relatively high yields (≈135–138 bu/acre). In contrast, Control and Lime + Biochar resulted in the lowest yields (≈122–128 bu/acre).
Overall, treatments that included lime—especially when combined with AMF—tended to improve corn productivity under dryland acidic soil conditions.
ANOVA detected a statistically significant treatment effect on grain yield (P = 0.0217). Based on Fisher’s LSD (α = 0.05), the Lime + AMF + Biochar treatment was significantly higher than Lime + Biochar and AMF + Biochar, whereas most other treatments were statistically similar.
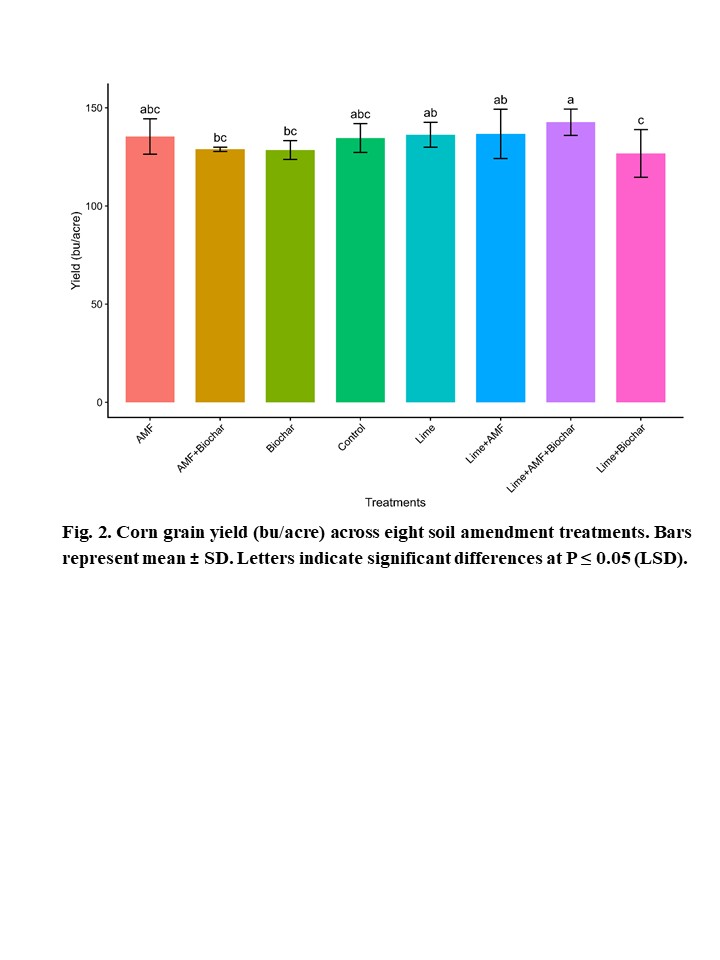
Conclusion
The 2025 dryland corn trial at DREC showed measurable effects of soil amendments and AMF inoculation on plant growth and yield. AMF alone significantly increased LAI, indicating enhanced vegetative growth. For yield, lime-containing treatments—particularly Lime + AMF + Biochar—consistently produced superior performance. These results suggest that combining lime and AMF may help mitigate surface soil acidity commonly observed under long-term no-till and ammonium-based fertilization, thereby improving corn performance under moisture-limited conditions.
However, year-to-year variability and environmental interactions are expected in dryland systems. Additional multi-year data will strengthen conclusions and support development of region-specific soil amendment recommendations for improving dryland corn productivity in western North Dakota.
References
Hicks, D. R., & Thomison, P. R. (2020). Procedure for calculating grain yields of agronomic crops. Ohio State University Extension.
USDA National Agricultural Statistics Service. (2023). Crop progress & condition reports and drought impact summaries. U.S. Department of Agriculture.
Livestock Research
Integrated Crop-Livestock System Research Publications: Past, Present and Future
Douglas Landblom
Long-term integrated crop-livestock system research was initiated in 2010 when winter triticale/hairy vetch was planted following spring wheat harvest. All other crops in the diverse crop rotation were planted the following spring 2011. Experimentally, spring wheat grown continuously year-after-year in the same experimental fields served as the control (HRSW-CTL) and was compared to spring wheat grown in a five-crop rotation (HRSW-ROT). The diverse rotation consisted of spring wheat, dual cover crop (fall seeded winter triticale-hairy vetch harvested for hay followed by planting a multi-specie cover crop), forage corn, field pea-forage barley mix, and sunflower. Beef cattle steers were used as the grazing animal for the earlier grazing research projects and later grazing research evaluated replacement heifer pregnancy using fixed-time artificial insemination comparing heifers in confinement to heifers grazing integrated system forages.
Past Publications:
Songul Senturklu, Douglas G. Landblom, Robert Maddock, Tim Petry, Cheryl J. Wachenheim, and Steve I. Paisley. Effect of yearling steer sequence grazing of perennial and annual forages in an integrated crop and livestock system on grazing performance, delayed feedlot entry, finishing performance, carcass measurements, and systems economics. J. Anim. Sci. 2018. 96:2204-2218. https://doi.org/10.1093/jas/sky150.
Songul Senturklu, Douglas Landblom, Steven Paisley, Cheryl Wachenheim, and Robert Maddock. Frame score, grazing and delayed feedlot entry effect on performance and economics of beef steers from small- and large-framed cows in an integrated crop-livestock system. Animals 2021, 11, 3270. https://doi.org/10.3390/ani11113270.
Songul Senturklu, Douglas Landblom, and Steve Paisley. Effect of bale grazing following annual forage grazing on steer grazing and feedlot performance, muscling ratio, carcass measurements, and carcass value. In Dickinson Research Extension Center 2019 Annual Report.
Abstract:
Ninety-six yearling steers of similar frame score were randomly assigned to an extended grazing study to compare grazing native range (NR) or a sequence of NR and annual forages (ANN: field pea-barley, corn, cover crop) to evaluate the effect of further extending the grazing season feeding cover crop bales (bale grazing) on steer performance and economics. At the end of bale grazing, the steers were finished at the University of Wyoming, Sustainable Agriculture Research and Extension Center (SAREC), Lingle, Wyoming, and slaughtered at the Cargill Meat Solutions plant, Ft. Morgan, Colorado. Compared to previous research, bale grazing cover crop bales extended the grazing season from 180 days to an average 218.5 days. Forage sequence grazing combined with cover crop bale grazing supported ADG of 2.13 lb/day for steers that grazed a combination of NR and ANN forage compared to 1.74 lb/day for steers that grazed NR for the entire period (P = 0.01). The ANN steers were 87.2 lbs. heavier at the end of grazing (P = 0.001). For comparison, animal muscling is expressed as the ratio of hot carcass weight (HCW) per 100 pounds to square inches of ribeye area measured between the 12th and 13th ribs. Steers that grazed NR had greater ribeye area per 100 pounds of carcass weight than ANN (REA:CWT = NR 0.91; ANN 0.88, P = 0.04); however, ANN steer percent intramuscular fat (IMF) was greater (P = 0.01), but ANN system marbling score did not differ. One of the research questions addressed in this investigation was to determine the effect of extended NR and ANN for grazing on subsequent steer finishing performance (Table 2) and carcass measurements (Table 4). Steers that grazed the sequence of NR and ANN forage grew at a faster rate of gain and ended the grazing season heavier (P = 0.01) than the NR steers. Entering the feedlot heavier, the ANN steer growth was numerically slower than the NR steers (P = 0.30); however, the ANN steer shrunk ending weight was 63 pounds heavier at the end of the finishing period. For carcass measurements (Table 4), ANN steer HCW averaged 49.0 lbs. heavier than NR steers, but did not differ (P = 0.11). Carcass yield expressed as dressing percent (P = 0.01) and USDA Yield Grade (P = 0.01) were greater for the ANN steers. Nonetheless, the REA:HCW ratio was greater for the NR steers (P = 0.02). The two-year carcass quality grade was 97.9% Choice or better. Gross carcass value for the NR and ANN steers was nearly the same after two years ($1,959.88 vs. 2,019.86). By the end of the finishing period, ending weight margins did not change appreciably from starting weight margins resulting in gross carcass returns that were. Weight margins among groups entering the feedlot do not change appreciably by the end of the finishing period and gross carcass value is routinely greater and more profitable for steers grazing ANN forages before feedlot entry compared to NR.
Current Publication:
Songul Senturklu, Douglas Landblom, Larry Cihacek. Effect of long-term integrated multi-crop rotation and cattle grazing on no-till hard red spring wheat (Triticum aestivum L.) production, soil health, and economics. Manuscript submitted to Agriculture 2025 for Open Access. The manuscript is currently being reviewed.
Abstract:
A long-term 12-year integrated systems study evaluated spring wheat grown (HRSW-CTRL) continuously on the same land resource when compared to spring wheat (HRSW-ROT) grown in a five-crop rotation: 1) spring wheat, 2) 7-specie cover crop, 3) forage corn, 4) field pea/forage barley mix, and 5) sunflower. Yearling beef cattle steers grazed the field pea/forage barley mix, unharvested corn, and 7-specie cover crop. Spring wheat and sunflowers were marketed as cash crops. The hypothesis was that the supply of nitrogen (N) and crop nutrients from multiple sources (legumes, livestock manure, and decaying roots) would result in similar grain and oilseed yields, but greater net return due to lower input expenses. Twelve-year spring wheat yield was numerically greater for the rotation (ROT) yield (10.75 vs. 11.41 Mt Ha-1, P=0.15), similar for test weight (136.55 vs. 135.70 kg, P=0.62), and greater percent protein (12.94 vs. 13.18%, P=0.18), however, differences were not significant. Economically, HRSW-ROT input cost Ha-1 was less (p = <0.001), however, gross return Ha-1 (p = 0.55) and net return Ha-1 (p= 0.43) were numerically greater, but not significantly greater. Although, nearly all criterion measured were numerically greater for the HRSW-ROT, annual variability (p = <0.001) resulted in no significant difference between the two production management methods.
Future Publications:
Songul Senturklu and Douglas Landblom. Effect of reducing beef cow wintering expense grazing cover crop, corn, and sunflower residues, and stockpiled tame grass pastures on calving performance and economics. The manuscript is being prepared and will be submitted to Agriculture for Open Access early 2026.
Douglas Landblom, Songul Senturklu, Lauren Hanna, Byron Parman, George A. Perry, Steve Paisley. Effect of non-traditional beef heifer management on fixed-time AI and delayed feedlot entry of non-pregnant heifers. The manuscript will be prepared and submitted to Animals in early 2026.
Drought Effects on Soil Microbial Activity, pH and Plant Nutrient Activity
Douglas Landblom, Songul Senturklu, and Larry Cihacek
1Dickinson Research Extension Center, North Dakota State University, Dickinson, ND
2Canakkale Onsekiz Mart Universiteis, Canakkale, Turkey
3School of Natural Resource Sciences, North Dakota State University, Fargo, ND
Abstract
Drought negatively impacts soil pH, microbial biomass, and soil derived nutrients. Long-term integrated crop, beef, and soil health research at the Dickinson Research Extension Center is designed around a no-till diverse multi-crop rotation (spring wheat, cover crop, corn, pea-barley, sunflower). In the study, beef cattle graze pea-barley, corn, and a 13-specie cover crop to document microbial, fungal, and nutrient change. Precipitation during years 1-5 were normal to slightly above normal. Years 6-10 were drier than normal. Reduced precipitation contributed to reduced SOM content and nitrogen mineralization. For most of the rotation crops, the percent of microbial active carbon, organic C:N ratio, and organic N:inorganic N ratio declined. Ward Lab Haney Test results for 24-hour microbial respiration provide measurements of microbial community and organismal diversity. Mean microbial biomass under drought conditions (2017), in the crop rotation, was 1,637 ng/g of soil. Return to normal precipitation (2019) soil microbial biomass was 4,804 ng/g of soil; a 193.5% increase. With return to precipitation in 2019, mycorrhizal fungi (AMF) did not re-establish among the crops due to excessive precipitation (8-10 in.) during Aug-Sept of 2019. At pH levels less than 5 (strongly acidic), aluminum availability becomes toxic to plants. Drought effected soil pH in this integrated systems research declined 9.5% to a mean crop pH value of 5.95, which at this pH level aluminum is sufficiently hydrated to be non-toxic. Return to normal precipitation (2019) increased the crop rotation pH mean to 6.58.
Introduction
Drought resulting from extended periods of limited precipitation have a substantial impact on soil pH, microbial biomass, and soil derived nutrients for plant growth. A long-term integrated crop, beef, and soil health research project at the Dickinson Research Extension Center is designed around a no-till diverse multi-crop rotation (spring wheat, cover crop, corn, pea-barley, sunflower). In this crop and animal production system, beef cattle graze the pea-barley, corn, and 13-specie cover crop to document microbial, fungal, and nutrient change over time and space. Precipitation during the first five-year crop rotation was normal to slightly above normal. However, the second five-year rotation was drier than normal resulting in nutrient concentration, reduced microbial biomass, and pH decline.
Discussion
The 2016-2020 diverse crop rotation was drier than normal resulting in soil nutrient concentration, reduced microbial and fungal biomass, and pH decline. Potential nitrogen mineralization of soil organic matter (SOM) in the crop rotation suggests that 8.4 mg N/kg of soil are mineralized for each 1.0% increase in SOM. The mean SOM content of soils in the study is 3.97%.
- Periods of reduced precipitation inhibit soil nutrient solubilization and translocation: negatively impacting soil microbial respiration, fungal activity, plant nutrient supply, crop yield, and animal grazing days.
- With drying, soil pH declined as soluble salt became more concentrated resulting in a more acidic soil condition.
- Reduced precipitation contributes to minimized plant and root growth, reduced SOM content and nitrogen mineralization.
- For most of the crops in the diverse crop rotation, the percent of microbial active carbon, organic C:N ratio, and organic N:inorganic N ratios declined.
- 24-hour microbial respiration (Haney Test) provided measurements of microbial community and organismal diversity.
- Mean drought microbial biomass (2017) was 1,637 ng/g of soil.
- Microbial biomass with normal precipitation (2019) was 4,804 ng/g of soil; a 193.5% increase.
- Arbuscular Mycorrhizal fungi (AMF) did not re-establish among the crops due to excessive precipitation (8-10 in.) during Aug-Sept of 2019.
- Declining soil pH approaching 5 or less reduces copper, manganese, zinc, and aluminum availability. At pH levels less than 5 (strongly acidic), unhydrated aluminum(Al3+) is toxic to plants.
- Mean drought effected soil pH declined 9.5% to a mean crop pH value of 5.95, which at this pH level aluminum is sufficiently hydrated to be non-toxic.
- Normal precipitation (2019) increased the crop rotation pH mean to 6.58.
- Sunflower and corn have the potential to bring cations to the soil surface to support pH buffering.
Extending the Breeding Season: Managing for Increased Profit
Douglas Landblom1 and Songul Senturklu1,2
1Dickinson Research Extension Center, North Dakota State University, Dickinson, ND
2Department of Animal Science, Canakkale Onsekiz Mart University, Canakkale, Turkey
Profitability drivers in the beef cattle industry can be partitioned into several categories some of which include breeding/crossbreeding, feed resources, calving date/weaning date, and the impact modifying the breeding season length can have on potential profit. Good breeding management defines a specific date to begin breeding heifers and cows and a specific date to end the breeding period. Common breeding season lengths range from 45- to 60-days. Removing herd sires from breeding groups on a predetermined date results in late cycling cows being identified as “open” or not pregnant.
Ultrasound is powerful technology available for pregnancy determination by the local veterinarian. Because ultrasound technology is readily available, there is no reason to remove bulls at a predetermined time. Leaving herd sires with cows for an extended period of time followed by ultrasound pregnancy determination allows the producer to identify late calving cows that are pregnant instead of being identified as “open”. Although late calving cows in a given ranch are outside of a predetermined calving window, those same cows may fit perfectly at another ranch that has a different calving window.
The difference in cow value between “open” and “bred” can be significantly large and is related to cow age. As cows age, their productive life shortens, which is reflected in the amount cow buyers are willing to pay. Figure 1, shows the average cow value for various cow ages from a bred heifer to short-term broken mouth cows and the margin or difference between the bred cow value and an open cow. Young 3-year-old cows have the greatest margin of $1,396 compared to an open cow and there is a stepwise margin decline as cows age settling at an average margin of $400 between a short-term bred cow compared to an open cow. These bred cow values illustrate that there is a financial advantage for not removing bulls according to a predetermined breeding period, but rather sorting cows into the predetermined breeding period using ultrasound during the fall pregnancy check. Allowing bulls to remain with breeding groups also reduces labor and resources needed to gather cattle, sort, and haul bulls to a set aside pasture.