Energy and Protein Requirements of Finishing Steers Fed Dried Canola Meal
(Research Report, Carrington REC, December 2025)An experiment to evaluate the energy and protein requirements of finishing steers fed canola meal as the sole supplemental protein source. The study compared growth performance, dietary energy utilization, and carcass traits among steers fed 13% and 15% CP rations. Results from this work contribute to a better understanding of how protein level adjustments in canola meal–based feedlot diets can affect finishing outcomes and the economic sustainability of beef production systems in the northern Great Plains.
Canola meal (CM) is a high-protein coproduct of canola oil extraction and an important feed ingredient for ruminants in regions where it is locally produced. Despite its favorable amino acid profile and digestibility, CM utilization in beef cattle finishing rations has historically remained low due to limited regional availability, higher transportation costs, and competition with other protein sources. However, the recent expansion of renewable fuel production and vegetable oil production across the northern Great Plains has increased both the supply and accessibility of CM, creating new opportunities for its use in feedlot systems.
As beef producers aim to balance performance efficiency with input costs, the potential of CM as a primary protein source warrants renewed investigation. Previous research has established that ruminants can effectively utilize CM without compromising intake or digestibility, yet limited data exist regarding its use in high-energy finishing diets. The protein content and degradability characteristics of canola meal differ from distillers grain plus solubles, with a higher proportion of rumen degradable protein (RDP) and reduced fat concentration, factors that may alter energy retention, fat deposition, and carcass composition when included at higher dietary crude protein (CP) levels.
Determining the optimal CP concentration when formulating canola meal–based finishing diets is critical for maximizing growth performance and carcass quality while maintaining cost-effective production. Incremental increases in dietary CP, such as from 13% to 15%, may influence energy utilization and marbling development, but excessive protein supplementation can reduce efficiency or increase nitrogen excretion.
To address these knowledge gaps, the North Dakota State University Carrington Research Extension Center (CREC) conducted an experiment to evaluate the energy and protein requirements of finishing steers fed canola meal as the sole supplemental protein source. The study compared growth performance, dietary energy utilization, and carcass traits among steers fed 13% and 15% CP rations. Results from this work contribute to a better understanding of how protein level adjustments in canola meal–based feedlot diets can affect finishing outcomes and the economic sustainability of beef production systems in the northern Great Plains.
Materials and Methods
All procedures involving the use of animals in these experiments were approved by the North Dakota State University Institutional Animal Care and Use Committee (approval number IACUC20240031). This experiment was conducted at the CREC between December 2024 and July 2025.
Treatments, animals, initial processing, and study initiation
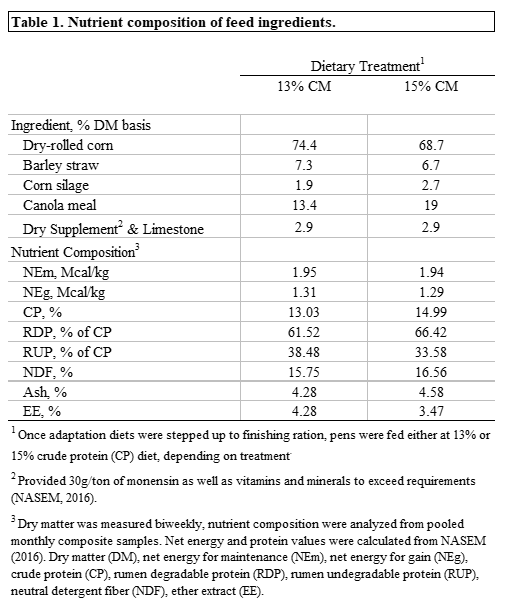
The analyzed nutrient composition of feed ingredients is presented in Table 1.
One hundred forty-four cross-bred steers (808 ± 91 lbs, initial body weight (BW)) were used in this experiment. Steers were consigned and delivered to the CREC from multiple ranches across North Dakota throughout October and November 2024. Steers were backgrounded on a similar ration for approximately 65 days prior to the initiation of the study.
Steers were stratified by source (Block 1-3). On December 16, 2024, steers from Blocks 1 and 2 were weighed for BW collection, which was used for allotment purposes. On December 17, 2024, steers from Blocks 1 and 2 were reweighed, processed, sorted, and placed into randomly assigned one of 12 pens ([Block 1=8 pens, Block 2=4 pens]. On January 23, 2025, steers from Block 3 were weighed for BW collection used for allotment purposes. On January 24, 2025, steers from Block 3 were reweighed, processed, sorted, and placed into randomly assigned one of 12 pens. All pens were in a randomized complete block design (blocked by source). Pens were randomly assigned to one of two dietary treatments (6 pens/treatment): 13% crude protein with CM as the sole protein supplement (13% CM); 15% crude protein with CM as the sole protein supplement (15% CM). The experiment was initiated on June 13, 2025, with a 28-d adaptation period and a 183-, 169- and 171-d finishing period for Block 1,2, and 3, respectively. All live BW measurements were pencil shrunk 4% to account for digestive tract fill, in accordance with equations to determine shrunk body weight from NASEM (2016).
Steers were harvested when visually appraised by trained observers to have 12th rib fat (RF) thickness of 0.5 in. Final BWs were recorded at 0800 on shipping day, approximately 24 hours post final feeding the day prior. After weighing, steers to be harvested were comingled into a holding pen and offered water. Steers were gathered for delivery approximately 1200 h and shipped to the commercial abattoir located 800 km from the CREC. Electronic ID tags were used to determine harvest order. Hot carcass weights and video camera image carcass data were collected from the beef plant.
Growth performance, carcass trait, dietary net energy utilization calculations
Three steers (3 from 13% CM) died during the study, due to peritonitis (1), rectal prolapse (1), and respiratory disease (1). Steers that were removed from the study or that died during the study were assumed to have consumed feed equal to the pen mean dry matter intake (DMI) up to the point of removal or death. Overall average daily gain (ADG) was calculated as the difference between initial and final BW. Overall feed conversion efficiency (G:F) was calculated from ADG/DMI.
Observed dietary net energy (NE) was calculated from daily energy gain (EG; Mcal/d) according to the medium frame steer calf equation using the equivalent BW adjustment. Observed-to-expected (O:E) NEm and NEg were calculated from observed dietary NE values for maintenance or gain divided by tabular estimates of NE for maintenance or gain (NASEM, 2016).
Hot carcass weight (HCW) was captured immediately following the harvest procedure. Video image data were obtained from the commercial abattoir for rib eye area (REA), rib fat (RF), and USDA marbling scores. Kidney, pelvic, and heart fat (KPH) percentage was determined via plant-specific algorithm. Dressing percentage (DP) was calculated as: HCW/ (final BW × 0.96). Yield grade (YG) was calculated according to the USDA regression equation (USDA, 2017). Estimated empty body fat (EBF) percentage and adjusted final body weight (AFBW) were calculated from observed carcass traits (Guiroy et al., 2002).
Statistical Analysis
Data were analyzed using the GLIMMIX Procedure of SAS 9.4 (SAS Institute Inc., Cary, NC) with pen serving as the experimental unit. The model includes the fixed effects of protein amount (13%, 15%), and the random effect of block. For the distribution of categorical variables (distributions of USDA Yield and Quality grade), counts for each category were entered by pen, and a multinomial analysis for ordinal data was conducted following the procedure recommended by Bowley (2015), using pen within treatment as the subject. Significance was declared at P ≤ 0.05, and tendencies were considered when 0.10 > P > 0.05.
Results
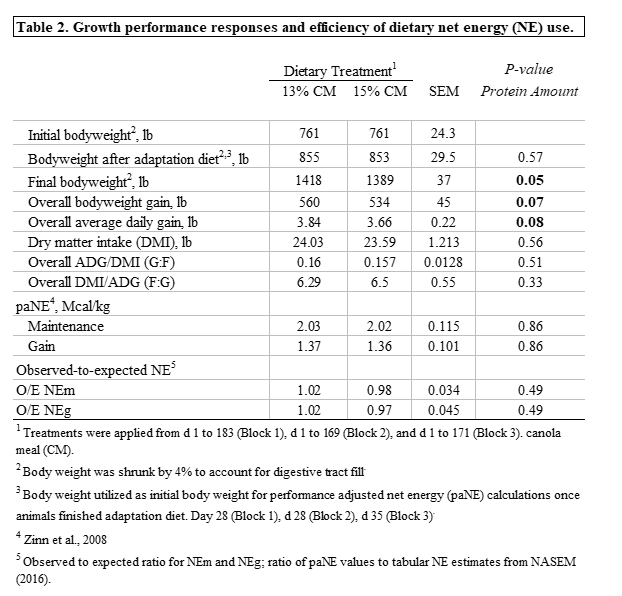
Growth performance data are shown in Table 2. Initial BW or BW after diet adaptation did not differ (P = 0.57) among treatments. A tendency for increased final body weight (P = 0.05) and overall weight gain (P = 0.07) for steers fed 13% CP with a numerical increase of 26 lbs of overall weight gain. Additionally, a tendency (P = 0.08) for increased ADG was observed for steers fed 13% CM. No effect of crude protein level was observed in DMI (P = 0.56) or GF (P = 0.51) or FG (P = 0.33). Additionally, no effect of crude protein was observed for performance adjusted net energy (P = 0.86) or the observed-to-expected ratio of net energy (P = 0.49).
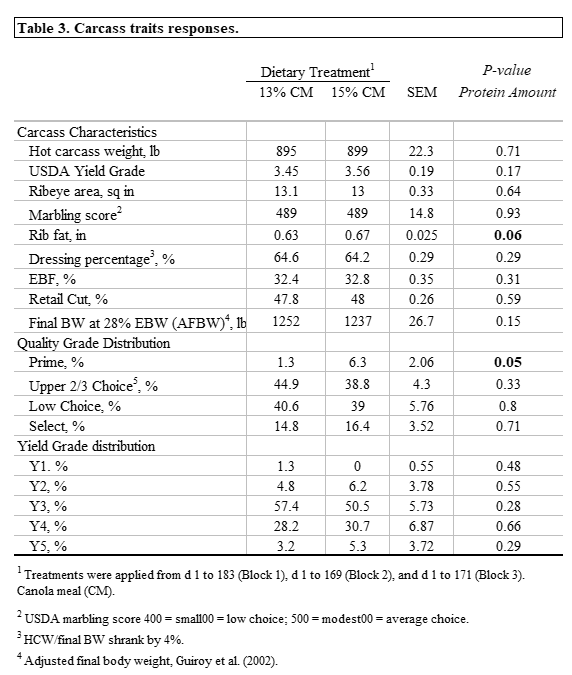
Carcass trait data are shown in Table 3. No effect of protein amount was observed in HCW, USDA YG, REA, marbling score, dressing percentage, EBF, retail cut %, or AFBW (P > 0.17). There was a tendency (P = 0.06) for greater rib fat thickness, with a numerical increase observed for steers fed 15% CP. Additionally, a tendency (P = 0.05) was observed for an increased distribution of prime graded carcasses for steers fed 15% CP.
Conclusion
Increasing dietary crude protein from 13% to 15% to cattle during finishing tended to reduce daily, final, and overall weight gain throughout the study. Cattle fed 15% crude protein tended to have increased rib fat thickness and tended to have greater distribution of prime graded carcasses. During periods of decreased canola meal and input costs, increasing levels of dietary crude protein using canola meal may be an economically feasible option.
This research was partially funded by the Northern Canola Growers Association. This research was supported, in part, by the intramural research program of the U.S. Department of Agriculture, National Institute of Food and Agriculture, Hatch project accession number, 7006839. The findings and conclusions in this preliminary publication have not been formally disseminated by the U. S. Department of Agriculture and should not be construed to represent any agency determination or policy.
Acknowledgement
The authors would like to thank all of the cattle consigners who supplied animals for this study. The authors would like to thank the crew of the CREC Livestock Unit for daily husbandry of the animals.
Literature Cited
Bowley SR. 2015. A hitchhiker’s guide to statistics in biology: generalized linear mixed model edition. Guelph (ON): Any Old Subject Books.
Guiroy PJ, Tedeschi LO, Fox DG, Hutcheson JP. 2002. The effects of implant strategy on finished body weight of beef cattle. J Anim Sci. 80:1791–1800. doi:10.2527/2002.8071791x.
NASEM. 2016. Nutrient requirements of beef cattle. 8th rev. ed. Washington (DC): National Academies Press. doi:10.17226/19014.
Zinn RA, Barreras A, Owens FN, Plascencia A. 2008. Performance by feedlot steers and heifers: daily gain, mature body weight, dry matter intake, and dietary energetics. J Anim Sci. 86:2680–2689. doi:10.2527/jas.2007-0561.