Field Pea and Canola Intercropping Production Management
(Research Report, Carrington REC, December 2020)A study to test the different seeding ratios of field pea and canola to establish baseline agronomic strategies for intercropping.
Intercropping is a revamped old-fashioned concept. The premise is that two (or more) crops are planted and harvested together. Due to the complexity of growing two crops simultaneously, there have been many historical barriers to adopting this practice. These barriers come in the form of mechanical limitations, pest management options, post-harvest management, insurance or program restrictions, and identifying appropriate species and varieties to pair. These barriers are the least substantive they have ever been due to mechanization. The benefits of intercropping vary, but often include better resource utilization (fertility/water), better erosion management through mixed residue types, a more competitive crop for weed management, and more productivity per acre. It is accepted that yields of either crop will be reduced when intercropping, compared to monocropping. The benefit is that the total yield of both crops will surpass what a single crop can produce. This is measured by the land-equivalency ratio (LER). LER is the term used to describe performance of each component of a cropping system compared to growing a single crop. Each component will be comparatively less than a monocrop, but when the components are added together, a successful intercropping pair will equal greater than either monocrop (>1).
From 2018 to 2020, a field pea and canola intercropping study was conducted with some shared treatments across years. The goal of the study was primarily to test the different seeding ratios of the two crops to establish baseline agronomic strategies for intercropping. The seeding ratios were based off standard seeding rates for each crop and were reduced to a set percentage of that total. For field pea the standard seeding rate was 330,000 PLS/ac and 5 lbs/ac for canola. Field pea were divided to 66, 50, or 33% of that standard, or 220K, 165K, or 110K PLS/ac. For canola those same ratios equaled 3.3, 2.5, 1.65 lb/ac. The goal was to find the ratio that produced the highest total yield per acre. In 2019 and 2020, fertility was added as a component so that each ratio was fertilized with 0, 60, or 120 lbs of extra nitrogen. Potassium sulfate was added to these trials to ensure adequate sulfur nutrition for the canola. Each treatment was replicated four times for each year of the study within a split-plot randomized complete block design. Following production analysis, a price of $9 per acre for field peas and $520/ton for canola was used to calculate the cost/benefit of different intercropping combinations in terms of gross return.
The good and bad news is that the results varied by year. In 2018 and 2019 canola production was very good and drove the success of the treatments. In 2020, the canola was very poor which caused the field peas to drive the success of the system. Overall, field pea yields were stable across years, with canola yield varying widely year to year. In each year of the study, there were substantial yield gains through intercropping (Table 1). In general terms, this system functioned best when at least one of the seeding rates remained at 66% of the standard rate. Field pea yields were reduced to a greater degree than canola yields as a result of intercropping. With canola, yield loss from intercropping usually ranged from 10-20% when seeding ratios were 50% or greater. With field peas, yield losses were often 40% or greater, even in the most favorable ratios. The exception was in 2020, when canola performance was poor, the field pea yield loss was much lower when the seeding percent was at least double that of canola. LER values indicate the best performing treatments were when seeding ratios were 66/66% of standard, followed by 33% canola and 66% field pea. The treatment of 33% canola and 66% field pea performed poorly in 2018 and 2019, but did considerably better in 2020. Lower fertility treatment generally performed poorer with intercropping. The middle and higher fertility treatments did not differentiate.
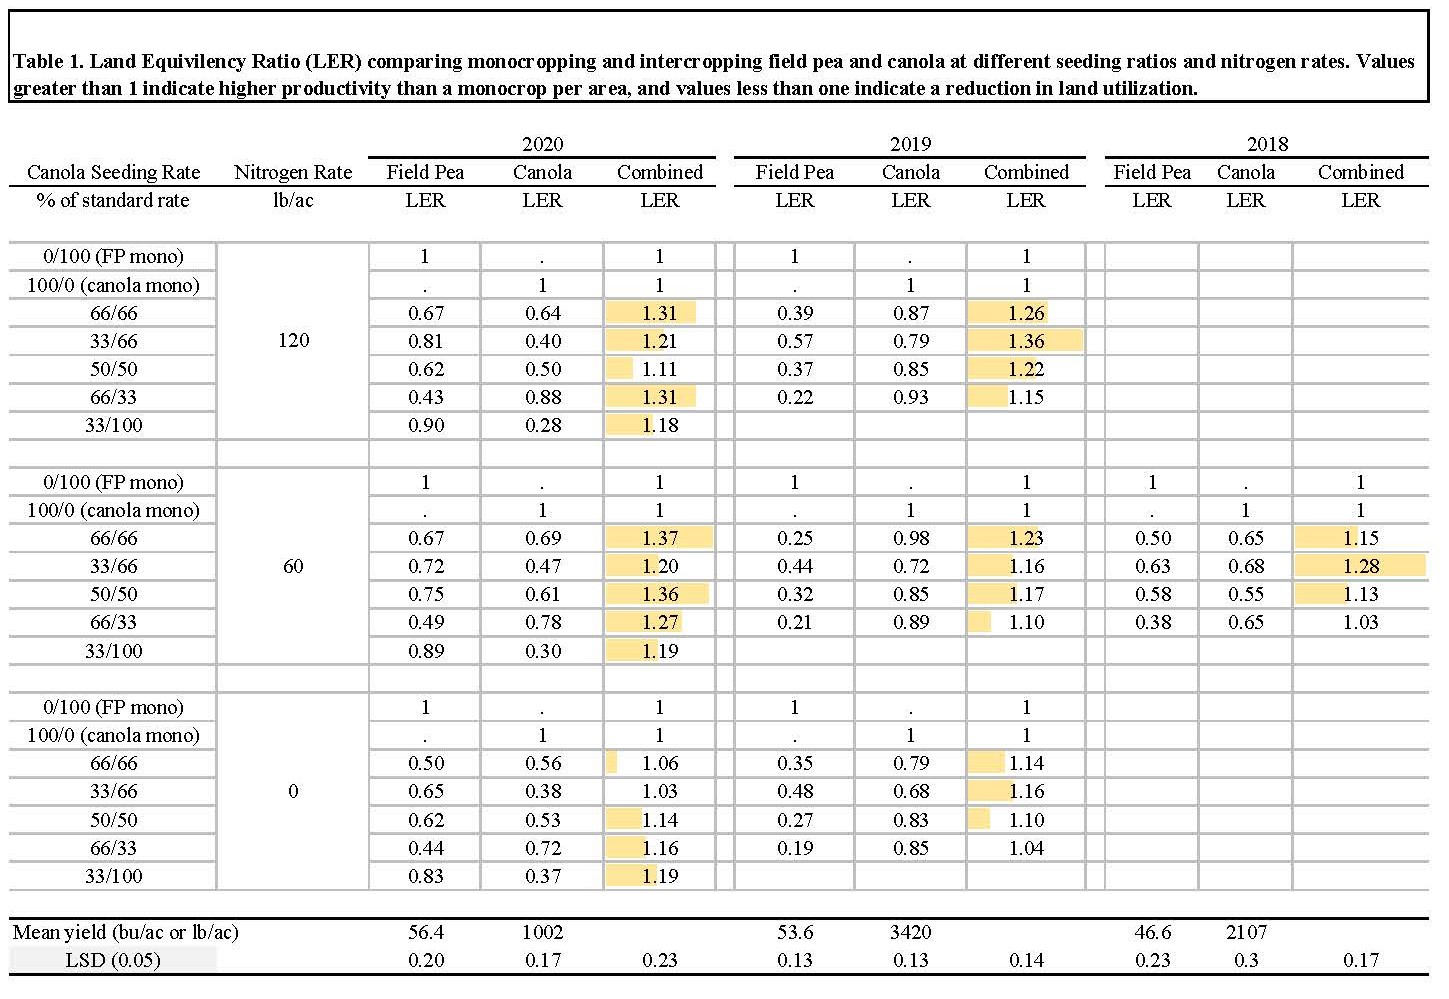
The problem with using LER as the primary indicator of success is that it takes raw yield out of the equation. This can make a poor crop seem like it is adding a lot of value to the system. Since the starting monocrop yield is low, the intercropping yield reduction is often also less since it is based on percent of the monocrop yield. This is the case in the dataset in Table 1. In 2020, when canola yields were not good, it disproportionately made the system appear more successful than it actually was. As a result, it is best to take this one step further and look at the economics behind the yields.
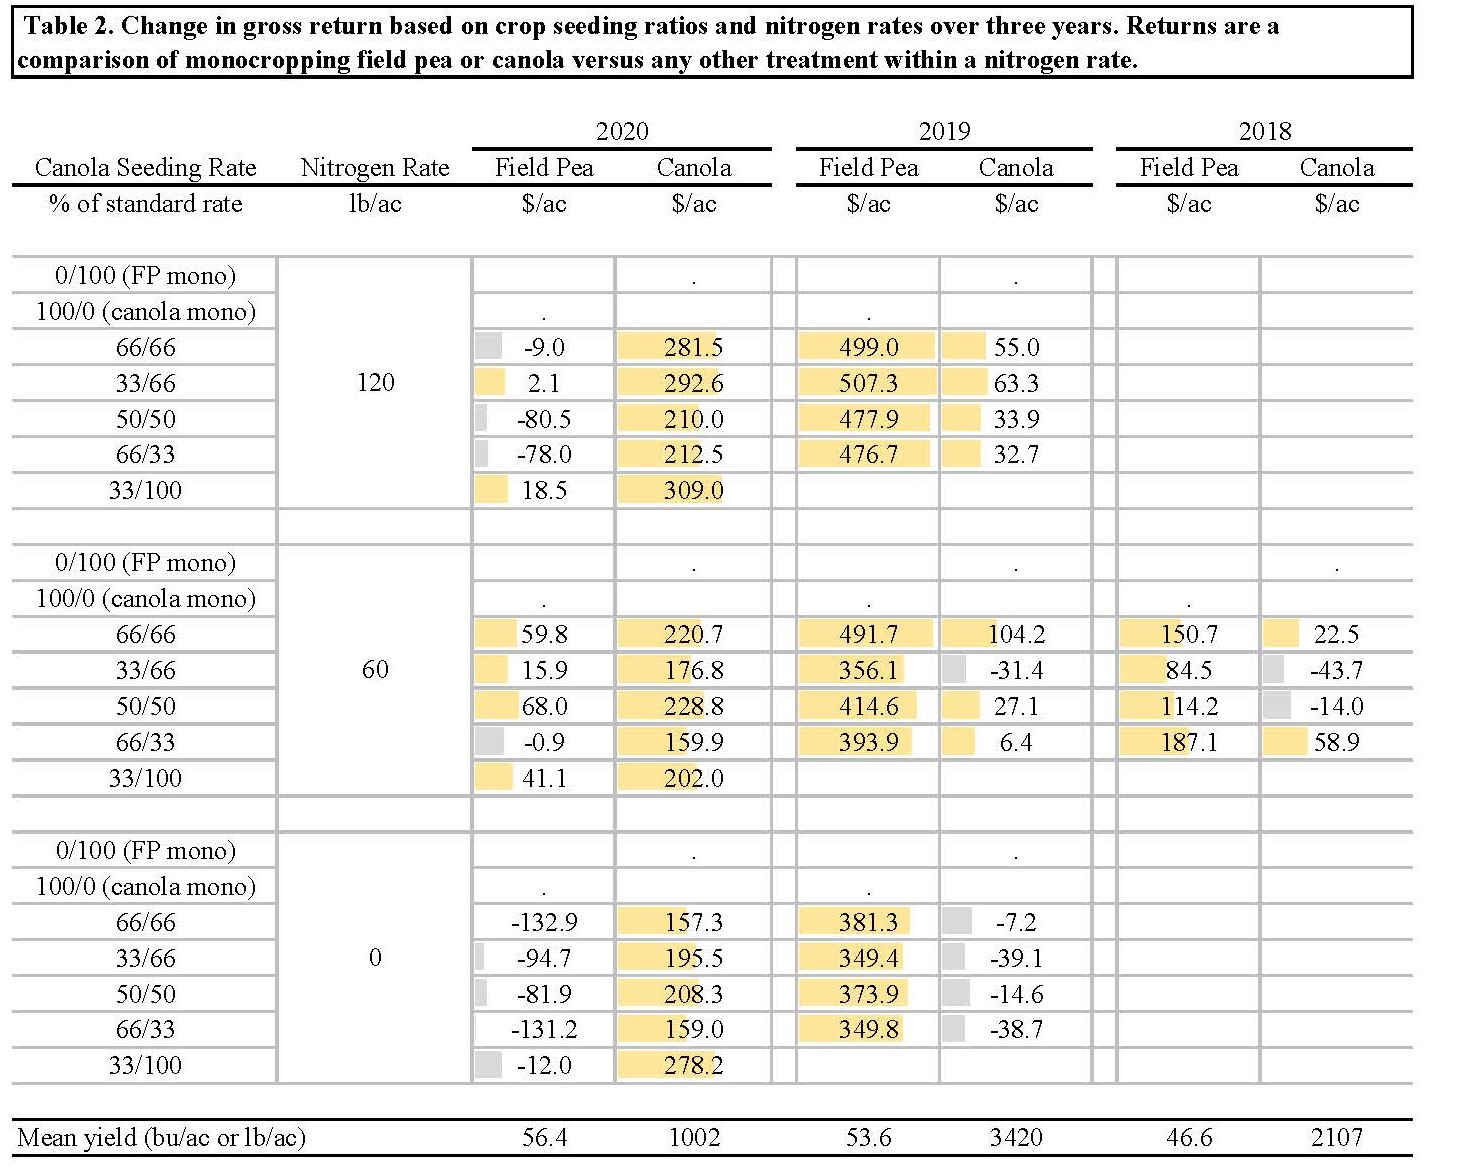
The economics of intercropping can be confusing. While looking at gross return on its own can be helpful, Table 2 is a decision support tool that compares monocropping to the different intercropping treatments based on dollar gains or losses. The best way to read this table is to view the monocrop as the baseline (within each nitrogen rate) and each treatment below it is the gain or loss of adding a second crop. For instance, in the poor performing 2020 canola, it was always advantageous to add field peas. The opposite is true for 2019 when it was always advantageous (to a large degree) to add canola as an intercrop compared to field peas alone. The conundrum is whether it is better to add a second crop to a good performing monocrop. In 2020, many treatments lost money when adding canola to field peas. The higher the percent of canola, the greater the profit loss. In 2020, the decision to add canola could either lose up to $130/ac or gain up to $70/ac. The best decisions resided in the medium fertility treatments in 2020. In 2019, where canola yields were exceptional, strategies that benefited canola naturally produced the best returns (high fertility, high canola seeding rates). Adding field peas to 2019 canola was sometimes a detriment, but was always a positive with high fertility treatments. With low fertility (0 nitrogen) gross returns were the poorest, with the largest negative values and the smallest positive values for most combinations.
Navigating the nuances of intercropping will be an ongoing learning curve for everyone involved. With a growing body of farmer and researcher data about intercropping, it is clear that there are some winning and losing combinations. Like all of agriculture, it will come down to the individual year. The biggest takeaway from this trial is that intercropping can help manage risk. Each treatment had an equal chance to succeed at the start of the year. Due to differences in rainfall or location there was always a dominant crop in this system that couldn’t be predicted ahead of time. Mother nature is the most important driver of crop success, by having both crops present, you can hedge your bets about which crops will be the winners in a particular year. This is one intercropping system where both components can be successful.