2022: Salt and Sodicity Tolerance of Barley, Oat and Canola
(Research Report, Langdon REC, November 2022)Around 10-12% of our crop land result in marginal yields to total loss of revenue due to the high levels of salinity (caused by excess levels of water-soluble salts) and sodicity (caused by excess levels of exchangeable sodium versus calcium). On these often white looking unproductive areas, producers not only lose their investments for seed, fertilizer, fuel and time but lack of vegetative growth results in more wicking up of groundwater (capillary rise) leading to even higher levels of salinity and sodicity.
In order to provide the producers salt-tolerant annual cropping options, the NDSU Langdon Research Extension Center tried four barley and four oat varieties in 2020 at three different levels of salinity and sodicity. In 2021, four durum varieties were planted along side barley and oats, whereas, in 2022, durum was replaced with four canola varieties.
Annual yield and quality results provided very good insights into the actual versus perceived salt-tolerance of these annual crops. In addition, effects of changes in the annual precipitation were found to be a major factor how annual crops cope with salinity and sodicity.
Barley and oats are some of the most salt and sodicity tolerant annual crops producers can profitably grow in North Dakota. However, at certain salinity and sodicity levels, even barley and oats can result in significant losses. Especially important are the levels of salinity and sodicity in the top six inches of the soils. Sensing the need to determine the economic threshold of soil salinity (Electrical Conductivity or EC) and sodicity (Sodium Adsorption Ratio or SAR) for barley and oats, four barley and four oat varieties were planted at the Langdon REC site in 2022 at three different levels of salinity and sodicity. This trial was a repeat of 2020 and 2021 trials. In addition, four canola varieties were added to the trial in 2022 to compare salinity and sodicity tolerances of the canola crop versus barley and oats.
Soil Analysis Results
Two-foot deep composite soil samples separated into 0-6 and 6-24 inch depths were taken on June 9, 2022 by taking three cores for each sample. The three levels of salinity and sodicity were described as replications 1, 2 and 3 and were sampled separately. Replication 1 was described as having low to moderate levels of salinity and sodicity, replication 2 having moderate to high levels and replication 3 having very high levels. These descriptions were based on the salinity and sodicity tolerance of crops like barley and oats. These levels would be considered high for sensitive crops such as soybean. Soil EC, SAR and pH were analyzed by using the saturated paste extract method (Table 1).
Table 1. The 2020, 2021 and 2022 soil EC, SAR and pH results of the three replications for the 0-6 and 6-24 inch depths.
| EC (dS/m) | EC (dS/m) | EC (dS/m) | SAR | SAR | SAR | pH | pH | pH | |||
|---|---|---|---|---|---|---|---|---|---|---|---|
| Site | Sample ID | Depth (inches) | 2020 | 2021 | 2022 | 2020 | 2021 | 2022 | 2020 | 2021 | 2022 |
| Rep 1 | Low to moderate salinity-sodicity | 0-6 | 3.99 | 4.63 | 1.64 | 7.12 | 6.20 | 4.95 | 7.18 | 7.54 | 7.40 |
| 6-24 | 7.32 | 7.49 | 6.70 | 15.05 | 14.72 | 15.50 | 7.71 | 7.97 | 7.80 | ||
| Rep 2 | Moderate to high salinity-sodicity | 0-6 | 7.80 | 13.20 | 7.92 | 18.13 | 22.88 | 16.28 | 7.61 | 8.17 | 7.80 |
| 6-24 | 10.39 | 12.29 | 11.03 | 20.92 | 21.14 | 39.54 | 7.95 | 8.21 | 8.00 | ||
| Rep 3 | Very high salinity-sodicity | 0-6 | 10.50 | 14.90 | 11.21 | 27.30 | 32.74 | 30.00 | 7.59 | 8.14 | 7.80 |
| 6-24 | 9.86 | 12.98 | 11.10 | 32.87 | 32.04 | 31.83 | 7.81 | 8.16 | 8.00 |
The main difference in salinity and sodicity levels between the three replications has been the 0-6 inch depth of replication 1 had low to moderate levels, whereas, replication 2 and 3 have had moderate to high levels in 0-6 and 6-24 inch depths. In addition, 6-24 inch depth of replication 1 had moderate to high salinity and sodicity levels. The lower salinity and sodicity levels in replication 1, 0-6 inch depth and corresponding germination, stands, yields and quality in 2020-2022 indicate the levels of salinity and sodicity in the surface layers matter more than the subsurface layers.
Annual snowfall, resulting spring-melt and rainfall in spring and early growing-season also had an impact on salinity and sodicity, especially in the 0-6 inch depths. Weather wise, 2020 was a normal year, 2021 was very dry (spring and early growing-season) and 2022 was very wet (spring and early growing-season). Dry weather in 2021 resulted in a slight increase in EC, whereas, wet weather lowered EC levels in 2022, especially in replication 1, 0-6 inch depth. Lower EC levels combined with high moisture availability in 2022 spring and early growing-season resulted in improved germination, stands and higher yields even at higher salinity and sodicity levels compared to 2020 and 2021.
Trial Design, Plot Sizes, Planting and Harvesting Details
Trial design was randomized split block and plot sizes were 4.7 X 22 feet. Details are in Table 2.
Table 2. 2022 barley, oat and canola varieties, planting dates, seeding rates and fertilizer rates per acre, planting depths, and harvest dates.
| Crop | Variety | Planting Date | Seeding Rates (live seeds/acre) | Seeding Depth (inches) | Fertilizer Application (lbs./acre) | Harvest Date |
|---|---|---|---|---|---|---|
| 2022 Planting Details | ||||||
| Barley | AAC Synergy (2-row) | June 10, 2022 | 1.0 million live seeds per acre | 1 to 1.5 | Due to a very short growing-season and inability to soil sample early, a uniform rate of 120 pounds of nitrogen and 30 pounds of P2O5 was applied to all three replications the morning of June 10, 2022 by using Urea and MAP. | Straight combined on September 14, 2022 (desiccated on September 8, 2022) |
| ND Genesis (2-row) | ||||||
| Lacey (6-row) | 1.25 million live seeds per acre | |||||
| Tradition (6-row) | ||||||
| Oats | CS Camden | 1.0 million live seeds per acre | ||||
| ND Heart | ||||||
| Rockford | ||||||
| Souris | ||||||
| Canola | L345PC | 0.4356 million live seeds per acre (10 seeds per square foot) | Straight combined on September 22, 2022 (desiccated on September 14, 2022) | |||
| L340PC | ||||||
| DKTFLL21SC | ||||||
| LR344PC | ||||||
Results and Discussion
Similar to 2020 and 2021, there were differences between the three replications in seedbed, germination, plant growth and vigor, maturity, yield, and quality.
Differences in Seedbed
In 2022 the seedbed turned rough and cloddy with the increase in soil sodicity (replication 2 and 3). This effect was slightly less in 2022 compared to 2021 and 2020. That could be due to the annual tillage that was performed in 2020-2022. See seedbed pictures 1-3 below for comparisons.
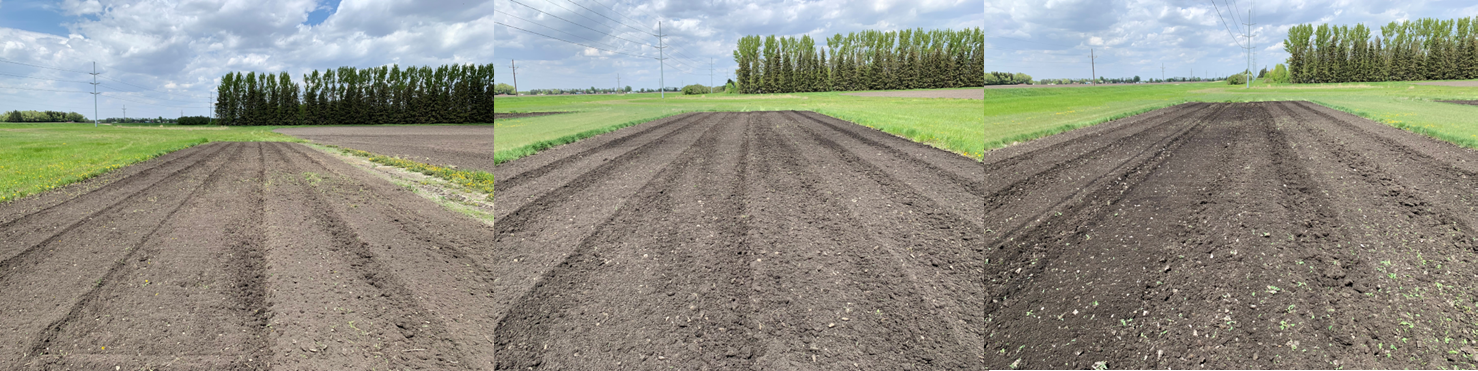
Pictures 1-3: Differences in seedbed between replication 1 (low to moderate salinity-sodicity), 2 (moderate to high salinity-sodicity) and 3 (very high salinity-sodicity) on June 9, 2022.
Differences in Germination
Due to the high availability of soil moisture in 2022 spring and early growing-season, the delay in germination between replication 1 versus 2 and 3 was significantly less. In 2020 and 2021, germination in replications 2 and 3 was 8 to 9 days and 22 to 29 days respectively delayed compared to replication 1. However, due to the higher moisture levels and warmer soil temperatures in 2022, germination in replications 2 and 3 was only 2 to 6 days behind replication 1. There were some differences in crops as well. Barley and oats germinated around 6 days earlier than canola. In terms of early growth, barley established slightly earlier than oats, however, oats caught up quickly. Canola took 6 to 8 days longer.
Differences in Growth, Vigor, Stands and Maturity
Similar to germination, barley and oat growth, vigor and stands looked much better in replication 2 and 3 in 2022, which was not the case in 2020 and 2021. That indicates moderate to decent stands and yields can be achieved at high salinity and sodicity levels if soil moisture availability is high (resulting in less competition between water-soluble salts and plant roots for water), which may not be the case at low moisture levels.
Crop maturity was not uniform and was delayed with the increase in salinity and sodicity. When combined, replication 1 was fully mature with no green at all, replication 2 had some green and replication 3 had a lot of green. See pictures 4 to 6 below of replication 1, 2 and 3 to compare the differences in growth and vigor of barley, oat and durum plots.
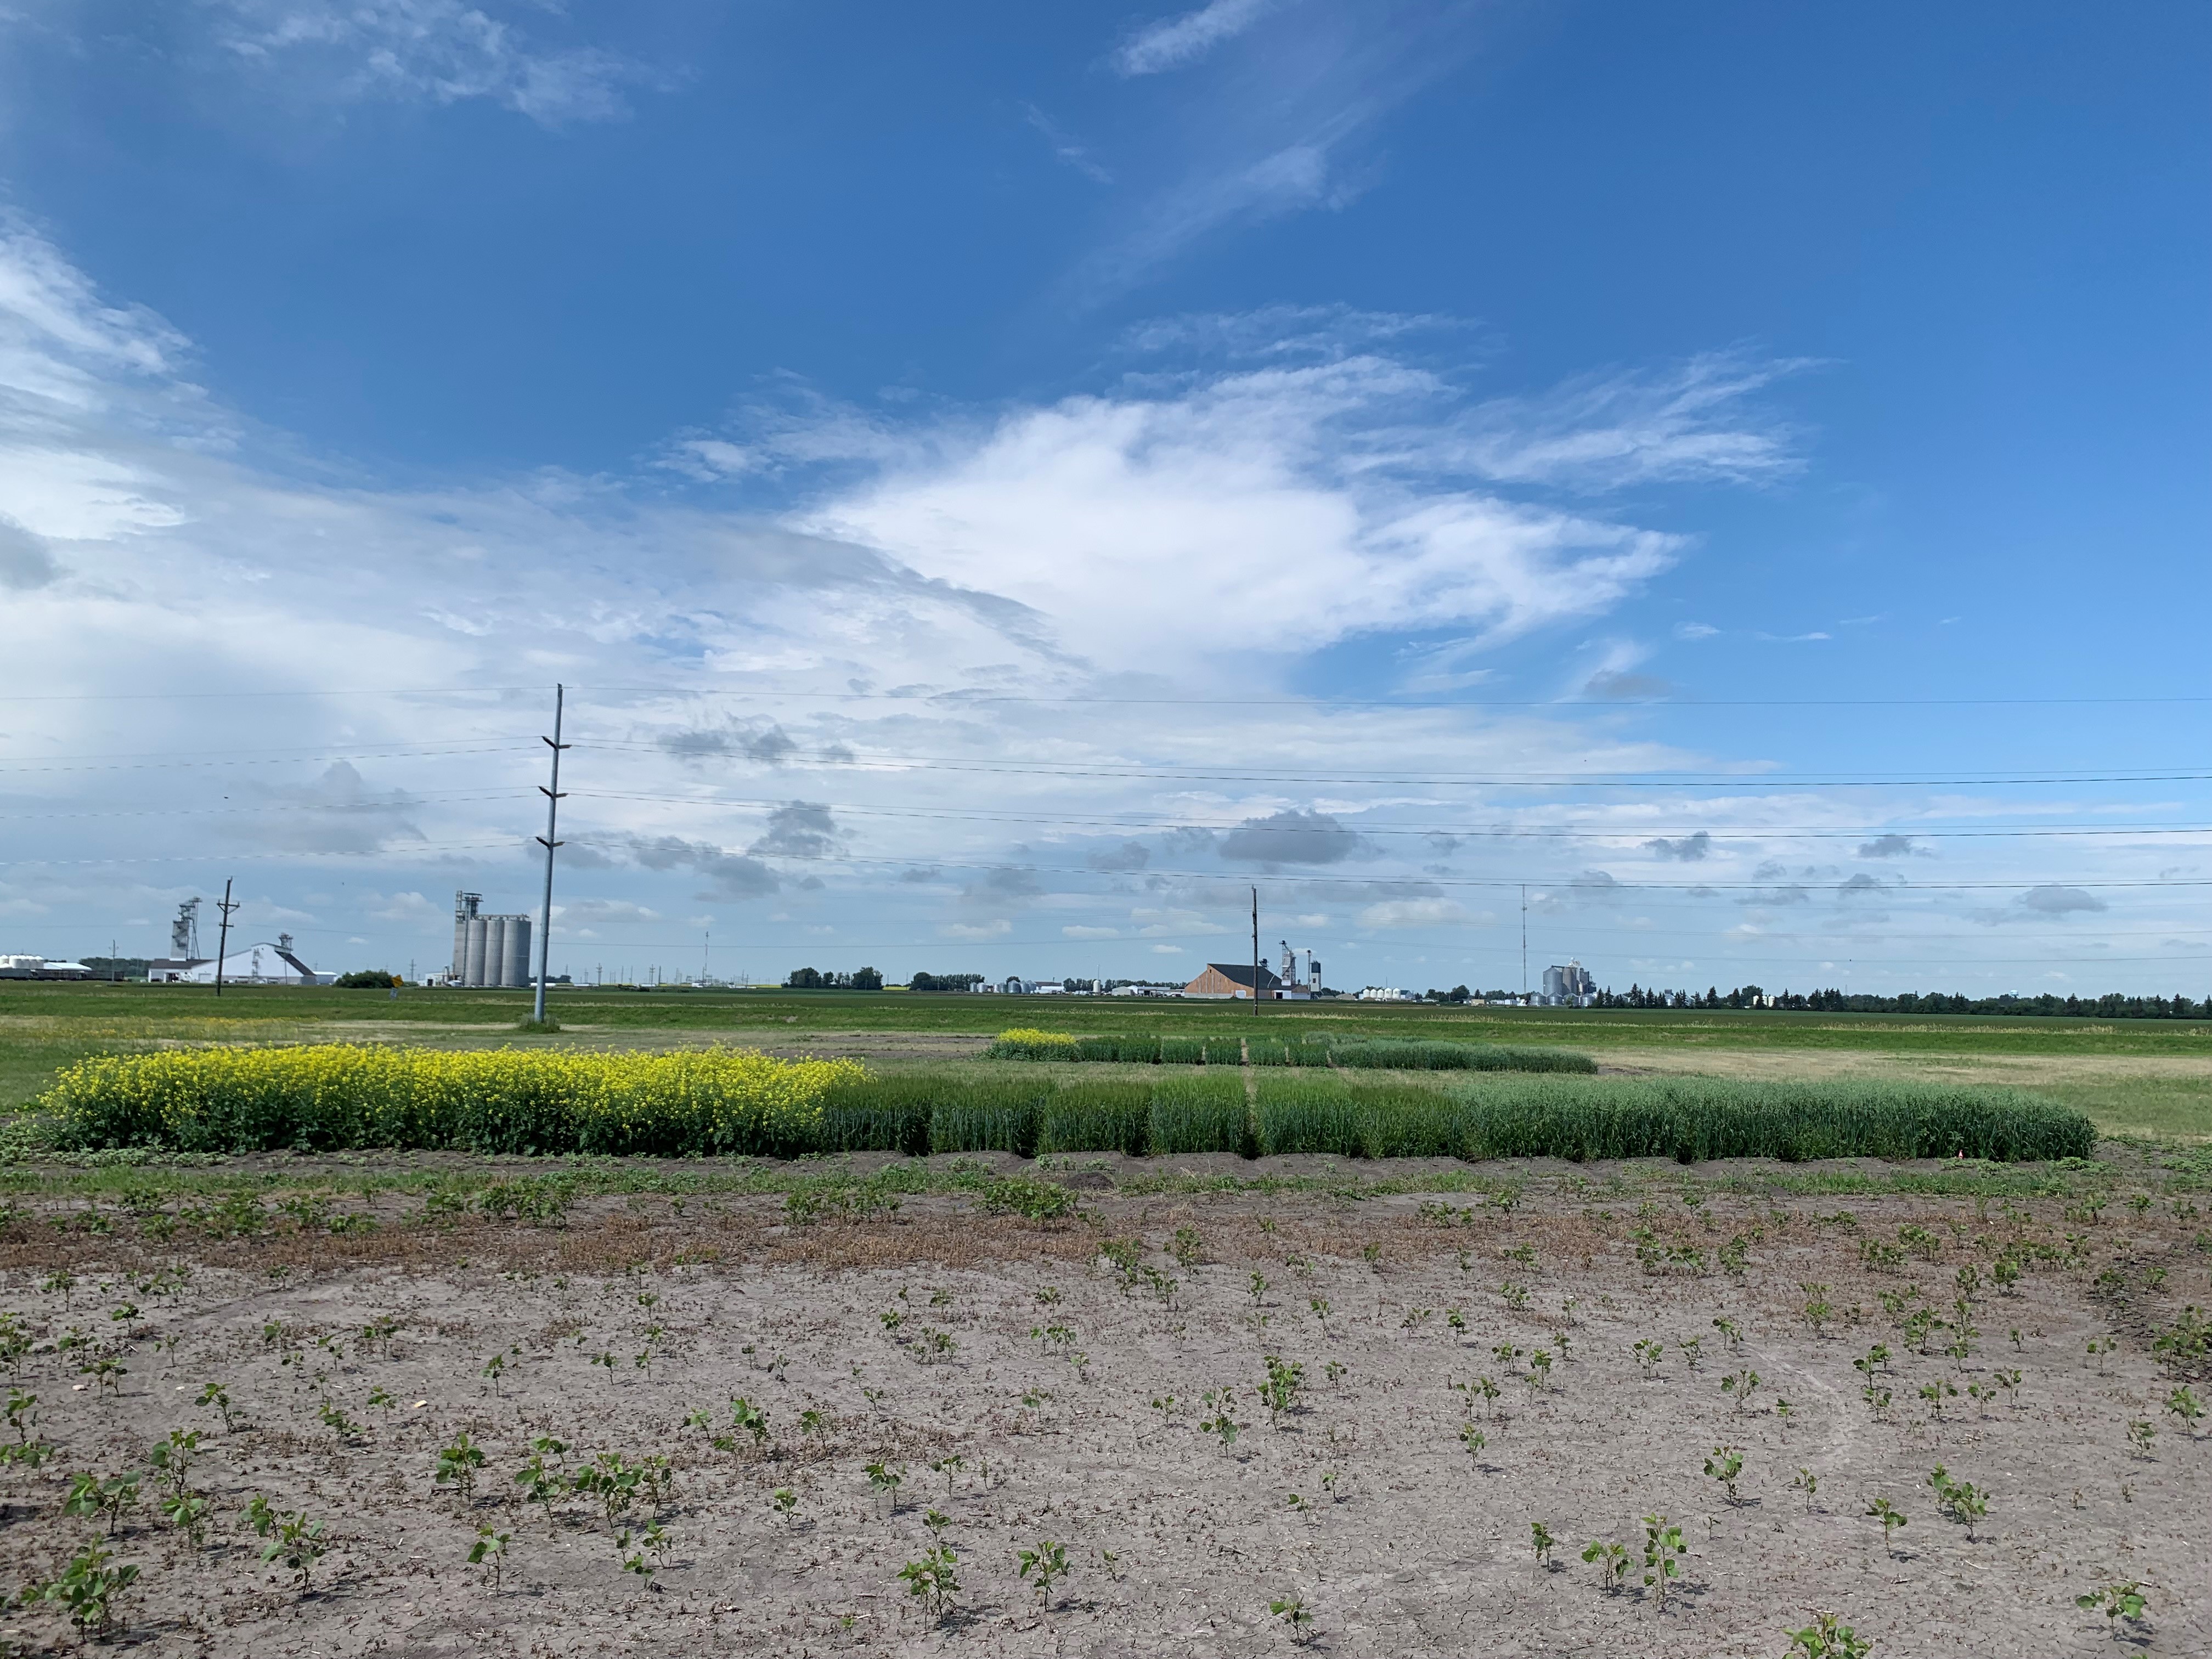
Picture 4. Canola (left), barley (middle) and oat (right) varieties growing in replication 1 on August 1, 2022.
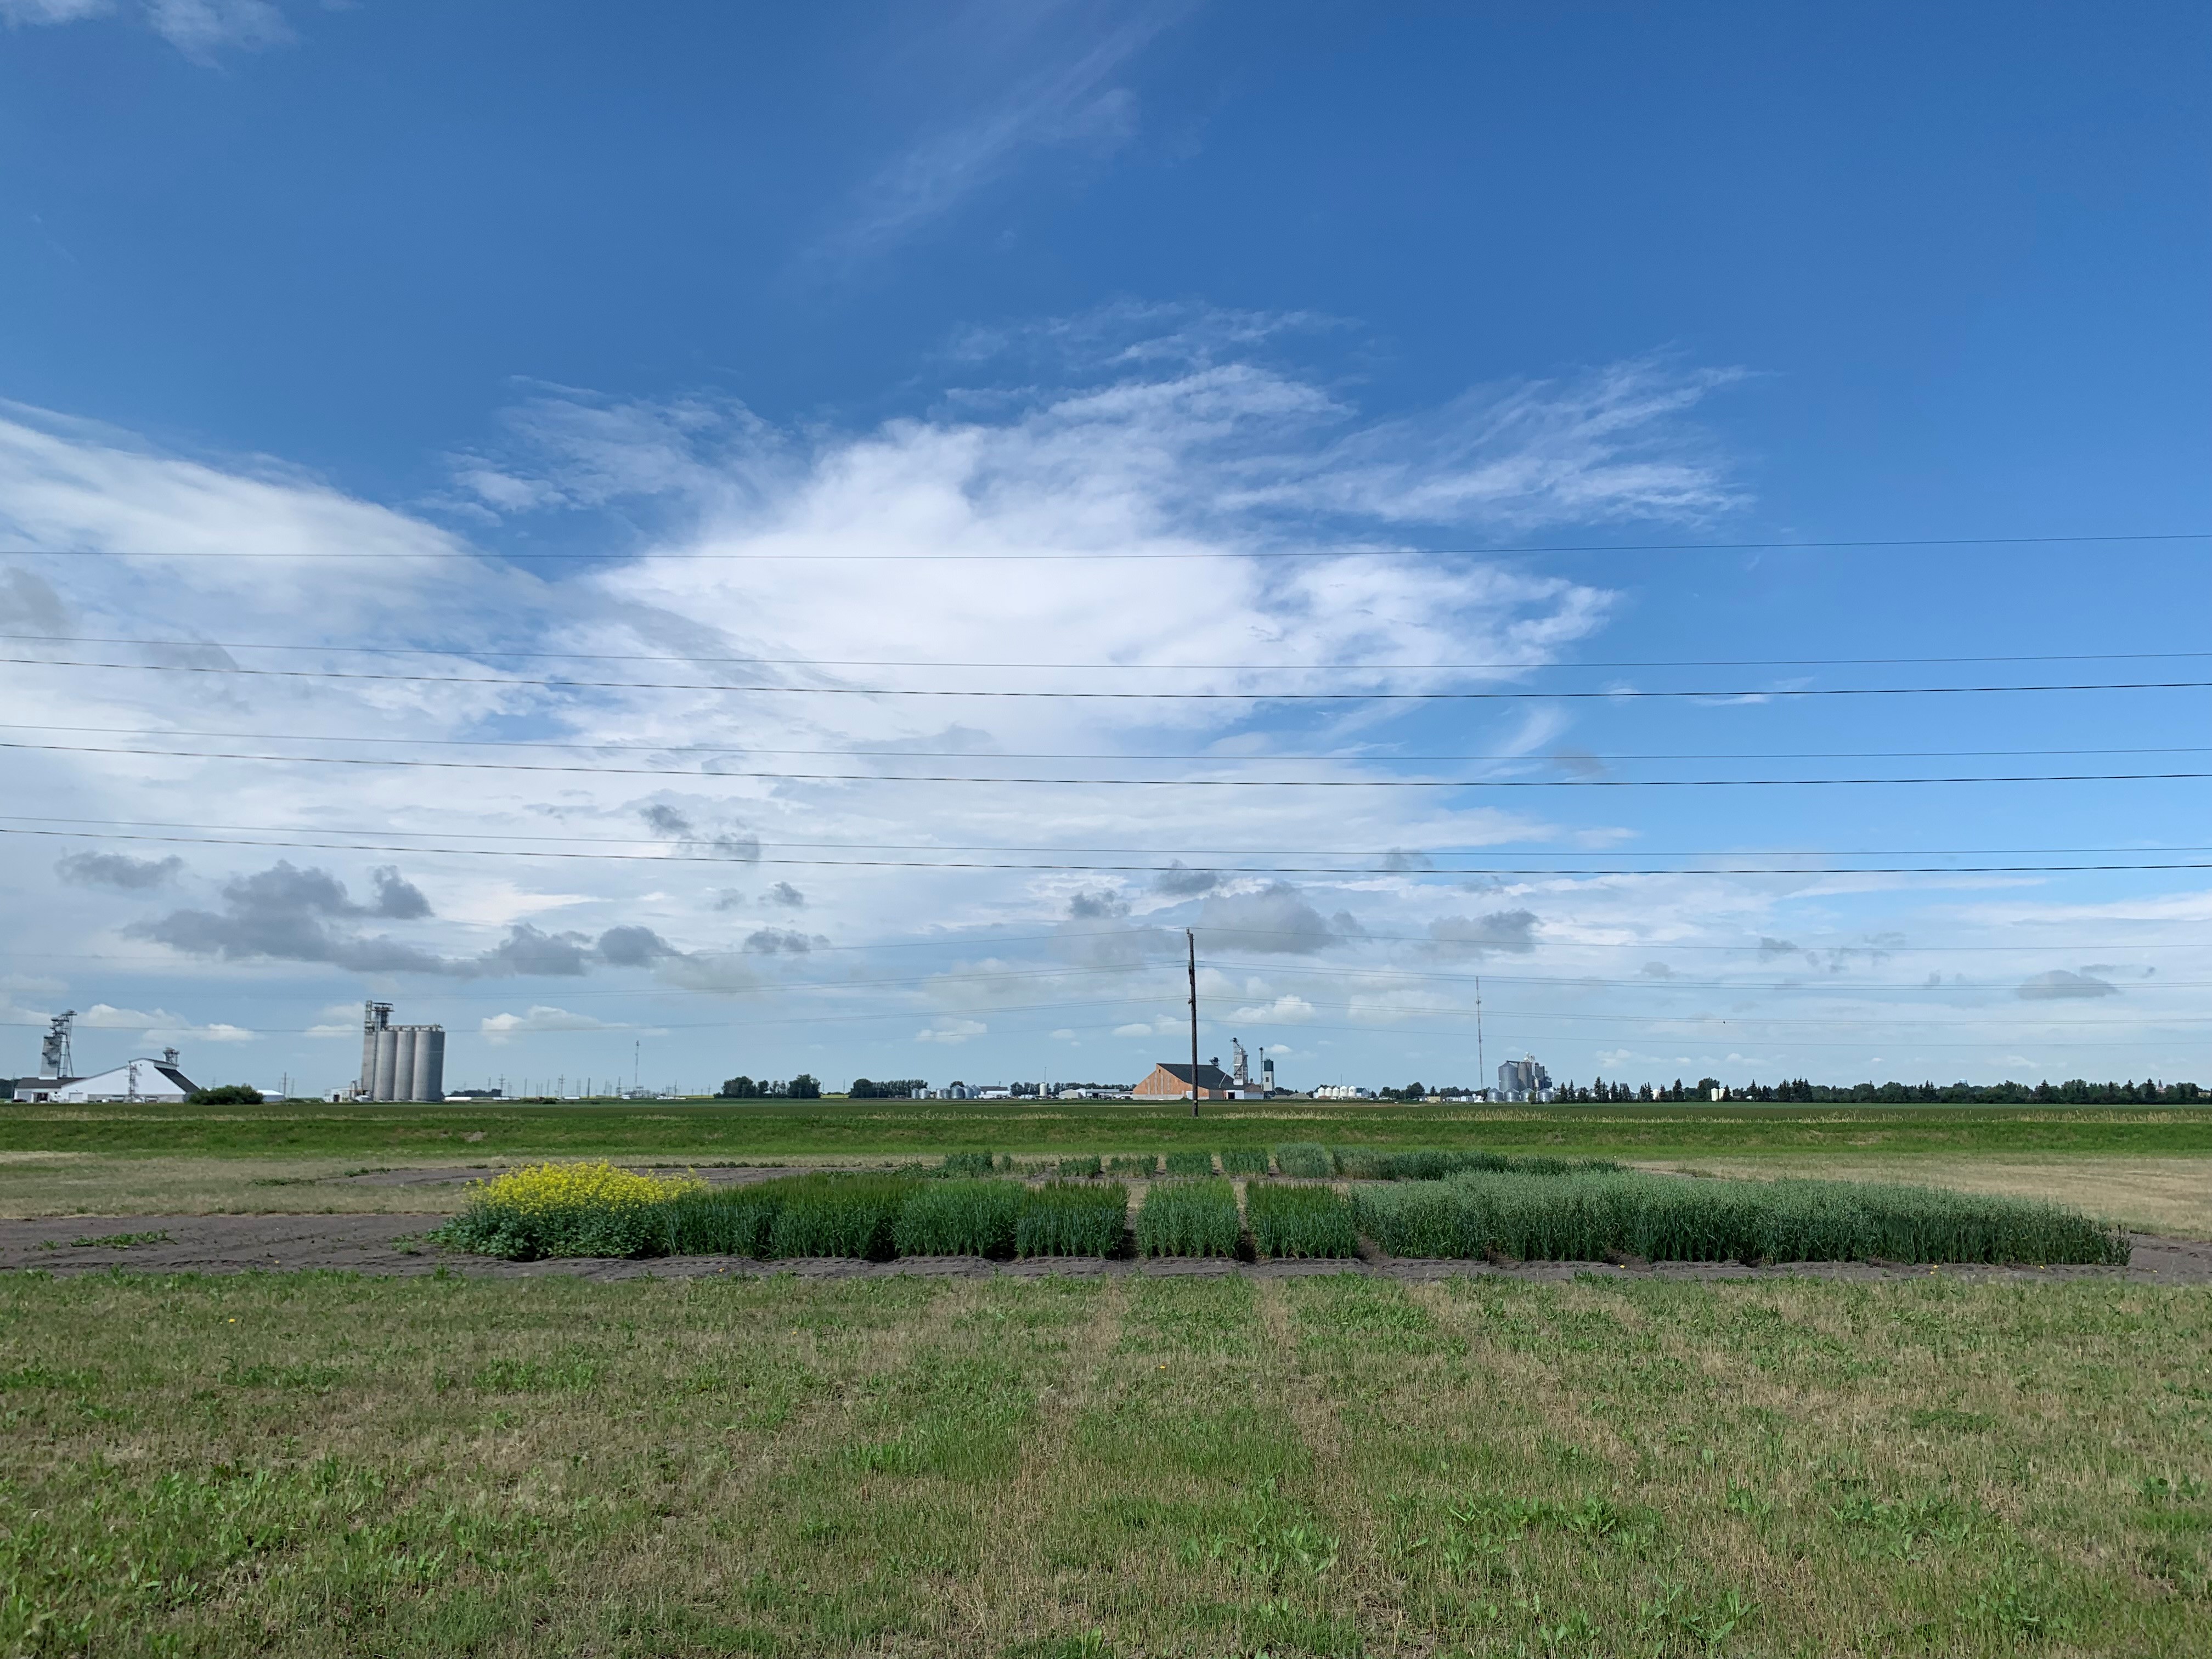
Picture 5. Two canola (left) and all four barley (middle) and oat (right) varieties growing in replication 2 on August 1, 2022.

Picture 6. No canola (left), all four barley (middle) and oat (right) varieties growing in replication 3 on August 1, 2022.
Differences in Yield and Quality
Barley
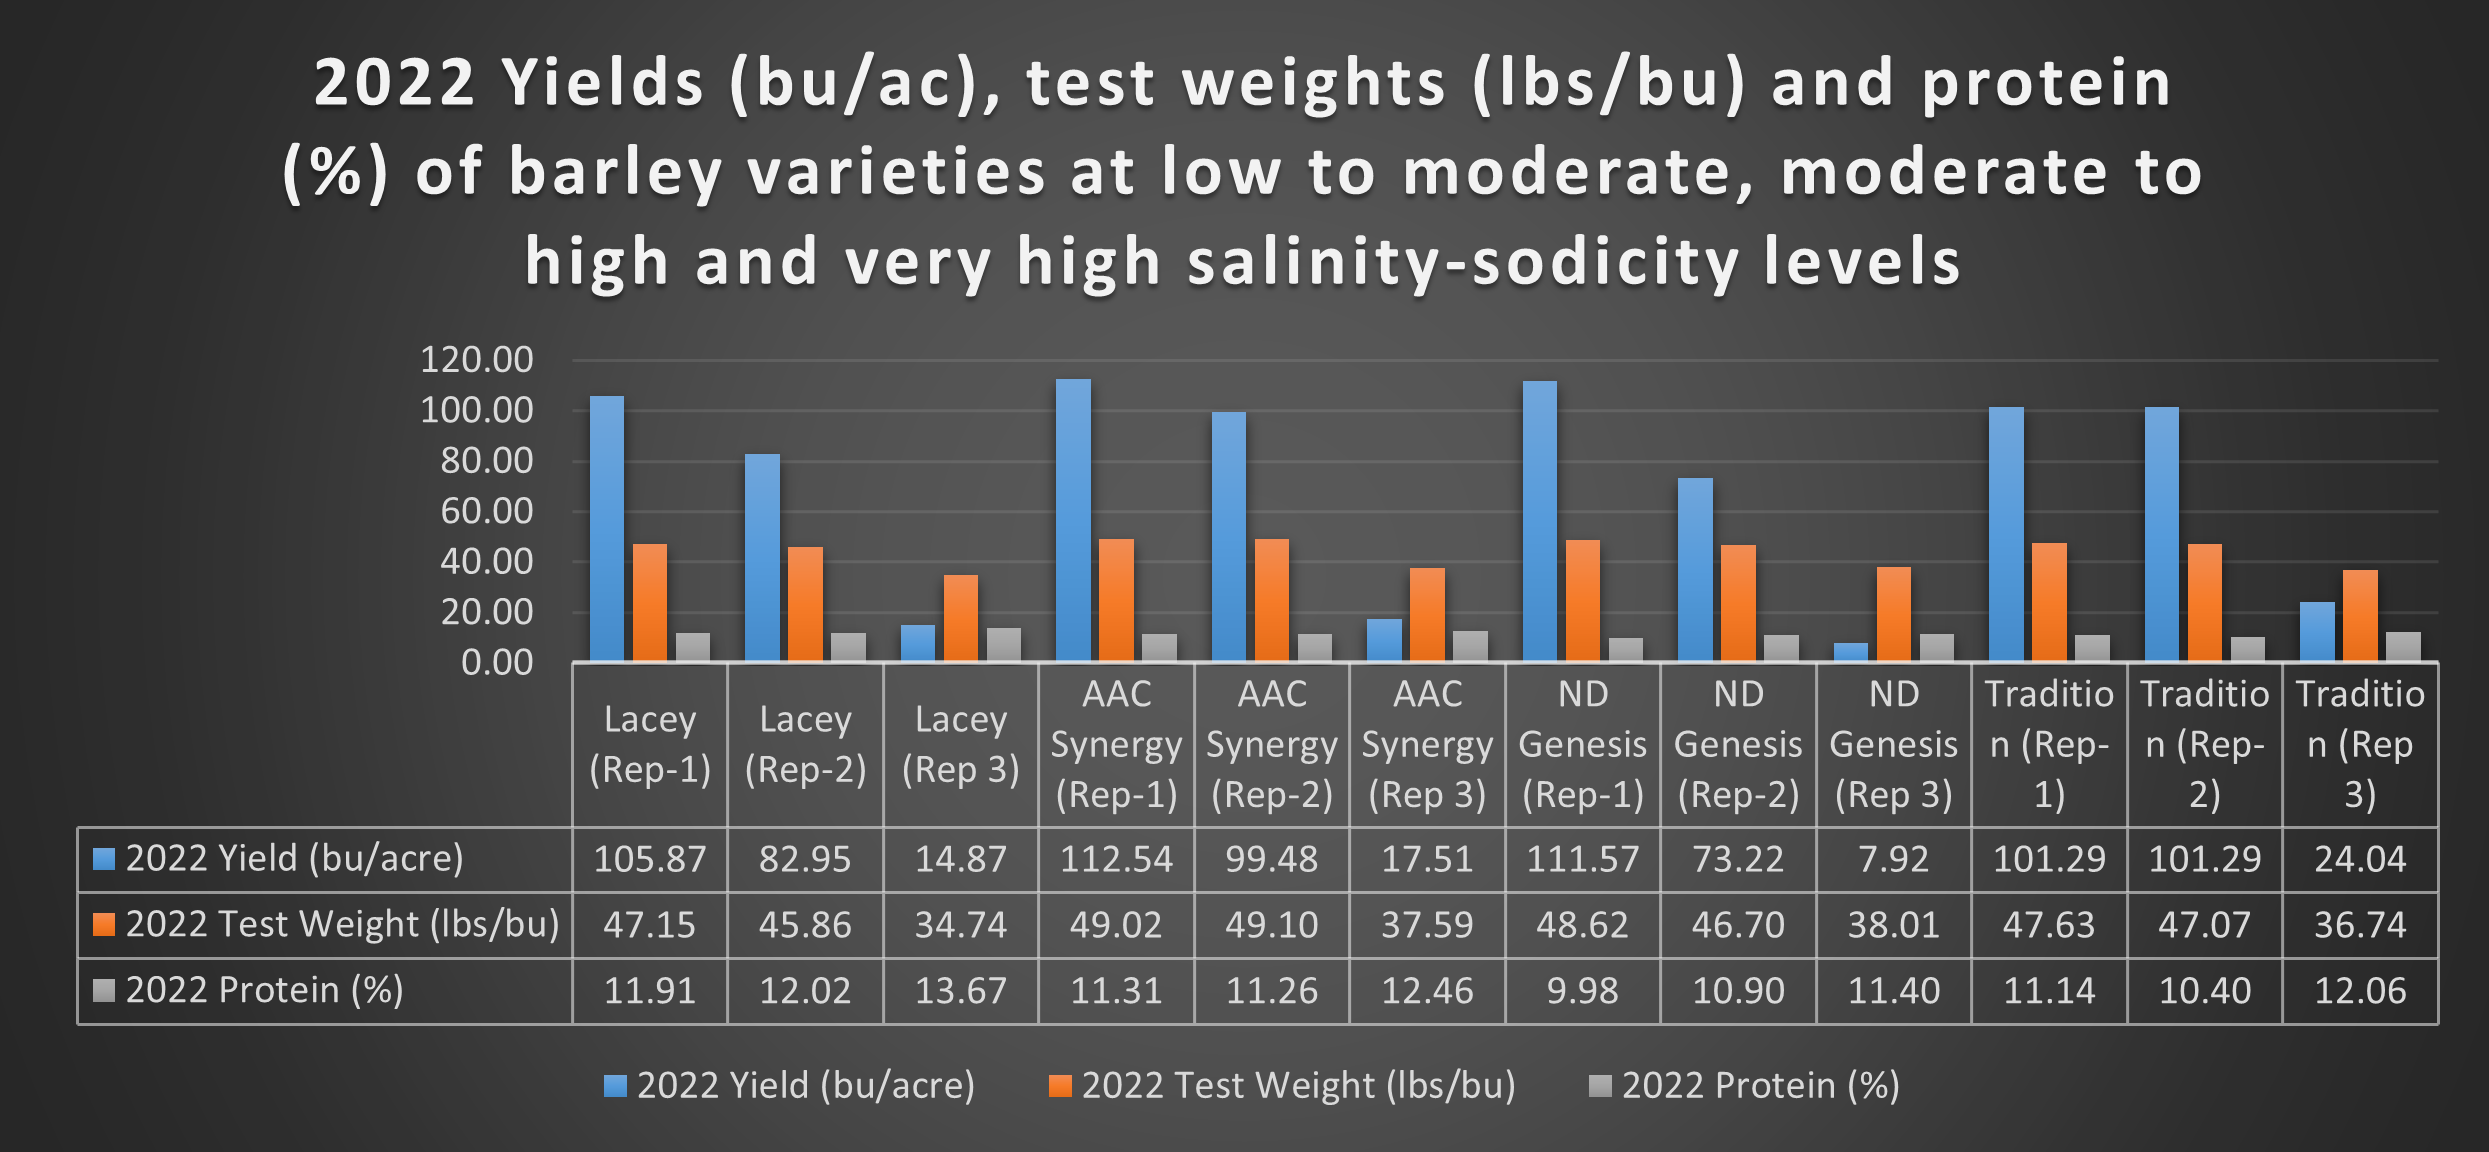
In 2022, all four barley varieties produced highest yields in replications 1 and 2 compared to 2020 and 2021. In addition, first time in three years, all barley varieties produced some yields in replication 3. In 2020 and 2021, replication 2 yielded 74% and 65% respectively less than replication 1. In 2022 the decrease in yield in replication 2 versus replication 1 ranged between 11-34%. Replication 3 yields ranged between 7.92 to 24.04 bushels per acre in 2022. In 2020 and 2021, replication 3 was a net loss.
The decreased yield gap between replication 1 and 2 and replication 3 produced modest yields despite the increase in salinity and sodicity, can be attributed to the high soil moisture availability during 2022 spring and early growing-season. In addition, Tradition (six-row) again produced highest yields at increased salinity and sodicity levels (replication 2 and 3).
Protein increased in all barley varieties with the increase in salinity and sodicity, whereas, test weight (lbs. per bushel) mostly decreased when salinity and sodicity levels increased. Details are in Figure 1.
Figure 1. 2022 yields (bushels/acre), test weights (lbs./bushel) and protein (%) of the four barley varieties for replications 1, 2 and 3.
Oats
All four oat varieties produced the best yields in 2022, as did barley.
Figure 2. 2022 yields (bushels/acre) and test weights (lbs./bushel) of the four oat varieties for replications 1, 2 and 3.
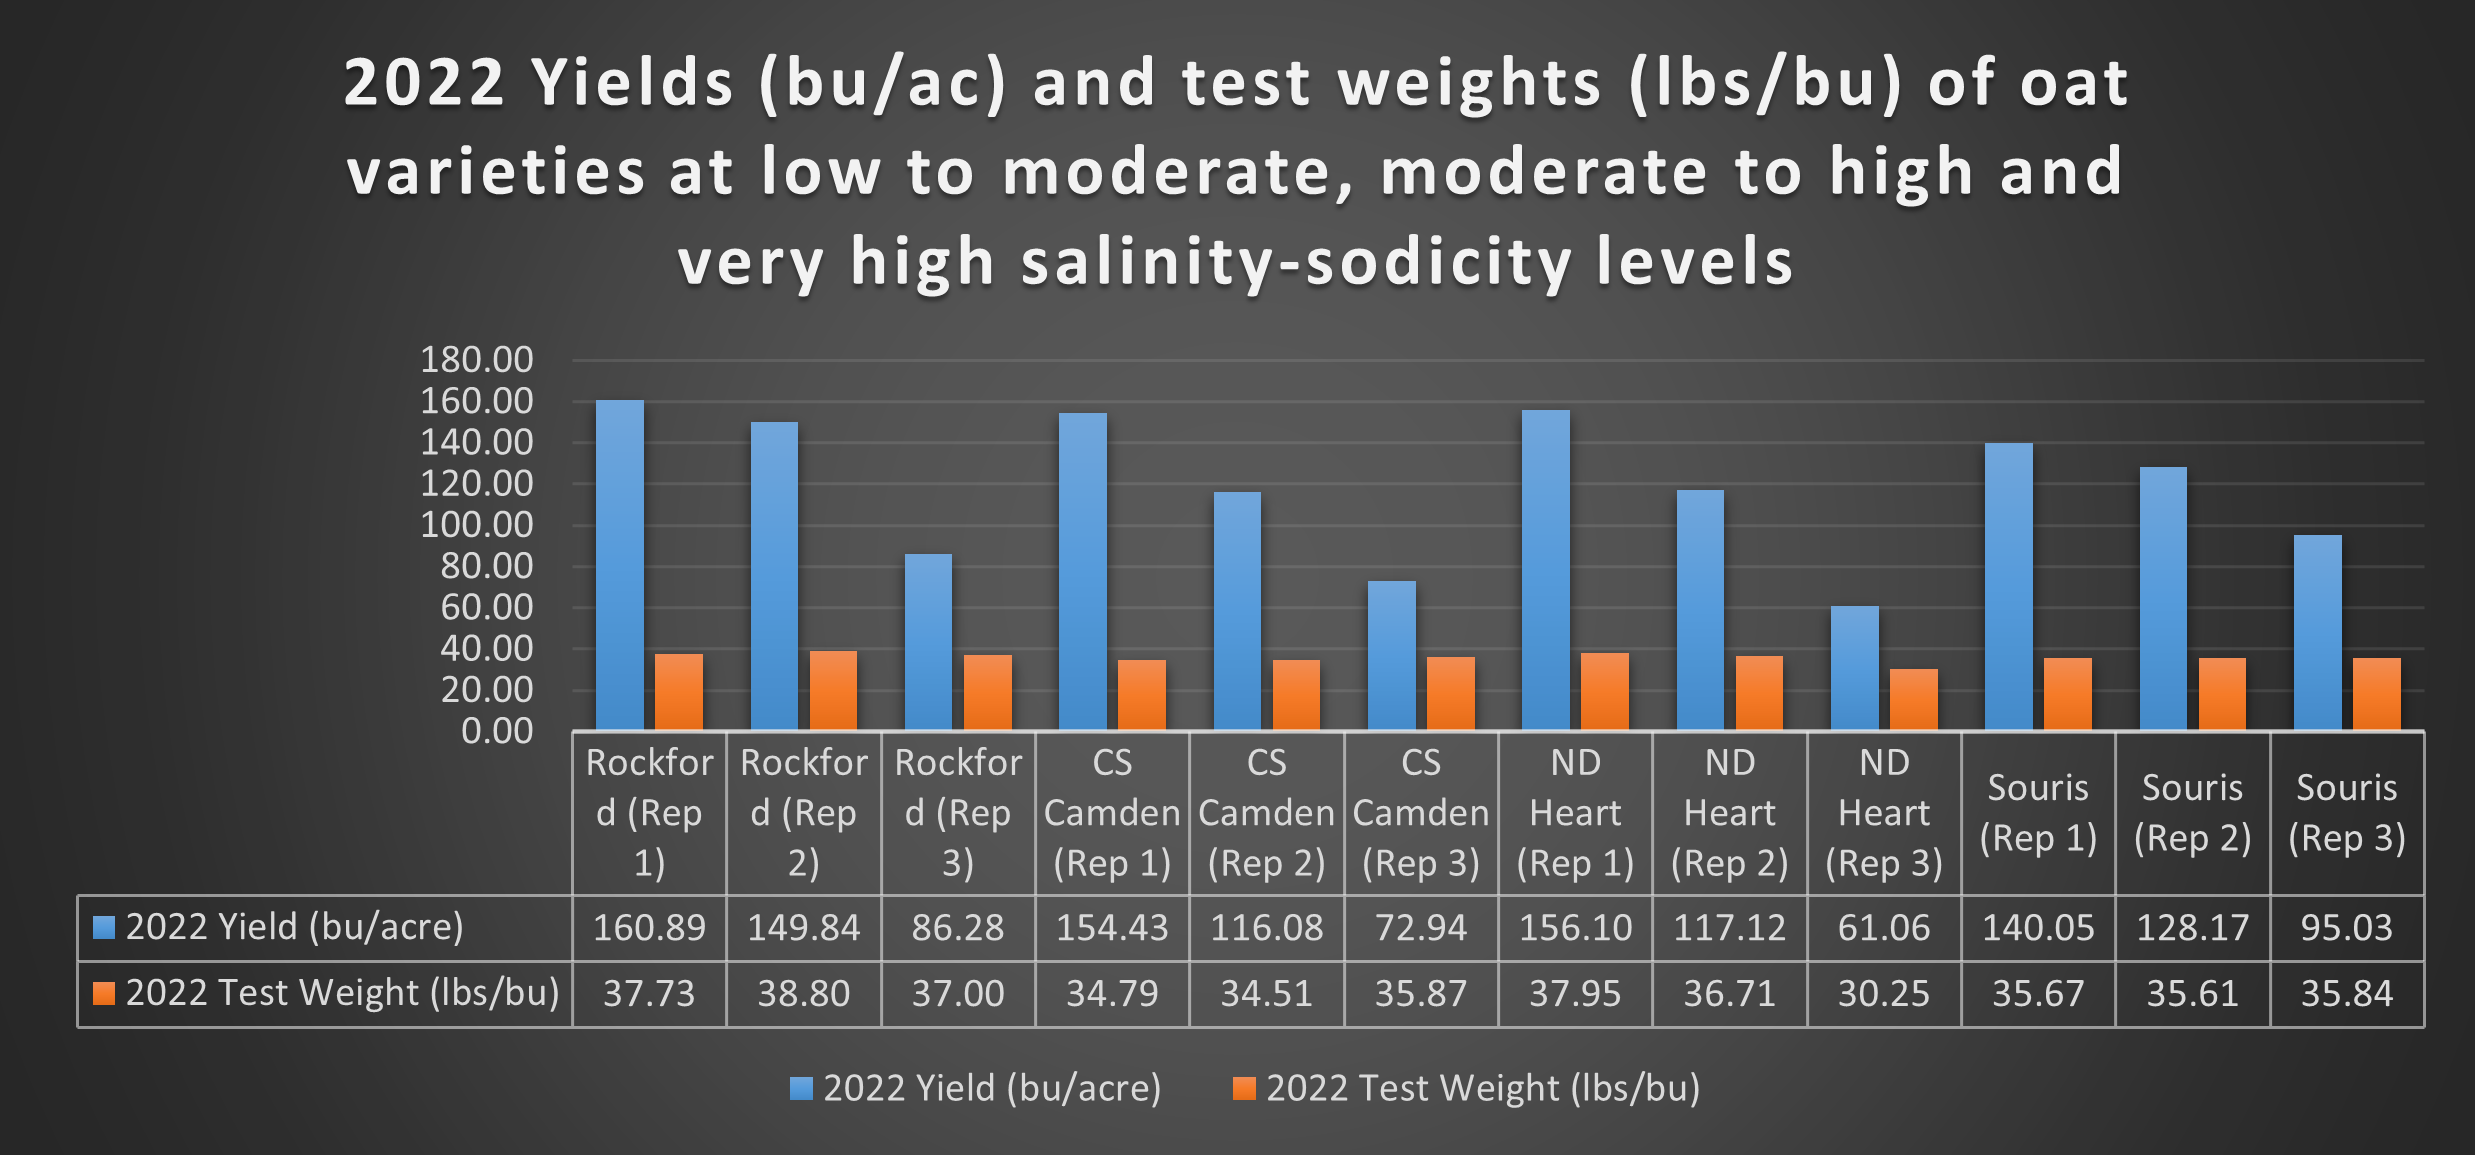
The yield gap between replication 2 in 2022 ranged between 8 to 25 percent, whereas, it ranged from 55 to 76 percent in 2020 and 2021. Replication 3 yielded 32 to 60 percent less in 2022 versus replication 1. In 2020 and 2021 the yield decrease ranged between 65.15 to 99.65 percent. Test weights were generally lower due to reduced growth and vigor at high salinity and sodicity. Details are in Figure 2.
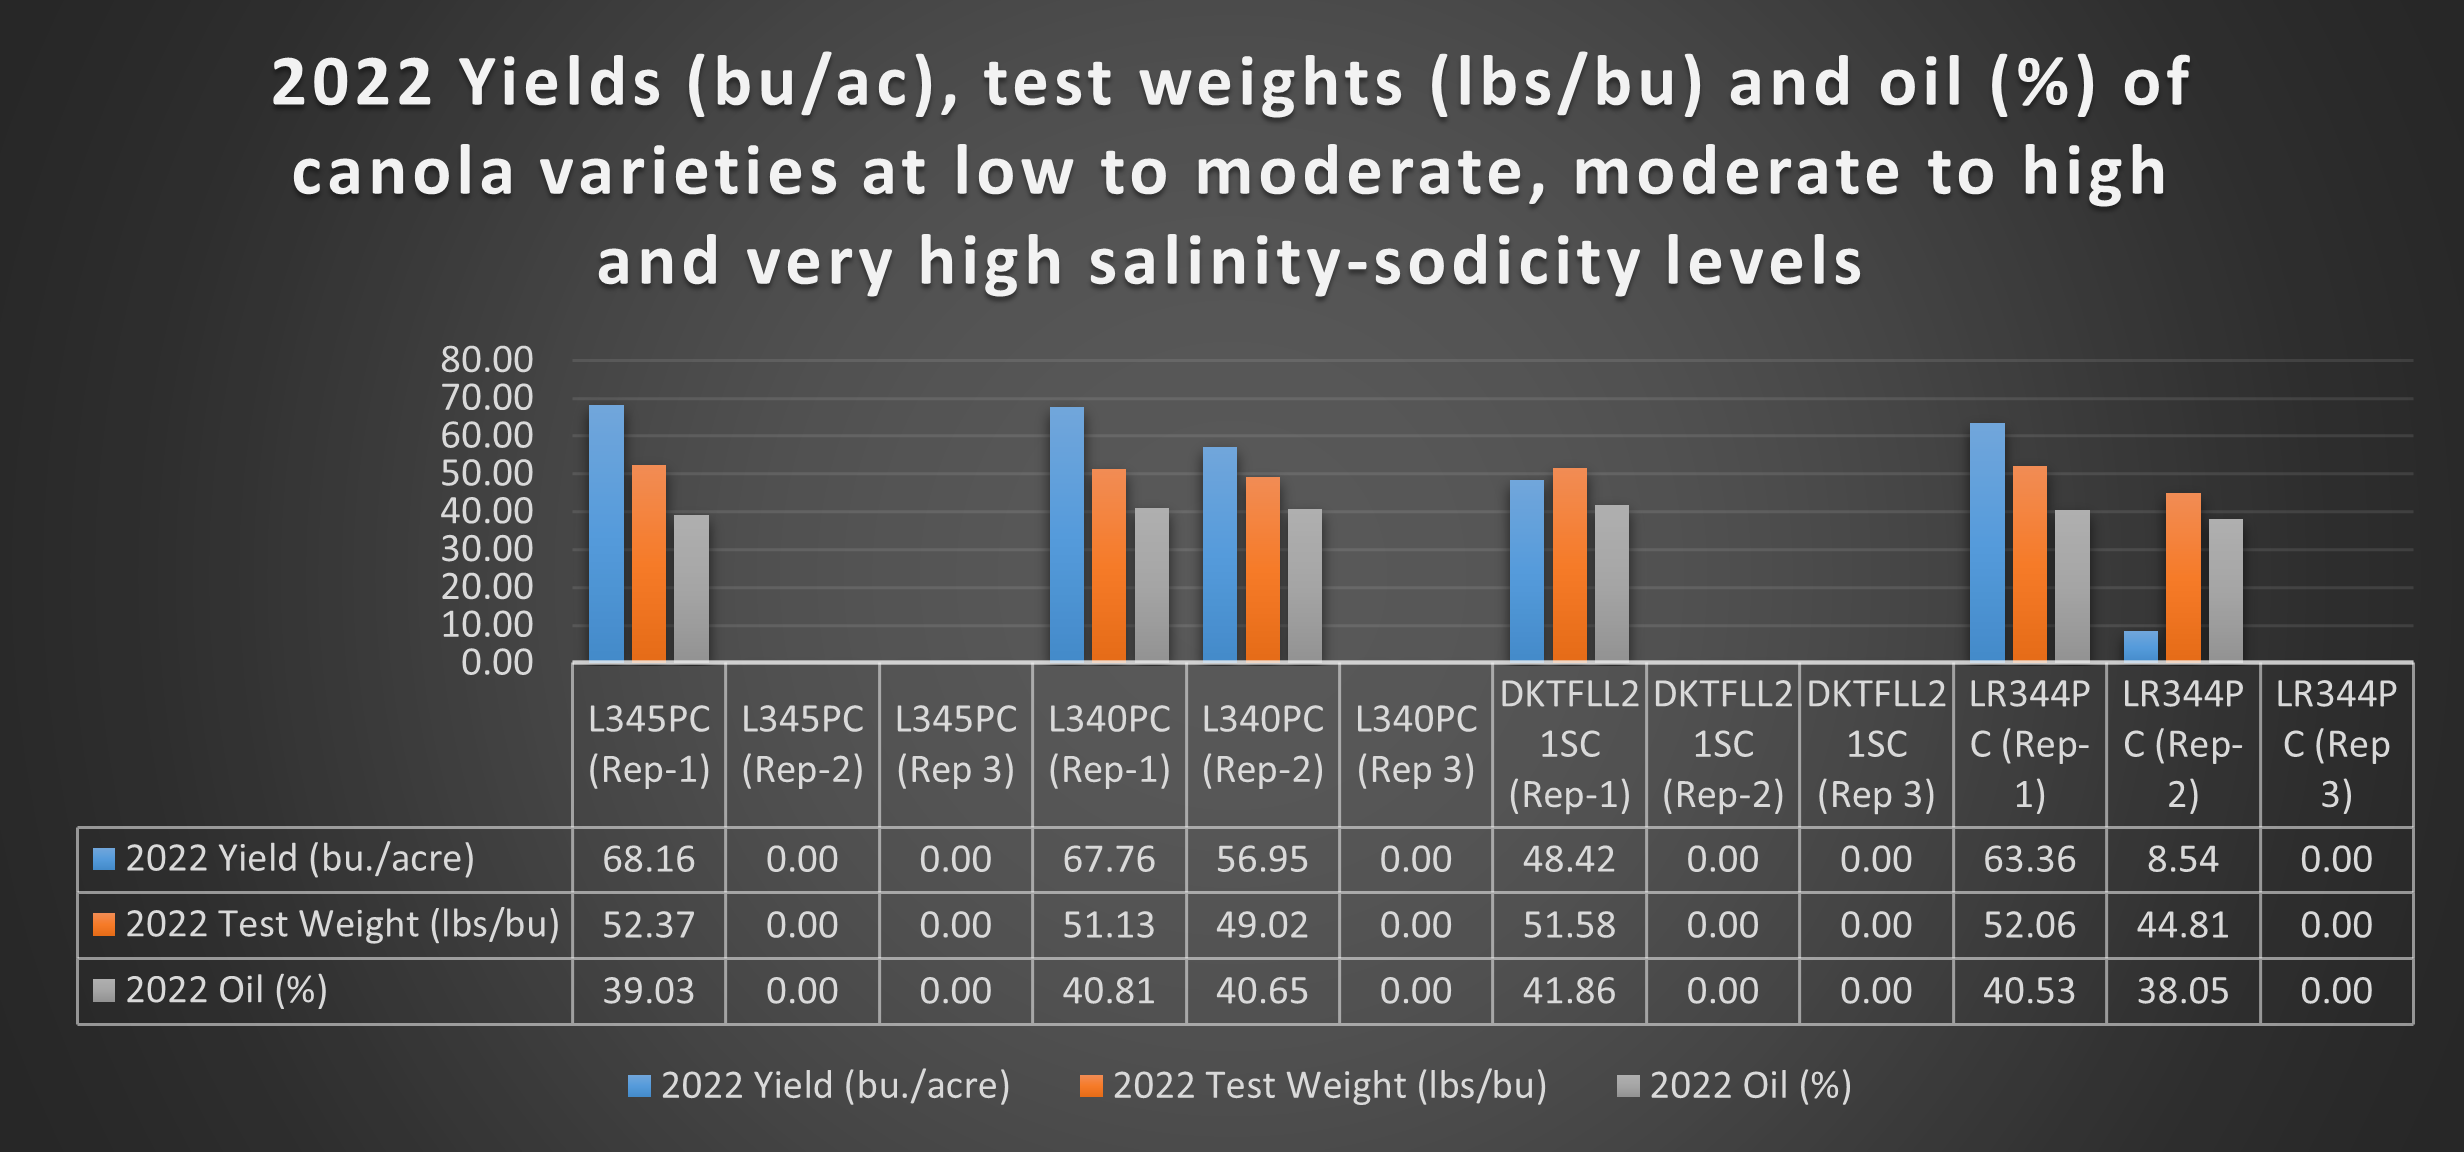
Canola
In replication 1, canola yields ranged between 48.42 to 68.16 bushels per acre (2421 to 3408 pounds per acre). In replication 2, only L340PC and LR344PC varieties produced modest yields. Replication 3 was a net loss. This was an indication that despite the high availability of soil moisture in 2022 spring and early growing-season, canola varieties performed poorly in replication 2 and 3, compared to barley and oats. Details are in Figure 3.
Figure 3. 2022 yields (bushels/acre), test weights (lbs./bushel) and oil (%) of the four canola varieties for replications 1, 2 and 3.