Studies on slow-release liquid fertilizers applied at low rates as a foliar application on North Dakota spring wheat/winter wheat
(Research Report)Two foliar experiments were conducted to determine the degree of effectiveness of timing and rate of N-Pact® (UAP product, Greeley, CO) on yield and quality of spring wheat. The experiments were: 1. N-rate and timing study on preplant urea and post-N applied at 5-6 leaf stage with N-Pact® at 2 or 3 g/acre rates; 2. N-rate and post-N study with urea applied preplant and N-Pact® applied at 3 g/a rate immediately after flowering.
Experiment 1 - Leaf Stage
N-Rate Study with N-Pact® applied at 5-6 leaf spring wheat stage
This experiment was conducted in a field of spring wheat following barley in Barnes county, T139N, R57W, section 30, in the SW ¼ of the SW ¼. The soils were Barnes loam (fine-loamy, mixed, superactive, frigid, calcic Hapludolls). Preplant urea treatments were applied 4/17. The plots were seeded by the grower-cooperator 4/30 with Glenn wheat at 1 million live seeds/a. A starter fertilizer of 11-23-0-7.5S was applied with the seed at planting. Soil tests were obtained a week before treatments were applied. The soil test results are shown below.
Preplant Soil tests for the N-Pact at 5-6 leaf spring wheat experiment, April, 2008.
|
Nitrate-N, lb/a |
P, ppm |
K, ppm |
pH |
OM, % |
Cu, ppm |
Cl, lb/a 2-feet |
|
78 |
13 |
265 |
7.0 |
3.6 |
0.6 |
23 |
The experimental design was a randomized complete block, with 18 treatments and 4 replications. The treatments are as follows:
1-Check
2-Check + 2 g/a+N-Pact
3- Check + 3 g/a N-Pact
4-30 lb N
5-30 lb N + 2g/a N-Pact 6-30 lb N + 3 g/a N-Pact 7-60 lb N
8-60 lb N + 2 g/a N-Pact 9-60 lb N + 3 g/a N-Pact 10-90 lb N
11-90 lb N + 2 g/a N-Pact 12-90 lb N + 3 g/a N-Pact 13-120 lb N
14-120 lb N + 2 g/a N-Pact 15-120 lb N + 3 g/a N-Pact 16-150 lb N
17-150 lb N + 2 g/a N-Pact 18-150 lb N + 3 g/a N-Pact
Bronate Advanced at 0.8 pt/a and Rimfire at 2.25 oz/a were applied by the grower when the wheat was about 3-leaf. Post application N-Pact treatments were made on 6/10 using 8001 nozzles to deliver a total of 10 g/a of mix at about 40 psi broadcast. The treatments were made from 9AM until Noon. Wind was NE at 10 mph. Temperature was 55 degrees F. Flag-leaf samples were obtained 7/10 from each plot by obtaining 20 flag leaves randomly from the center of each plot. The leaf samples were oven-dried, ground and analyzed for total N. The plots were harvested 8/18 using a plot combine with a 4-foot head. Alleyways were mowed about 8/4 to define plot end points without affecting wheat growth and development at the plot ends.
Results of 5-leaf foliar N-Pact® application on spring wheat after preplant N application, Valley City, ND, 2008.
|
Treatment |
Yield, bu/a |
Test Weight, lb/bu |
Leaf N, % |
Protein, % |
|
Check |
51.0 a |
61.6 |
3.0 a |
13.1 a |
|
Check +2 |
48.9 a |
61.6 |
3.0 a |
13.2 a |
|
Check +3 |
48.6 a |
61.4 |
3.1 ab |
13.2 a |
|
30 lb N |
56.6 ab |
61.5 |
3.2 ab |
13.4 a |
|
30 lb N +2 |
57.5 b |
61.8 |
3.1 ab |
13.6 b |
|
30 lb N +3 |
58.5 b |
61.6 |
3.4 ab |
13.9 bc |
|
60 lb N |
63.1 bc |
61.3 |
3.6 b |
14.2 c |
|
60 lb N +2 |
63.1 bc |
61.1 |
3.4 ab |
14.4 c |
|
60 lb N +3 |
65.6 cd |
61.1 |
3.7 b |
14.3 cd |
|
90 lb N |
70.3 cd |
61.4 |
3.8 b |
14.8 d |
|
90 lb N +2 |
68.4 cd |
60.9 |
3.8 b |
14.7 d |
|
90 lb N +3 |
70.7 d |
62.1 |
3.7 b |
14.7 d |
|
120 lb N |
68.4 cd |
61.5 |
3.9 b |
15.3 e |
|
120 lb N +2 |
70.2 cd |
61.5 |
3.2 ab |
15.0 e |
|
120 lb N +3 |
68.8 cd |
61.6 |
3.9 b |
15.1 e |
|
150 lb N |
71.5 d |
61.4 |
3.8 b |
15.3 e |
|
150 lb N +2 |
70.8 d |
61.4 |
4.0 b |
15.2 e |
|
150 lb N +3 |
73.2 d |
61.9 |
3.8 b |
15.3 e |
|
LSD 5% |
6.5 |
NS |
0.5 |
0.5 |
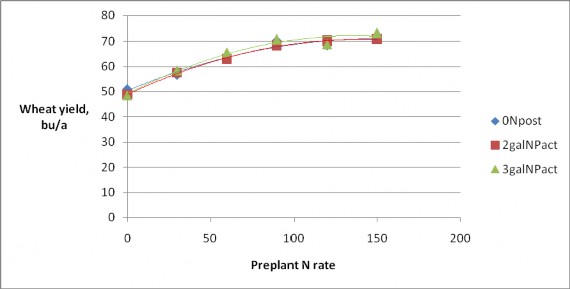
There was an increase in wheat yield with N rate. There was not an increase in wheat yield with the addition of 2-3 g/a of N-Pact at any N rate. The graph of preplant N rate and yield shows that the response curves for the without, 2 and 3 g/a N-Pact post at 5 leaf are very similar. There is a slight visual separation between the 3 g/a curve and the other curves, but these differences are not significant.
In support of the wheat response, the flag-leaf N response and protein response is similar. There are increases in flag-leaf N and protein with N rate, but there is no added effect of the N-Pact application in significant differences within N-rate treatment.
Experiment 2 - Flower Stage
Experiment 2. Application of N-Pact® at flowering at 3 gal/acre rate.
This experiment, which tested the effect of N-Pact at the 3 g/a rate applied immediately after flowering, was conducted in Barnes county in the same area as the first study. The soils were similar, also a Barnes loam on 2007 barley stubble. Soil tests are shown below-
Soil tests for the N-Pact immediately after spring wheat flower experiment, April, 2008.
|
Nitrate-N, lb/a |
P, ppm |
K, ppm |
pH |
OM, % |
Cu, ppm |
Cl, lb/a 2-feet |
|---|---|---|---|---|---|---|
|
37 |
13 |
265 |
7.0 |
3.6 |
0.6 |
23 |
Preplant treatments were applied 4/16. The plots were seeded by the grower-cooperator 4/30 using Glenn spring wheat at 1 million live seeds/a. Bronate Advanced at 0.8 pt/a and Rimfire at
2.24 oz/a were applied for weed control at the 3-leaf stage. Weed control was excellent throughout the season. The N-Pact treatment of 3 g/a was applied to a total mix with water to equal a 10 g/a application rate. The application was made on 7/10 from noon to 3 PM, with a west wind at 5-10 mph. Individual plot size was 8 feet wide and 20 feet long. A 5-foot alleyway separated blocks of treatments in the randomized complete block design. There were 12 treatments and 4 replications.
Treatments are as follows-
Check
Check + N-Pact 30 lb N
30 lb N + N-Pact 60 lb N
60 lb N + N-Pact 90 lb N
90 lb N + N-Pact 120 lb N
120 lb N + N-Pact 150 lb N
150 lb N + N-Pact
The plots were harvested 8/18 using a combine with a 4-foot header.
The application of N-Pact at 3 g/a increased wheat yield at the check level and at the 90 lb N level. The increase was not consistent across N rates. N rate itself increased yield consistent with each incremental increase up to the 120 lb N/a rate. Protein also increased with N-rate to the 120 lb N/a treatment. N-Pact application increased protein within N rate at the 30 lb N/a rate and the 120 lb N/a rate.
Results of post-flower treatment with 3 g/a N-Pact® on spring wheat, Valley City, ND, 2008.
|
Treatment |
Yield, bu/a |
Test Weight, lb/bu |
Protein, % |
|---|---|---|---|
|
Check |
47.0 a |
61.0 |
13.5 a |
|
Check +NP |
52.4 b |
61.0 |
13.3 a |
|
30 lb N |
53.9 b |
61.6 |
13.1 a |
|
30 lb N + NP |
53.4 b |
61.8 |
13.7 ab |
|
60 lb N |
60.1 c |
61.6 |
14.0 b |
|
60 lb N + NP |
58.7 c |
61.5 |
14.0 b |
|
90 lb N |
59.8 c |
60.4 |
14.3 bc |
|
90 lb N + NP |
62.8 d |
60.3 |
14.4 c |
|
120 lb N |
62.3 d |
61.3 |
14.5 c |
|
120 lb N + NP |
64.8 d |
60.7 |
14.9 d |
|
150 lb N |
64.7 d |
60.6 |
15.1 d |
|
150 lb N + NP |
63.2 d |
60.3 |
14.8 d |
|
LSD 5% |
4.5 |
NS |
0.3 |

immediately after flowering
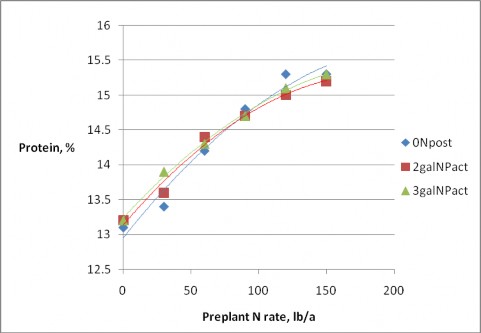
The graph of protein vs N rate at 0 and 3 g/a N-Pact immediately after flowering shows a small advantage to N-Pact over preplant only at nearly all N-rates. However, the average incremental increase over each N-rate is about 0.1 %. The current NDSU recommendation for protein enhancement is the application of 30 lb N/a immediately following flowering for a protein enhancement average of 0.5%. This increase with the amount of N applied is close to that recommendation scale.
S
Summary of N-Pact® studies, 2008-
N-Pact® at 5-leaf stage- There were no significant differences within N level for the application of 2-3 g/a N-Pact at the 5-leaf stage. No differences were observed in yield, flag-leaf N or protein.
N-Pact® immediately after flowering- There were significant differences in both yield and protein at lower N rates. Impact on yield was seen in lower N rates. Protein response averaged about 0.1% for the 3 g/a rate applied, which is within the range of expectations based on 28% post-anthesis research recently conducted at Carrington, Minot and Langdon.
Summary of GP studies on barley, spring wheat and soybean