2025: Salt and Sodicity Tolerance of Barley, Oat and Spring Wheat
(Research Report, Langdon REC, December 2025)Barley and oats are among the most salt and sodicity tolerant annual crops producers can profitably grow in North Dakota. However, at elevated levels of salinity and sodicity levels, even barley and oats can result in significant yield losses, especially in the top six inches of the soils. To establish the economic threshold of soil salinity (Electrical Conductivity or EC) and sodicity (Sodium Adsorption Ratio or SAR) for barley, oats and other major annual crops, four barley and four oat varieties were planted at the Langdon REC site in 2025 at three different levels of soil salinity and sodicity. This trial demonstration was a continuation of studies conducted from 2020 to 2024. Additionally, four Hard Red Spring Wheat (HRSW) varieties were added in 2025 to compare salinity and sodicity tolerances of spring wheat versus barley and oat crops.
Soil Analysis Results
Composite soil samples, each two feet deep and divided into 0-6-inch and 6–24-inch depths, were collected from every salinity and sodicity level on May 2, 2025. Three cores were taken for each sample at each level. Level 1 exhibited low to moderate salinity and sodicity; Level 2 showed moderate to high levels; and Level 3 contained very high salinity and sodicity—determined according to soil EC and SAR readings from the 0–6-inch depth. These classifications reflect the tolerances of annual crops such as barley and oats, rather than more sensitive crops like soybeans. To analyze soil EC and SAR, the saturated paste extract method was used (see Table 1).
Table 1. The 2020-2025 soil EC and SAR results of the three levels for the 0-6- and 6-24-inch depths.
|
| EC (dS/m) | SAR | ||||||||||
|---|---|---|---|---|---|---|---|---|---|---|---|---|---|
Site | Depth (in.) | 2020 | 2021 | 2022 | 2023 | 2024 | 2025 | 2020 | 2021 | 2022 | 2023 | 2024 | 2025 |
Level 1 | 0-6 | 3.99 | 4.63 | 1.64 | 5.44 | 3.90 | 3.66 | 7.12 | 6.20 | 4.95 | 6.68 | 4.37 | 2.90 |
6-24 | 7.32 | 7.49 | 6.70 | 8.02 | 6.57 | 5.88 | 15.05 | 14.72 | 15.50 | 12.52 | 16.05 | 7.69 | |
Level 2 | 0-6 | 7.80 | 13.20 | 7.92 | 10.30 | 7.40 | 7.78 | 18.13 | 22.88 | 16.28 | 17.07 | 18.18 | 9.41 |
6-24 | 10.39 | 12.29 | 11.03 | 12.27 | 10.21 | 11.75 | 20.92 | 21.14 | 39.54 | 19.12 | 28.93 | 17.16 | |
Level 3 | 0-6 | 10.50 | 14.90 | 11.21 | 11.99 | 9.37 | 8.78 | 27.30 | 32.74 | 30.00 | 22.06 | 28.87 | 14.04 |
6-24 | 9.86 | 12.98 | 11.10 | 11.44 | 12.32 | 15.20 | 32.87 | 32.04 | 31.83 | 22.32 | 37.91 | 25.67 | |
The main difference between the three levels was Level 1 soils had low to moderate salinity and sodicity in the top 0-6 inches, while Levels 2 and 3 showed higher levels at both 0-6- and 6-24-inch depths. The 6-24-inch depth of Level 1 had moderate to high salinity and sodicity levels. Results from 2020-2025 suggest that surface salinity and sodicity (0-6 inches) have a greater impact on germination, stands, yields, and quality than those in deeper layers.
Soil EC levels in Level 1 in 2020-21 and 2023-25 remained fairly consistent, moderately high in the 0-6-inch depths except in 2022. Dry conditions in 2023 led to the highest EC readings in this layer, but increased rainfall during 2024 brought a slight drop compared to 2023. In both 2022 and 2024, lower EC paired with higher moisture early in the season, as well as frequent showers during 2025, improved germination, plant stands, and yields—even where salinity and sodicity were higher—compared to 2020, 2021, and 2023. The 6–24-inch soil depth EC levels in Level 1 remained high across crops from 2020-25. Soil sodicity levels in the Level 1 0–6-inch soil depth remained low most years, while the 6–24-inch sodicity levels in Level 1 remained high in most years except 2025. Level 2 0–6-inch salinity and sodicity levels remained high and 6-24 inch levels of salinity and sodicity were very high in most years. Level 3 salinity and sodicity levels were very high in the 0–6-inch depth, while 6-24-inch salinity levels were high and sodicity levels were very high through most years.
Annual snowfall, spring-melt and rainfall during spring and the early growing season influenced salinity and sodicity levels particularly in the top 0-6 inch of the soil. Weather patterns in 2020 were dry for the Langdon area, 2021 was normal (spring and early growing-season), 2022 was normal with frequent rains during spring and early growing-season, 2023 reverted to dry conditions, 2024 was very wet and 2025 resembled 2022 with rain amounts close to normal with increased frequency during the growing season. Details of rain versus normal and potential evapotranspiration are given in Figure 1.
Figure 1. Annual 2020-2025 North Dakota Agricultural Weather Network (NDAWN) Langdon station rainfall, evapotranspiration (Penman) and normal rainfall for the periods of April 1 to October 31.
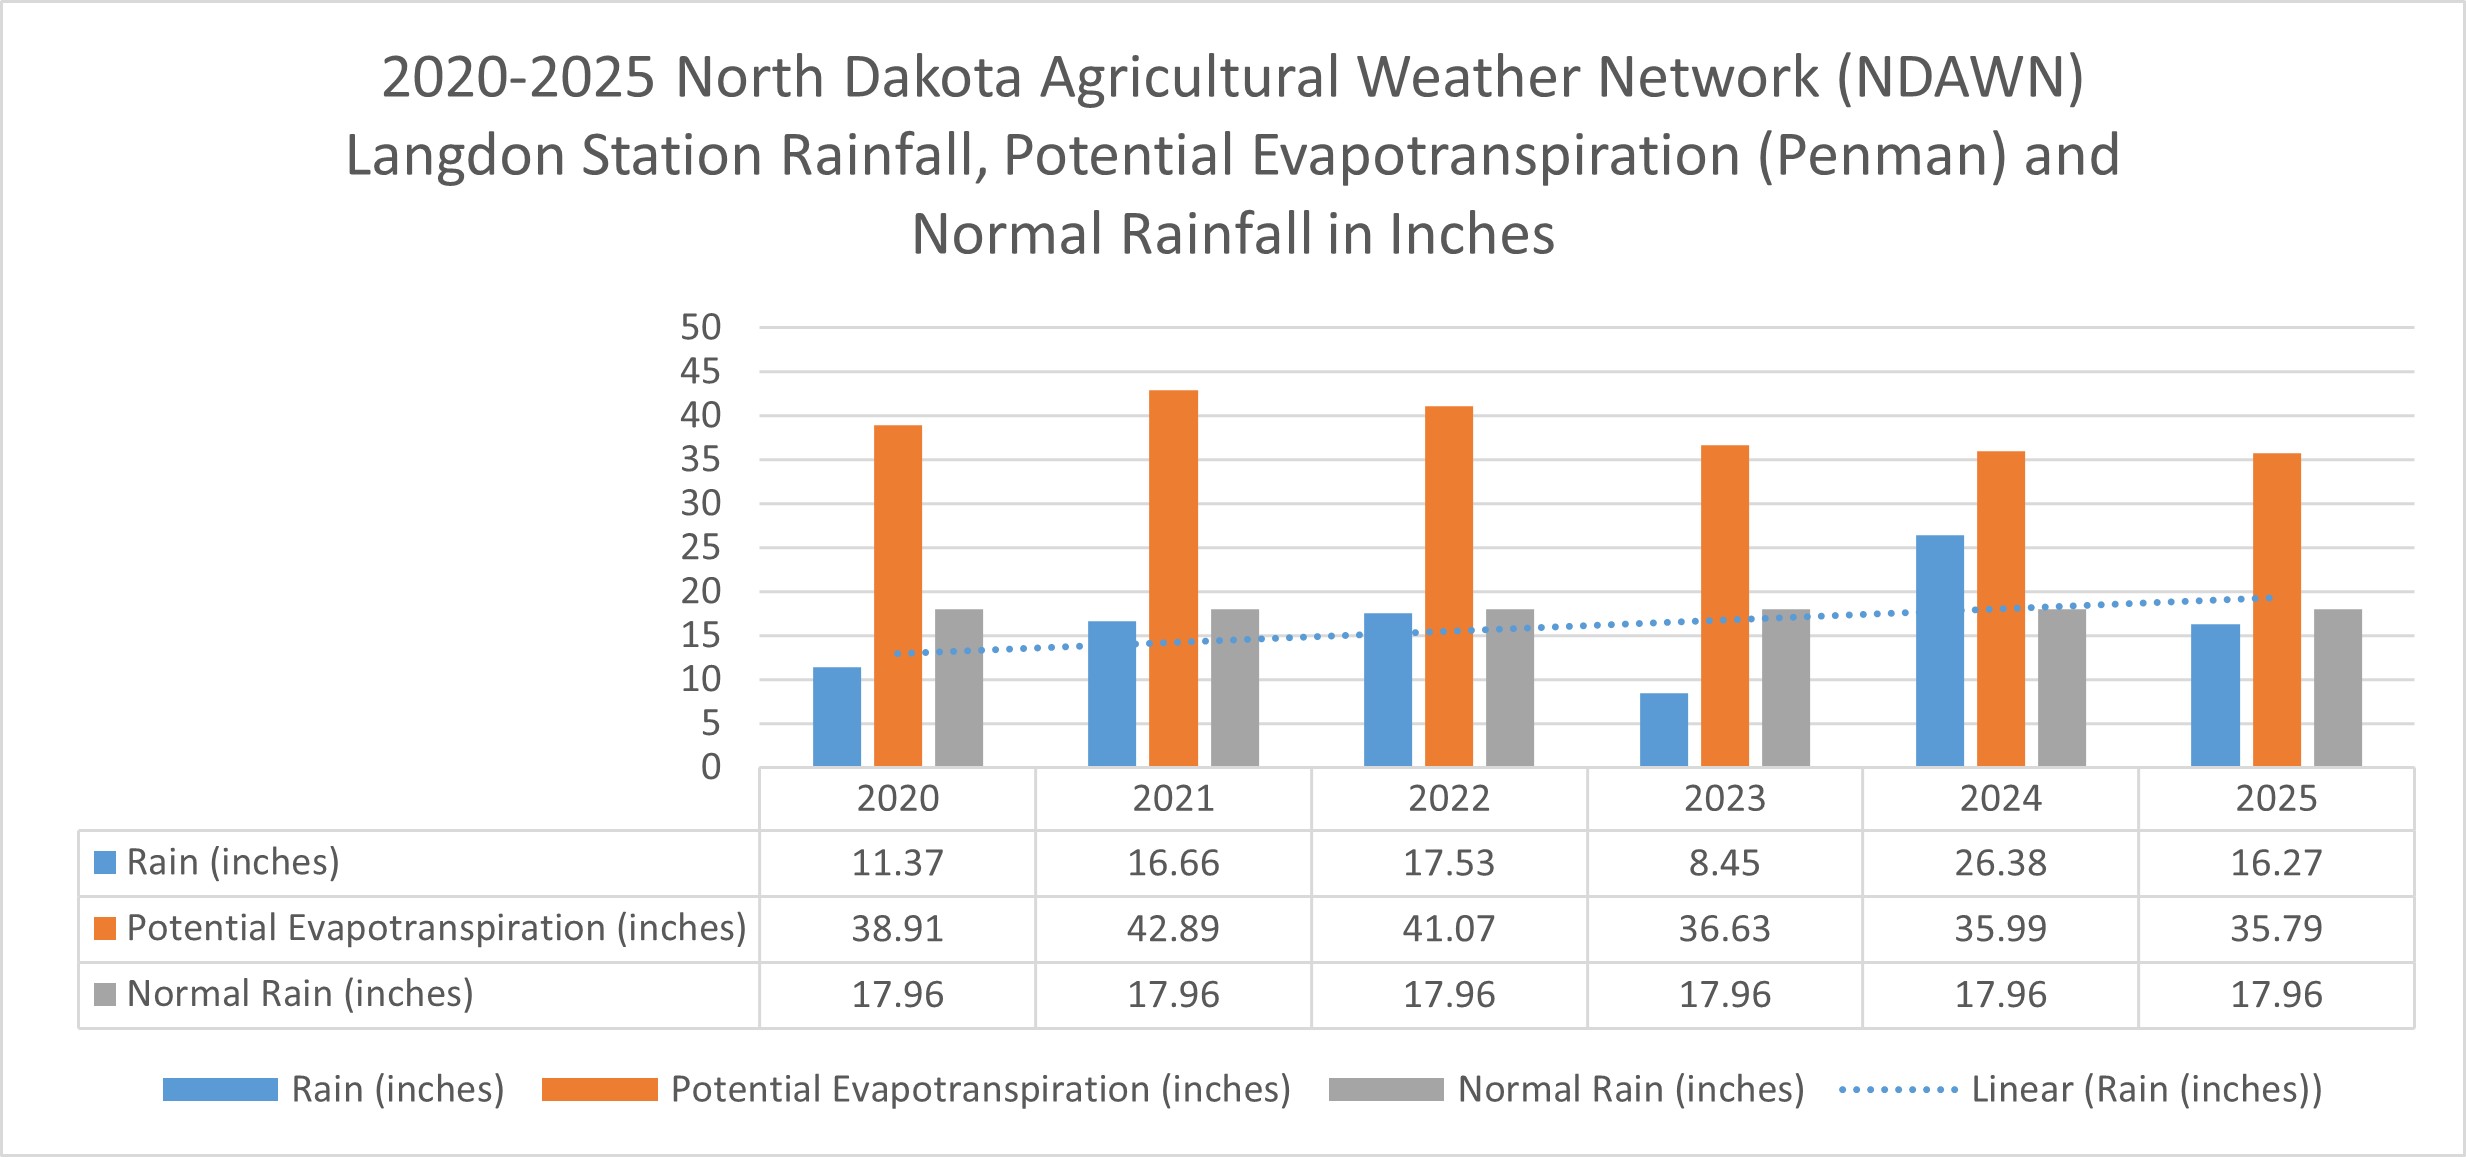
It's crucial to distinguish between timely rain that creates ideal soil moisture and excessive rainfall that leads to saturated, cool soils and flooded areas, especially during germination and other critical growth periods. In 2022, frequent light showers produced optimal soil conditions, whereas in 2024, infrequent but heavy rainfall resulted in saturated, cooler soils and some drowned-out patches. The weather in 2025 was more like 2022, with similar frequent light showers, although total rainfall during the growing season was a bit lower than normal.
Plot Sizes, Planting and Harvesting Details
Table 2. 2025 crop, variety, planting date, seeding rates and depth, fertilizer rate and harvest date information.
Crop | Variety | Planting Date | Seeding Rates (live seeds/acre) | Seeding Depth (inches) | Fertilizer Application (lbs./acre) | Harvest Dates |
|---|---|---|---|---|---|---|
2025 Planting Details | ||||||
Barley | AAC Synergy (2-row) | May 31, 2025 | 1.2 million | 1 to 1.5 | Based on soil fertility results, a uniform rate of 130 pounds of N per acre (282 pounds of Urea per acre) was applied to all three levels. | All barley, oat and wheat plots in level 1, 2 and 3 were straight combined on September 24, 2025.
|
Firefoxx (2-row) | ||||||
ND Treasure (6-row) | ||||||
Tradition (6-row) | ||||||
Oat | Newburg | |||||
Hifi | ||||||
Rockford | ||||||
ND Spilde | ||||||
Wheat | Faller | |||||
ND Stampede | ||||||
ND Horizon | ||||||
ND Heron | ||||||
Plot sizes were 4.5 X 22 feet. Harvested plot sizes were slightly smaller as they were trimmed during the growing-season. Planting and harvest details are in Table 2.
Results and Discussion
Similar to 2020-2024, the three levels showed variations between seedbed, germination, plant growth and vigor, maturity, yield, and quality in 2025.
Differences in Seedbed
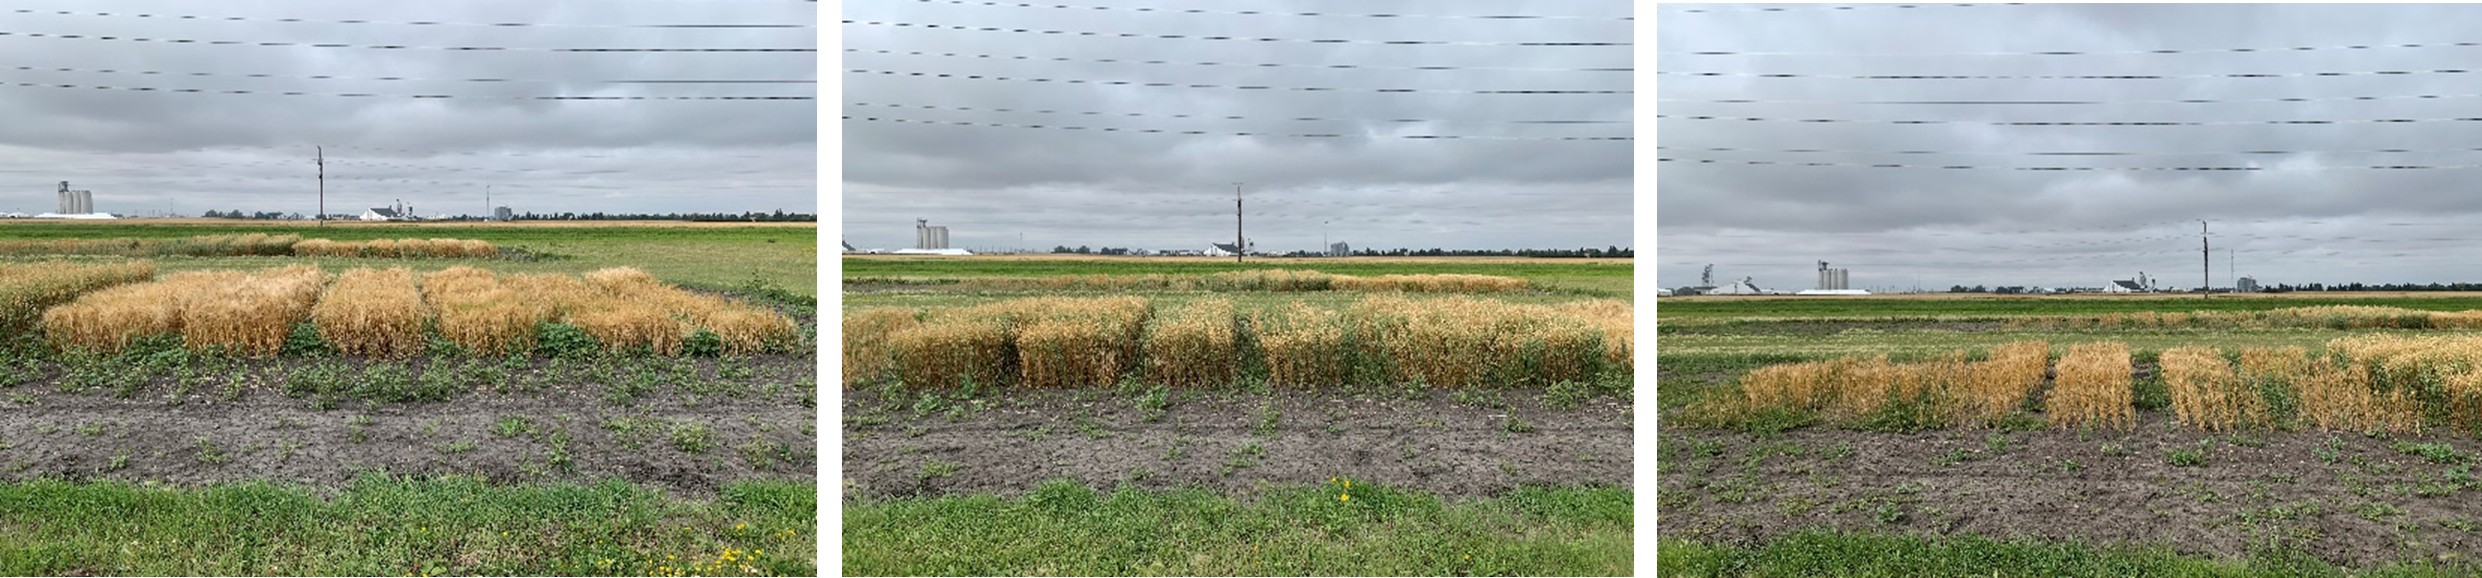
As in previous years, the seedbed was rough and cloddy in areas with higher soil sodicity (Levels 2 and 3) compared to areas with low sodicity (Level 1) in the surface layers. This effect has been decreasing every year due to continuous tillage, but was still noticeable in 2025. An increase in soil sodicity results in wet, saturated and drowned out areas after light to heavy rains that effects readiness for tillage and planting. On May 29, 2025 the low to moderate sodicity areas were fully ready for field work, while moderate to very high levels stayed wet and cloddy. See seedbed pictures 1–3 for comparison.
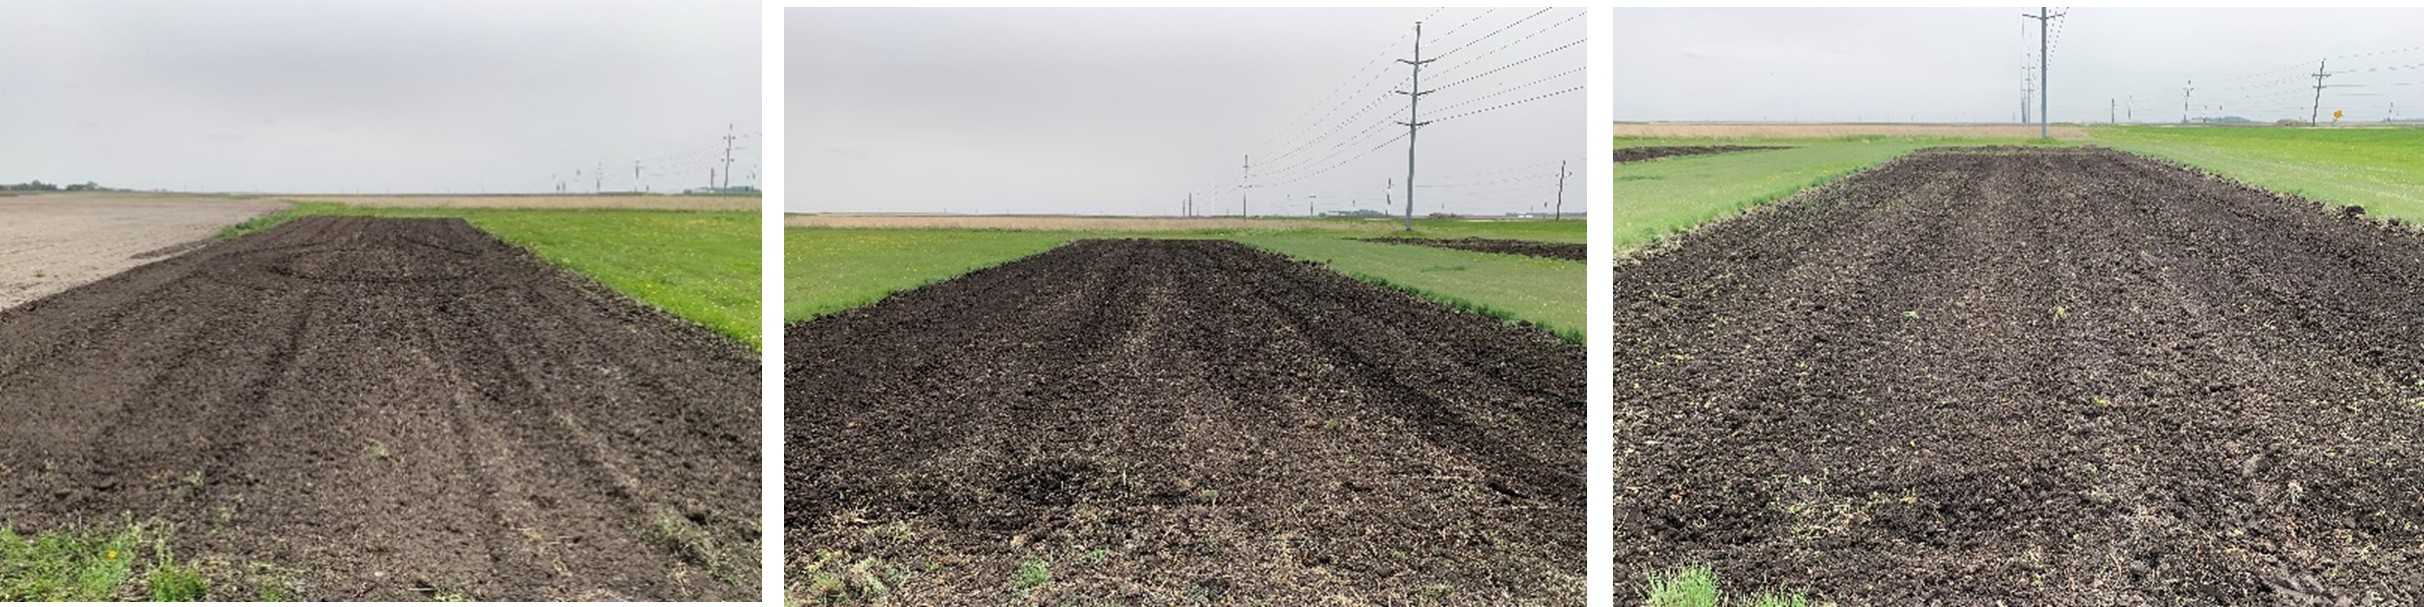
Pictures 1-3 from left to right: Differences in seedbed between Level 1 (low to moderate salinity-sodicity on the left), 2 (moderate to high salinity-sodicity in the middle) and 3 (very high salinity-sodicity on the right) on May 29, 2025.
Differences in Germination
Level 1 and 2 plots germinated in 7–8 days, while Level 3 took 2–3 days more. In 2025, frequent light rains provided optimal soil moisture, speeding up germination across all salinity levels compared to dry years. Barley germinated first, then oats, and finally wheat, each separated by one or two days.
Differences in Growth, Vigor, Stands and Maturity
Barley initially outperformed oats, but oats eventually matched its growth. Spring wheat lagged slightly behind barley. All three crops had very good germination and vigor in Level 1. In Level 2, barley and oats remained vigorous, but less than in Level 1, while wheat was weaker. In Level 3, barley plot still looked decent, oat looked better than wheat, while wheat had very poor growth and vigor in Level 3. Barley and oat plots had minor lodging in Level 1 while Level 2 and Level 3 plots had none. See pictures 4-12 showing barley, oat and wheat crop stands growing in Level 1, Level 2 and Level 3 on September 2, 2025.
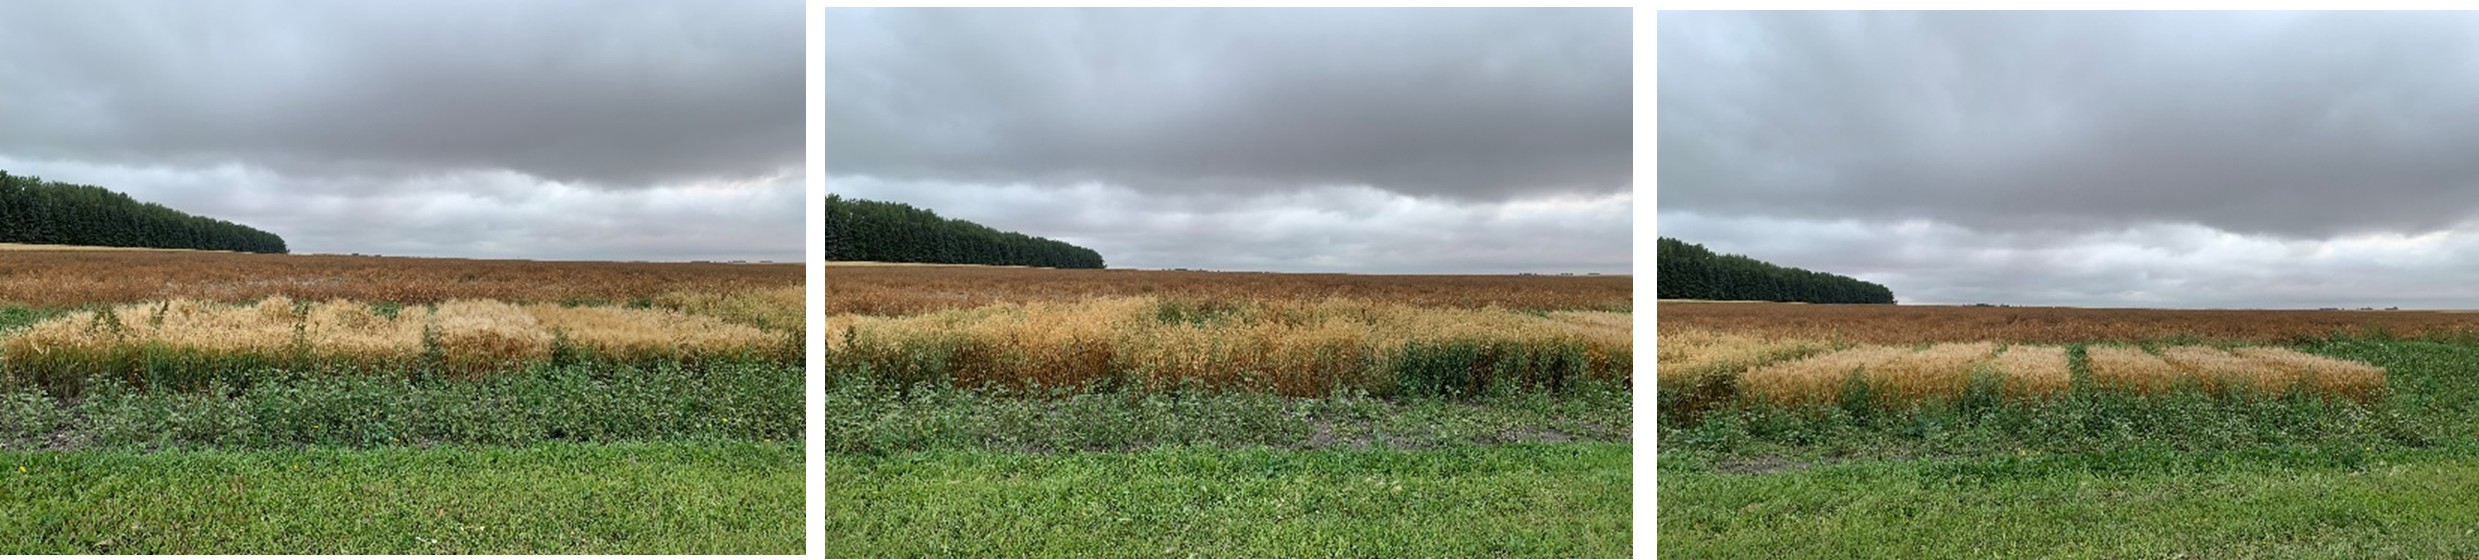
Picture 4-6. Barley (left), oat (middle) and spring wheat (right) varieties growing in Level 1 on September 2, 2025.
Picture 7-9. Barley (left), oat (middle) and spring wheat (right) varieties growing in Level 2 on September 2, 2025.
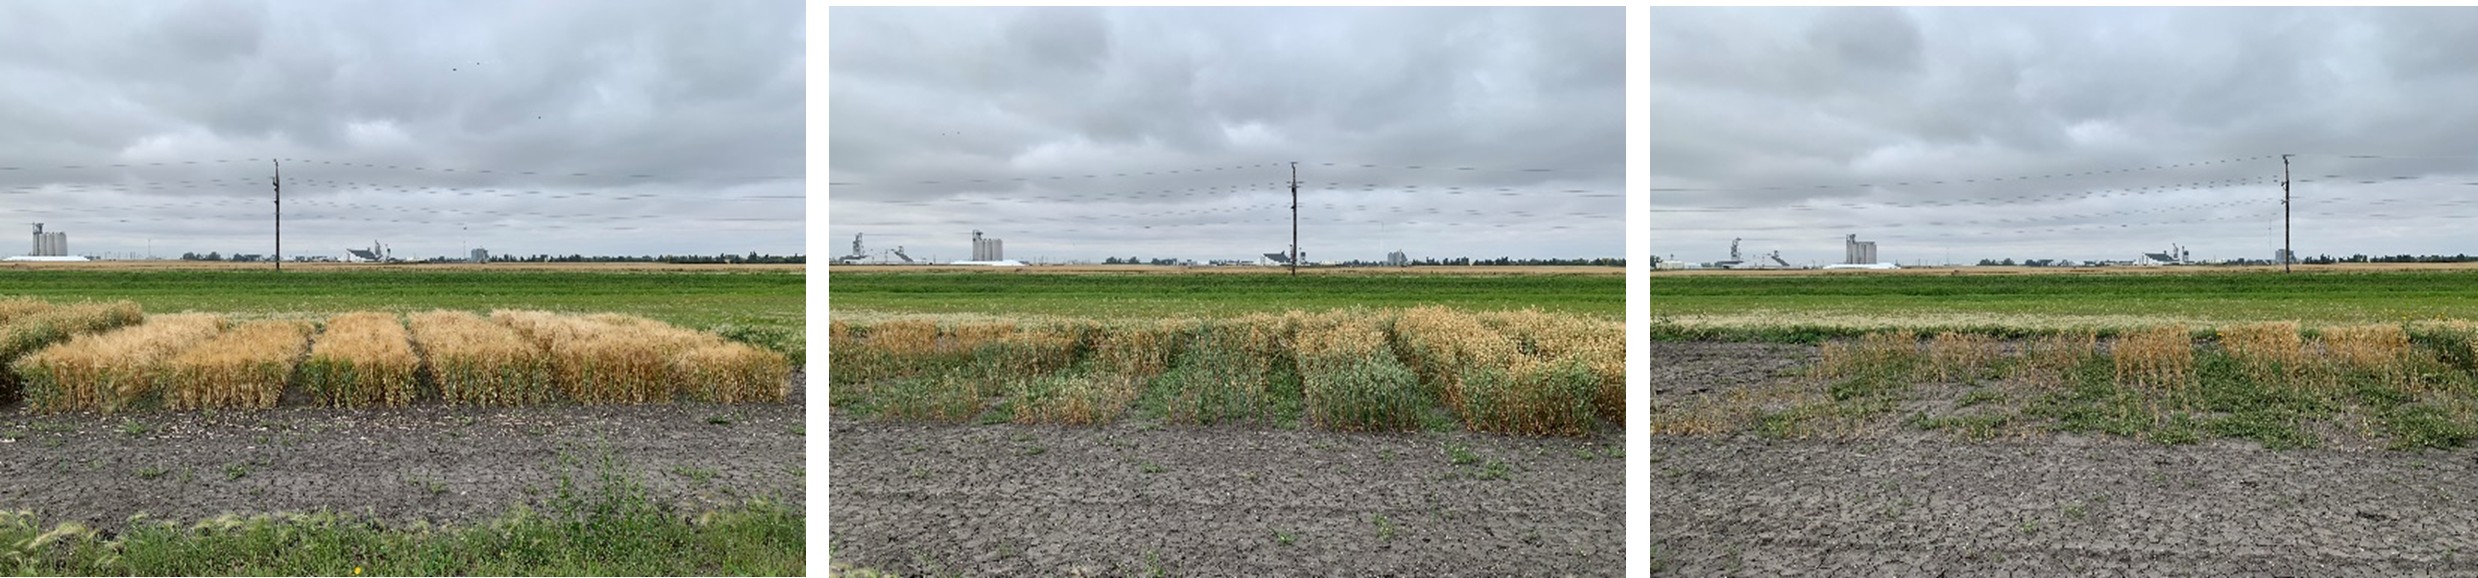
Picture 10-12. Barley (left), oat (middle) and spring wheat (right) varieties growing in Level 3 on September 2, 2025.
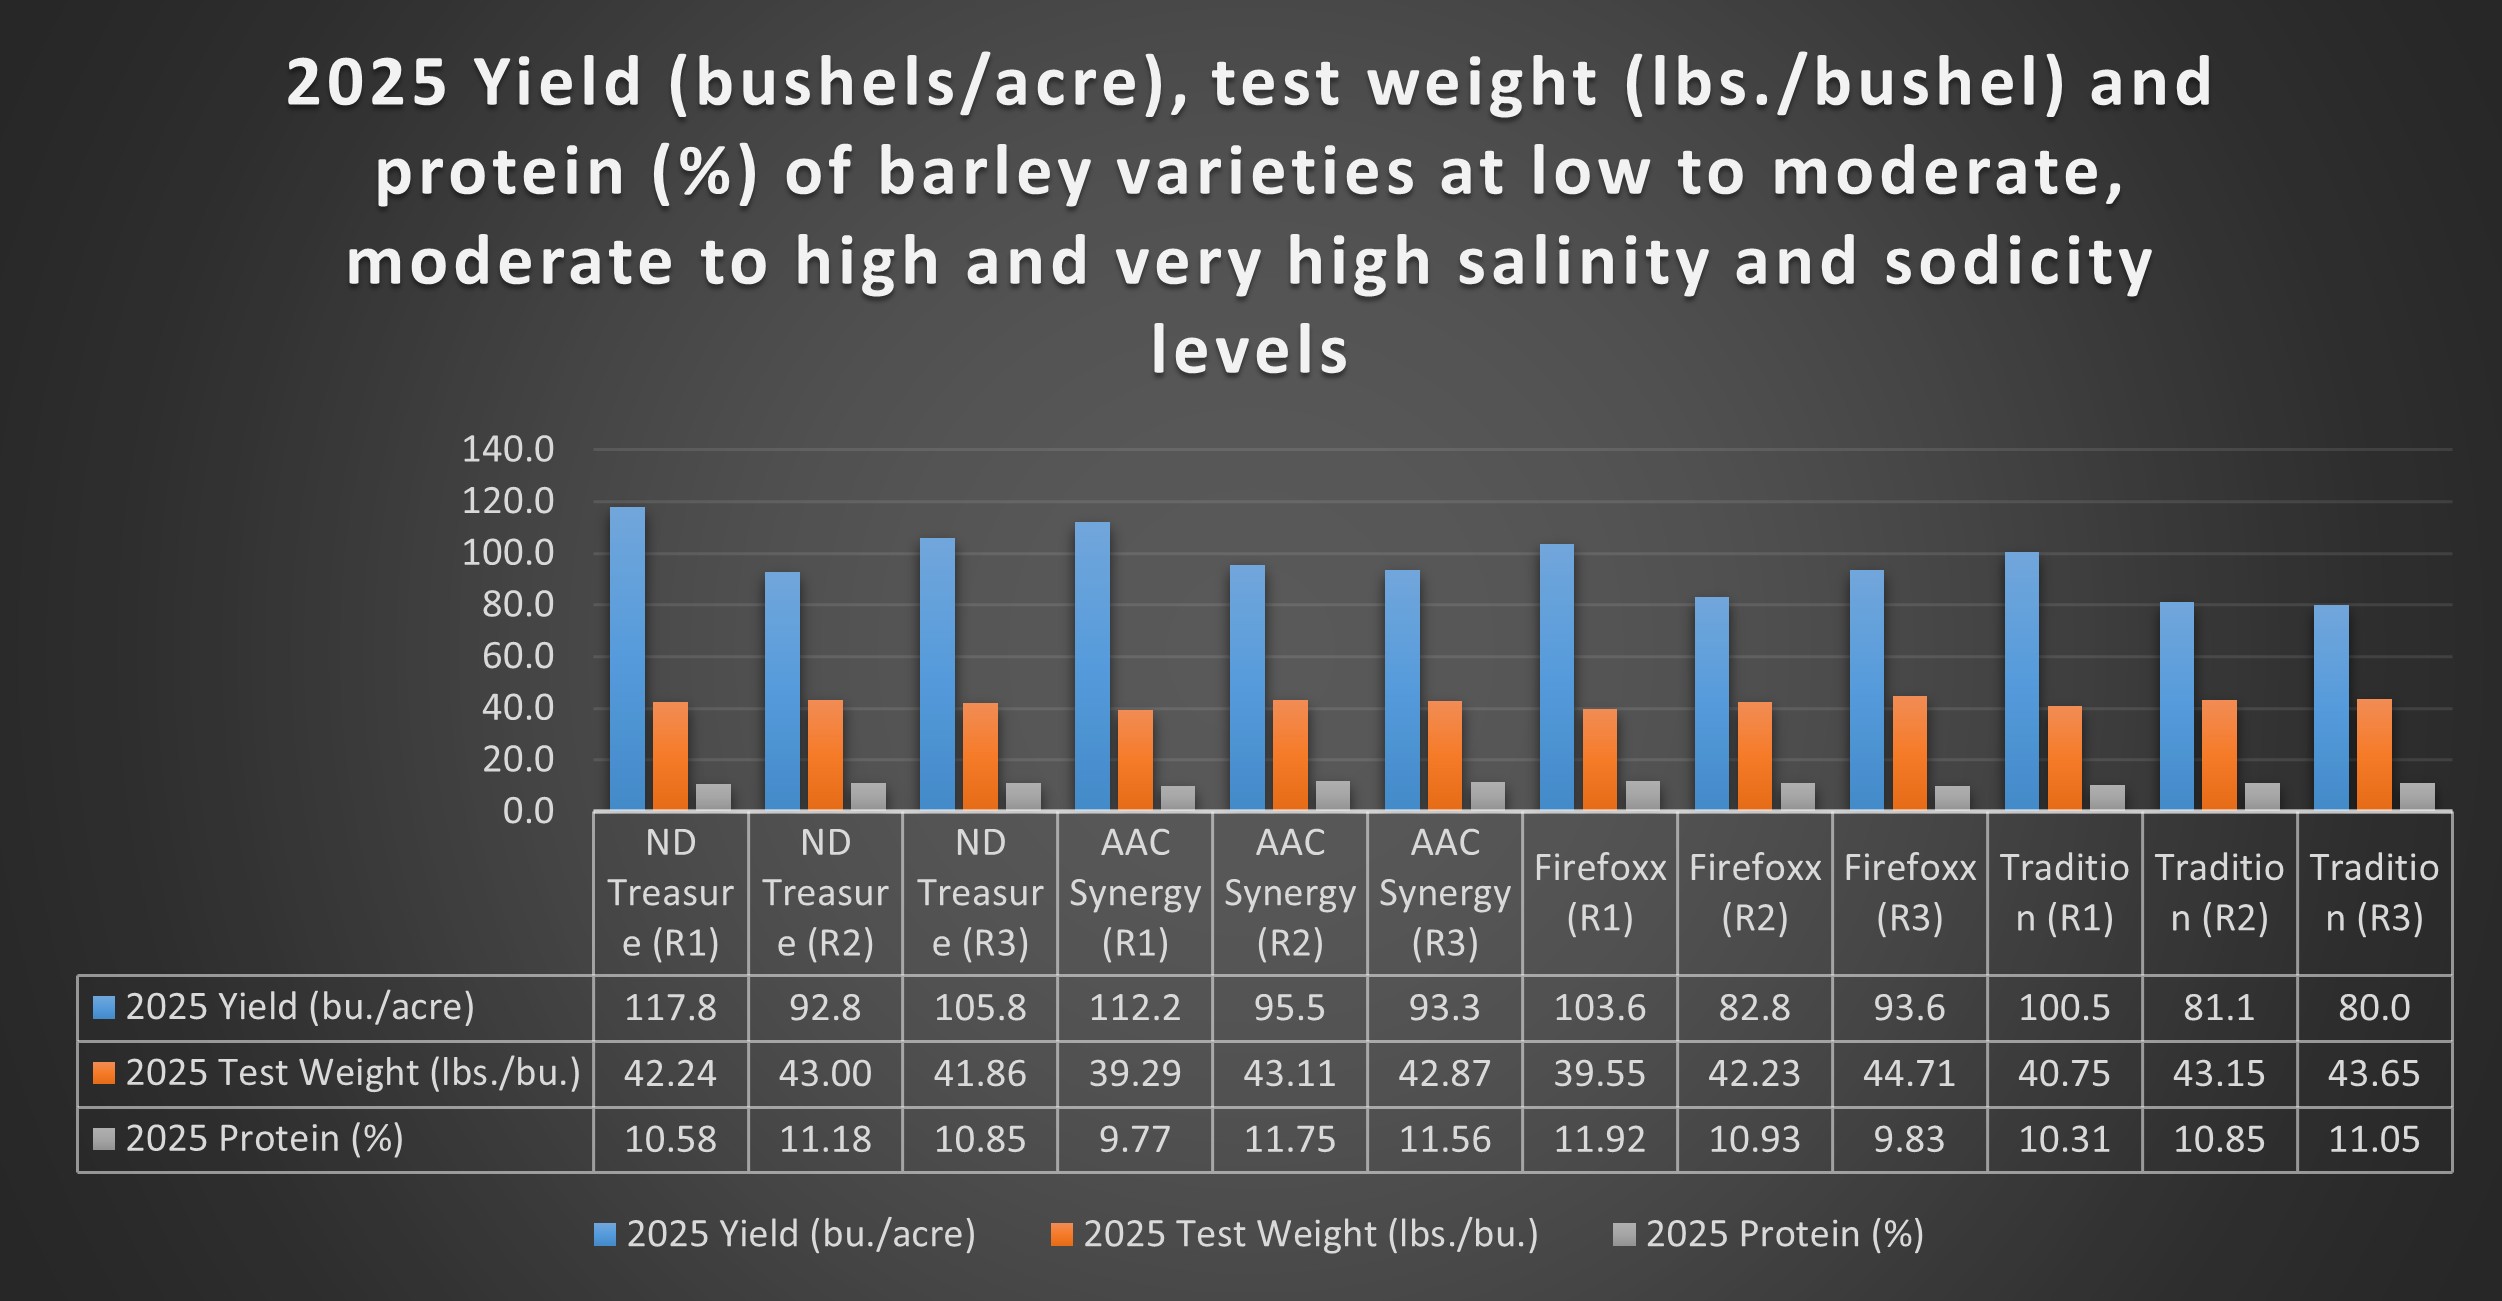
In 2025, all four barley varieties produced high yields in Level 1 (100.6 to 117.8 bushels/acre). Yields in Level 2 barley varieties were also very good compared to Level 1 (81.1 to 95.5 bushels/acre) with an average yield reduction of 18.9%, from Level 1, an improvement over previous years. Level 3 barley yields were also very high compared to past years with an average reduction in yield of 14.3% compared to Level 1. ND Treasure and Firefoxx varieties performed better in Level 3 versus Level 2 (13.6%), whereas AAC Synergy and Tradition had a slight decrease in yield in Level 3 compared to Level 2 (1.8%). Details are in Figure 2.
Figure 2. 2025 yield, test weight and protein of four barley varieties.
Oats
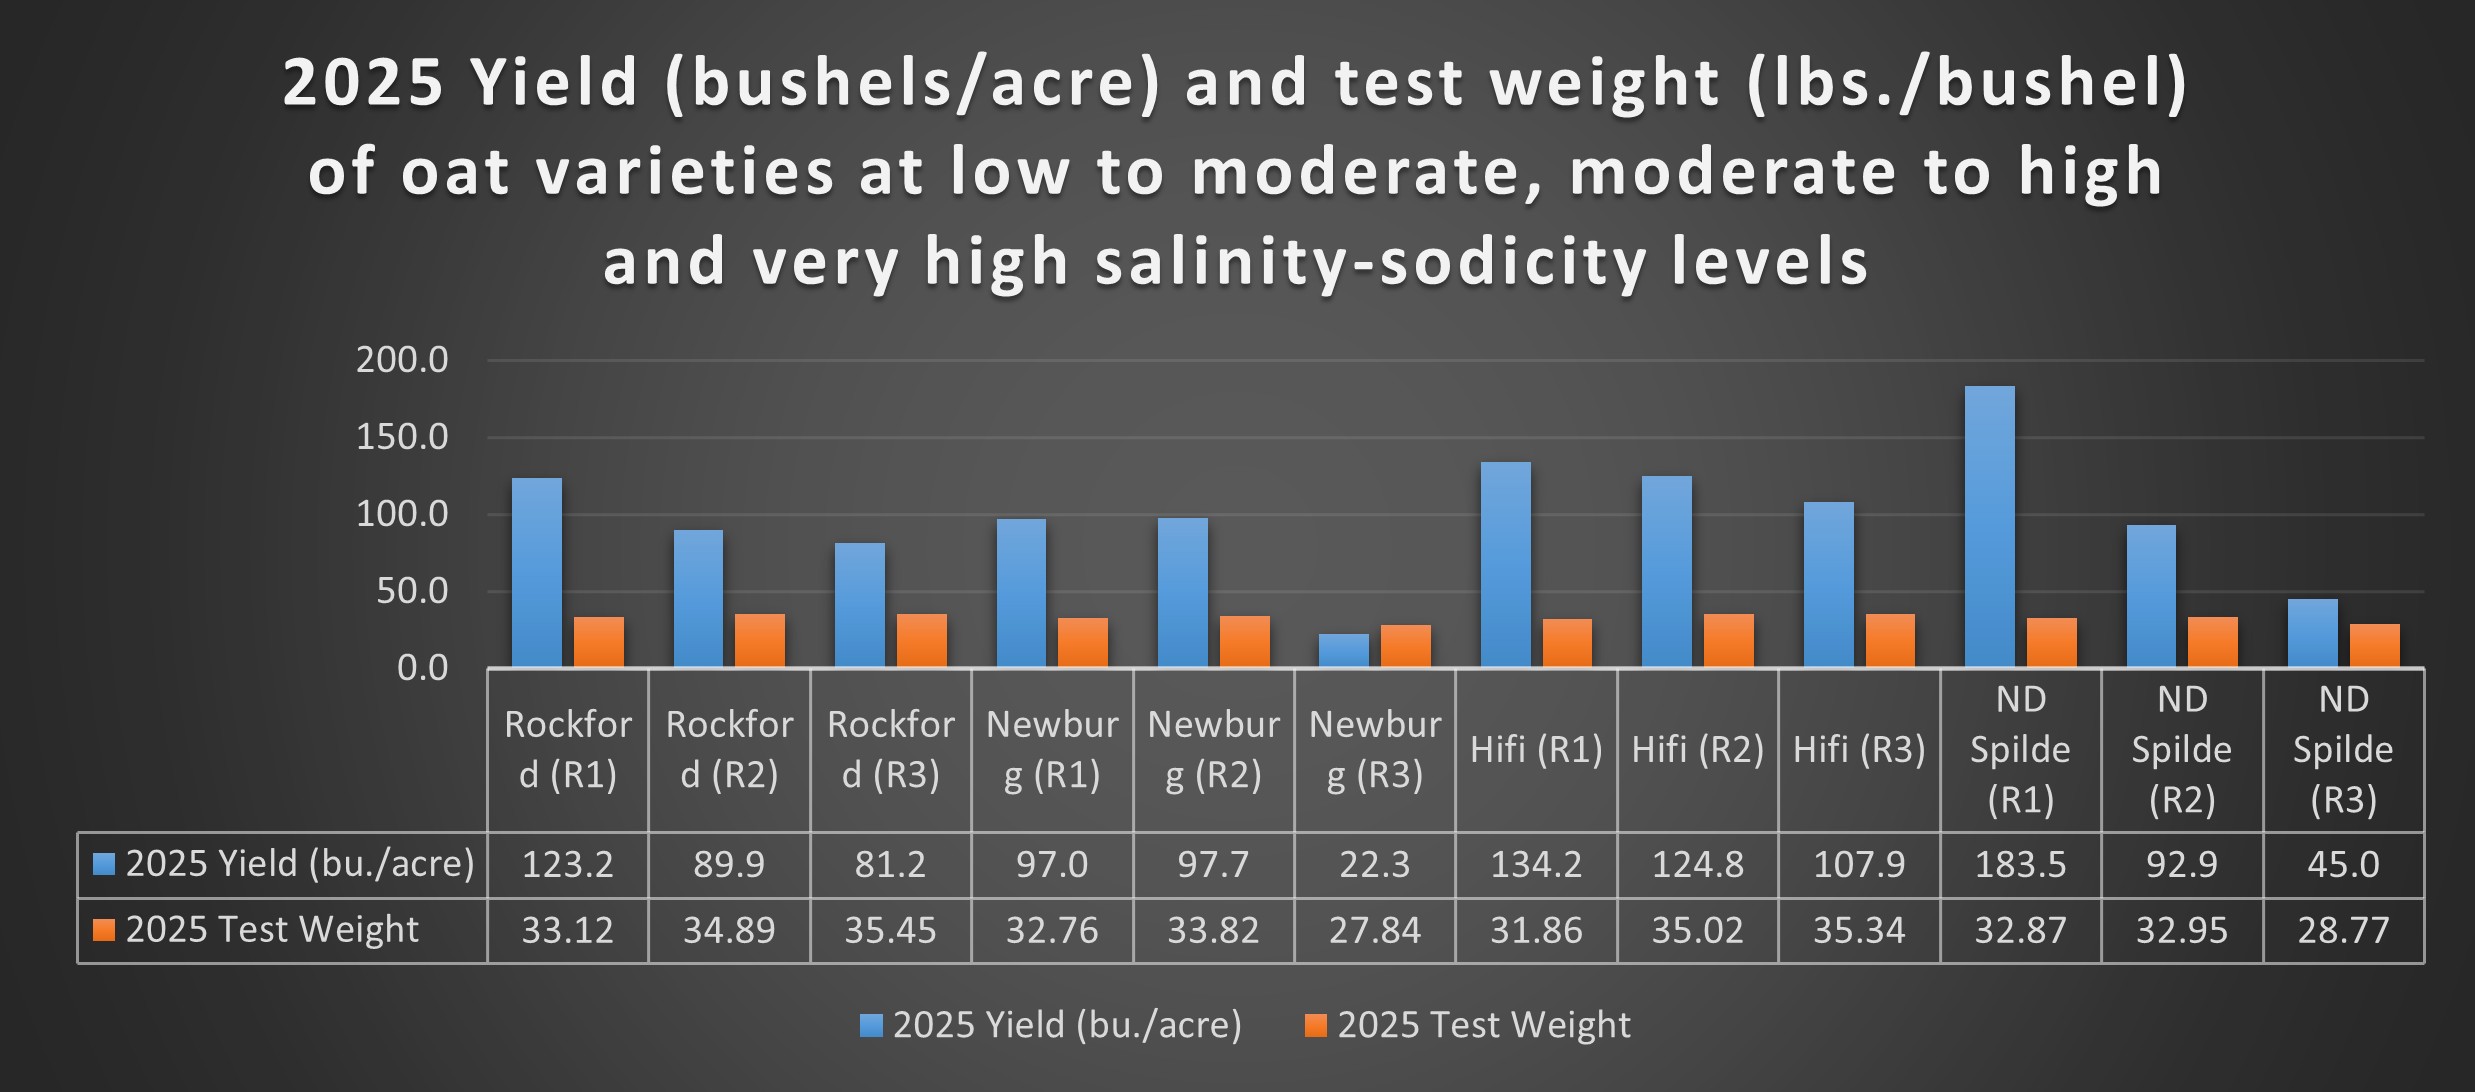
Level 1 oat yields were high, ranging from 97 to 183 bushels/acre. Level 2 yields were good (89.9–124.7 bushels/acre), with Rockford, Hifi, and ND Spilde averaging 27.3% lower than Level 1, while Newburg was up by 0.7%. Level 3 yields dropped by 51.5% compared to Level 1 and by 38% versus Level 2. See Figure 3 for details.
Figure 3. 2025 yield and test weight of four oat varieties.
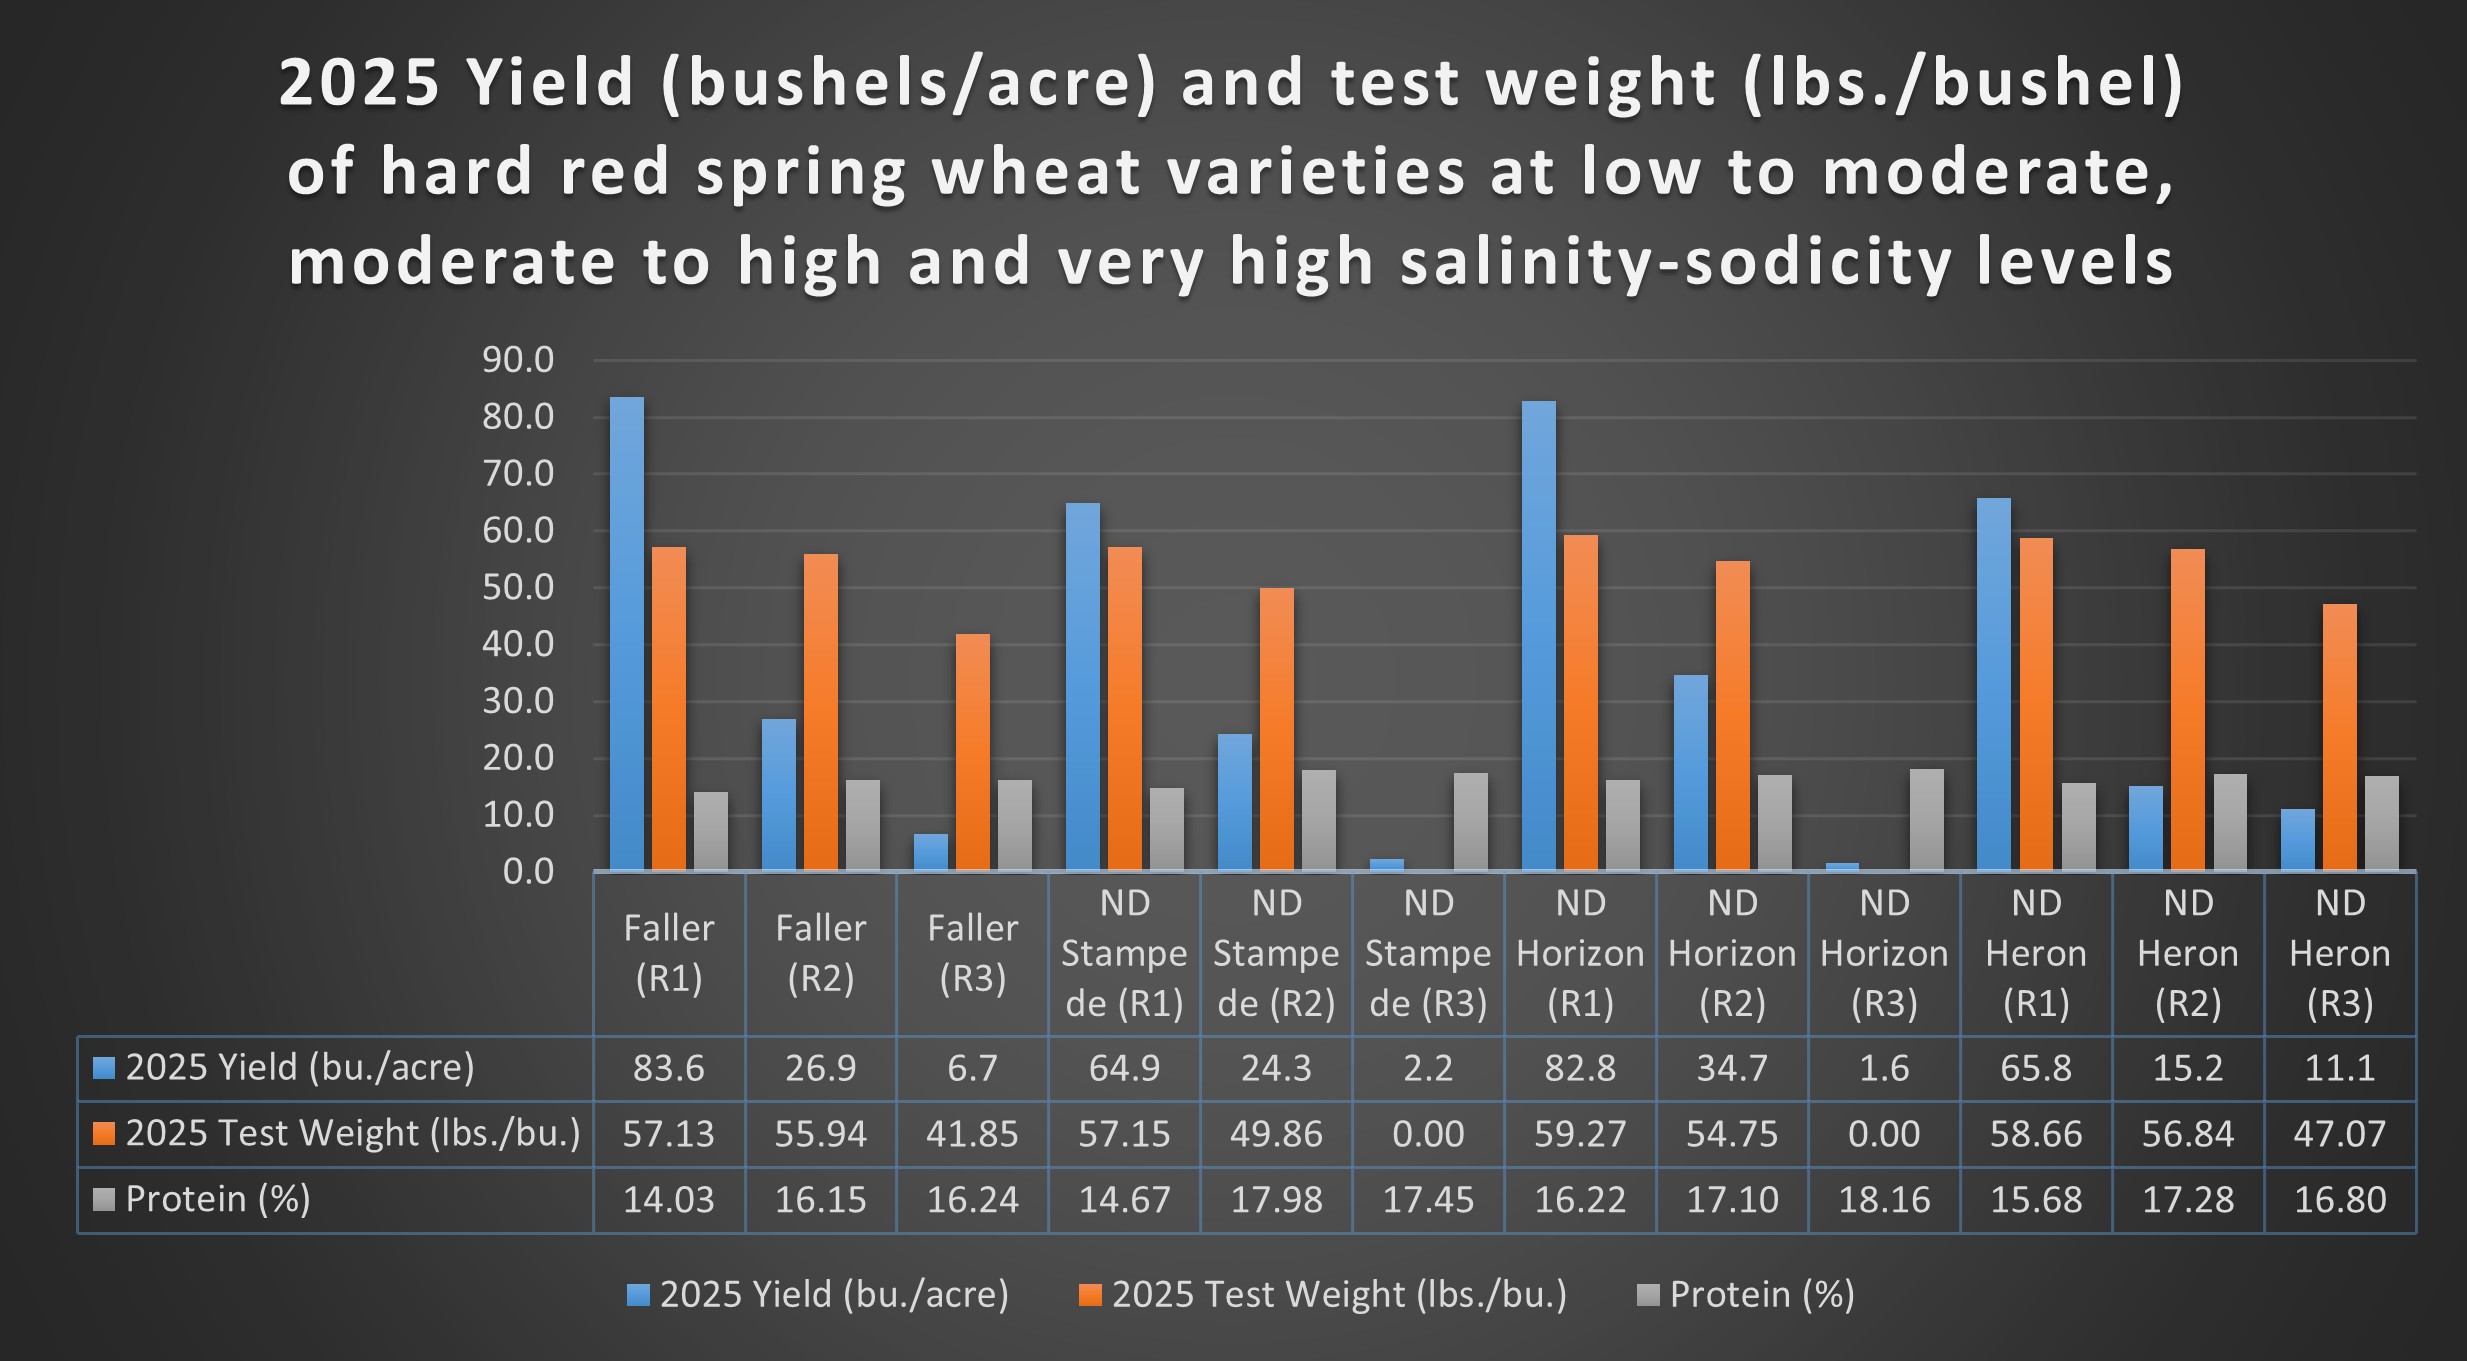
Spring Wheat
Figure 4. 2025 yield, test weights and protein of four hard red spring wheat varieties.