Enhancing Spring Wheat Yields through Split In-Season Nitrogen and Sulfur Applications in Conventional and No-Till Systems
(Research Report, Carrington REC, December 2025)Hypothesis: The use of a split application of nitrogen and sulfur significantly increases wheat yield under conventional and no-till cropping systems.
Objectives:
- Determine the combined effect of nitrogen and sulfur rate splits, finding the correct ratio to achieve the highest wheat yield and quality in conventional and no-till systems.
Determine the best method to predict nitrogen and sulfur plant status and fertilizer rates, considering regular soil testing, plant analysis, and multispectral data from active and passive sensors.
After a decade of borderline drought conditions, nitrogen and sulfur response in our region was fairly predictable. Split application, while environmentally sound, did not seem economically attractive because leaching wasn’t a significant problem. The past two growing seasons, which have been exceptionally rainy, showed us that this can change with a new weather cycle. Soil analysis results are often not accurate predictors of yield or grain quality response because of the influence of several climatic and other variables. Nitrogen and sulfur responses are particularly difficult to predict due to their mobile nature in the soil and because of the ever-shifting rates of mineralization from organic matter. Nitrogen and sulfur have long been known to have a synergistic relationship in affecting plant growth. Franzen et al. (2016) found that high nitrogen rates can increase sulfur deficiency severity and that active optical sensors can be a valuable tool for detecting in-season N and S deficiency. In a wet weather cycle, significant nutrient losses due to nitrate and sulfate leaching can be avoided by splitting the application between two timings. Furthermore, a split application of nitrogen can also mitigate nitrogen losses due to volatilization in no-till management where fertilizer cannot be incorporated.
Research Question/Objectives:
Hypothesis: The use of a split application of nitrogen and sulfur significantly increases wheat yield under conventional and no-till cropping systems.
Objectives:
- Determine the combined effect of nitrogen and sulfur rate splits, finding the correct ratio to achieve the highest wheat yield and quality in conventional and no-till systems.
- Determine the best method to predict nitrogen and sulfur plant status and fertilizer rates, considering regular soil testing, plant analysis, and multispectral data from active and passive sensors.
Materials and methods
In the growing seasons of 2024 and 2025, wheat trials were conducted in Carrington, ND, on a loam soil on no-till (2024 and 2025) and in Staples MN on sandy soil (2024 only) and in St. Paul, MN, on sandy loam soil (2025 only) with conventional tillage.
The treatments consisted of combinations of nitrogen and sulfur rates.
- Nitrogen rates: 0, 50, 75, 100 and 150 lbs N/acre
- Sulfur rates: 0, 10, 20 lbs S/acre
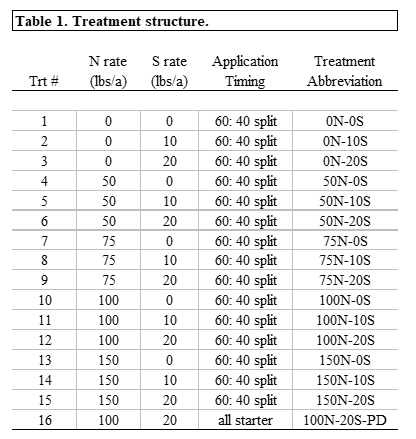
These nitrogen and sulfur levels were combined with each other in a full factorial arrangement accounting for 15 treatments. All 15 of those treatments were applied at a 60:40 split, with the first application being made at planting and the second applied at the Feekes 5 growth stage of wheat. A 16th treatment was used to contrast these treatments with a 100% starter application of 100 lbs of nitrogen and 20 lbs of sulfur (Table 1).
At the Feekes 5 growth stage, wheat biomass and tissue samples were collected to determine biomass weight and nitrogen and sulfur content. Soil samples were also collected at that time from the 0-6 and 6-24 inch depths for analysis of nitrate and sulfate content. NDVI imagery was taken by UAV.
At harvest, grain yield, grain protein, and test weight data were collected. Soil samples from each plot were analyzed for nitrate and sulfate content from the 0–24-inch depth.
Results
In 2024, yields responded similarly to treatments across the two locations and there were significant differences among the treatments (Figure 1). Sulfur application increased wheat yield by 30.5% at the same nitrogen levels. Specifically, 150N-20S (55.7 bu/a) and 150N-10S (56.1 bu/a) treatments significantly outperformed the 150N-0S treatment (40 bu/a). There was no significant difference between the 100N-20S-PD (47.6 bu/a) and 75N-20S (46.8 bu/a) treatments, showing that a split application with 25% less nitrogen can match the effectiveness of a full-rate, single application at planting.
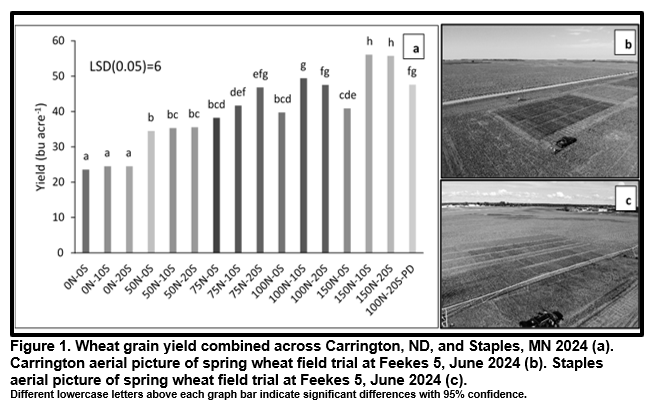
Figure 1. Wheat grain yield combined across Carrington, ND, and Staples, MN 2024 (a). Carrington aerial picture of spring wheat field trial at Feekes 5, June 2024 (b). Staples aerial picture of spring wheat field trial at Feekes 5, June 2024 (c).
Different lowercase letters above each graph bar indicate significant differences with 95% confidence.
Protein levels varied by location. Carrington maintained protein levels above 13% across treatments, thanks to fertile, loamy soil under no-till conditions. However, Staples showed protein content below 12% in most treatments, likely due to sandy soil conditions. Lower yields with higher N rates did show some increase in protein content. Total grain nitrogen was highest in treatments that included S, reinforcing the benefit of split applications, particularly in scenarios where N was reduced by 25% (Figure 2).
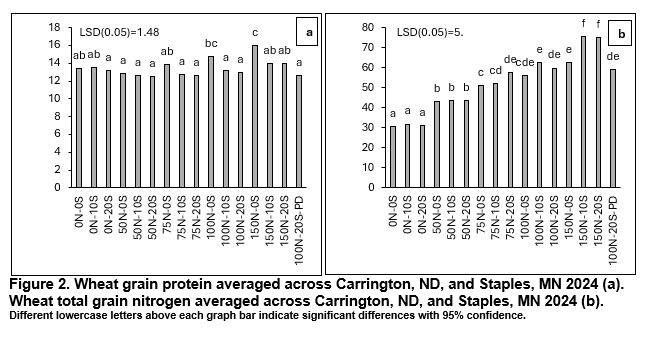
Figure 2. Wheat grain protein averaged across Carrington, ND, and Staples, MN 2024 (a). Wheat total grain nitrogen averaged across Carrington, ND, and Staples, MN 2024 (b).
Different lowercase letters above each graph bar indicate significant differences with 95% confidence.
In Carrington in 2025 above-average rainfall and a cool spring created very favorable early-season conditions for wheat. The site has fertile loamy soil, long-term no-till, high organic matter, and naturally high soil nutrient supply. When we measured the Normalized Difference Vegetation Index (NDVI) and the Normalized Difference Red Edge Index (NDRE) at Feekes 5, the values were high and uniform across treatments. NDVI and NDRE showed no significant differences among any of the nitrogen and sulfur rates. Even at this early stage, it was clear that fertilizer treatments were not separating, and yield potential appeared similar across the entire field (Figure 3b).
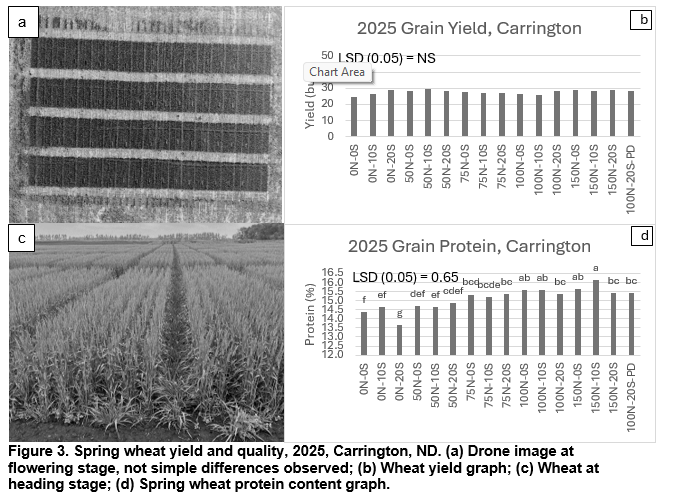
Figure 3. Spring wheat yield and quality, 2025, Carrington, ND. (a) Drone image at flowering stage, not simple differences observed; (b) Wheat yield graph; (c) Wheat at heading stage; (d) Spring wheat protein content graph.
As we approached harvest, visual observations, drone images, and plot photos all showed an even crop across all treatments. The yield data confirmed that there were no significant differences among treatments, with an average of 27.6 bu/acre. This yield is low for the area and was the result of several factors: heavy lodging after a wet August, declining numbers, and intense pressure from bacterial blight and Fusarium. The variety used, MN Rothsay, also struggled under these conditions. While yield did not respond, protein did (Figure 3d). Treatments with more than 75 lb N/acre produced noticeably higher protein, and combinations around 150 lb N with 10–20 lb S reached values above 16 percent. In this location, higher N and S improved quality, even though yield was limited by the season.
St. Paul in 2025 experienced a very wet growing season, with rainfall almost 20 percent above average, along with a cool spring. The soil is a sandy loam under conventional tillage, with naturally high fertility. Drone imagery at Feekes 5 showed a very uniform crop, and the NDVI and NDRE values confirmed this. NDVI averaged 0.75 and NDRE averaged 0.40, with no significant differences among N and S treatments. Just like in Carrington, early indicators suggested that yield differences would be minimal.
Later in the season, drone photos revealed heavy lodging caused by the extremely wet conditions (Figure 4a). Yield data, however, did show significant differences (Figure 4b). The highest yield, 71 bu/acre, occurred with the 50 lb N treatment and no sulfur. This plot had slightly less early vigor than the higher-N treatments, which may have allowed for better standability and more effective seed set under the lodging pressure. Protein content responded to nitrogen. A split application of 100 lb. N with 10 lb. S reached 15.8 percent protein, clearly higher than the 14.1 percent observed in the 0N–0S treatment (Figure 4d). Overall, the St. Paul site demonstrated that protein gains from N and S were consistent, even when lodging and weather limited yield.
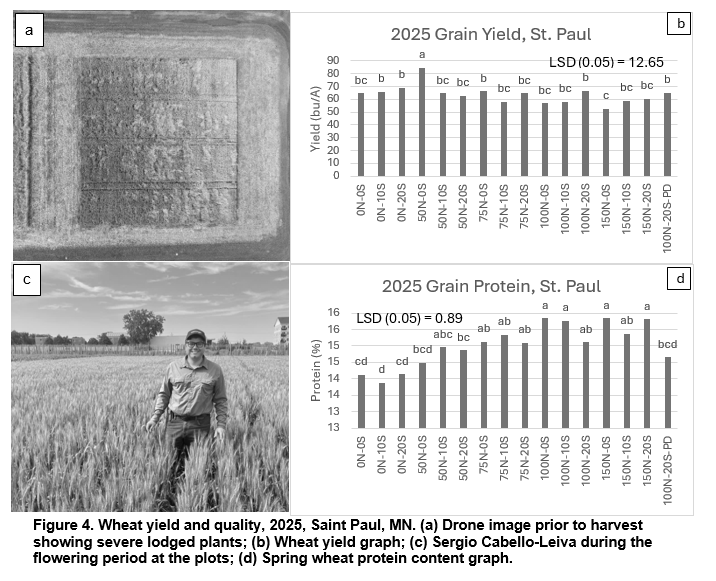
Figure 4. Wheat yield and quality, 2025, Saint Paul, MN. (a) Drone image prior to harvest showing severe lodged plants; (b) Wheat yield graph; (c) Sergio Cabello-Leiva during the flowering period at the plots; (d) Spring wheat protein content graph.
Conclusions
Based on the two seasons of research, this study supports that a split application strategy for nitrogen and sulfur can be a sensible tool for spring wheat production, providing benefits that span both high-response and low-response growing conditions.
The 2024 season clearly demonstrated the potential for significant gains in both yield and efficiency when conditions are favorable for a response. Adopting split sulfur and N applications offers multiple benefits for wheat production. Sulfur rates of 10 and 20 lbs/acre increased wheat yield by $30.5\% at equal nitrogen levels. Furthermore, split applications with 25% less nitrogen proved as effective as full-rate applications applied entirely at planting. Overall, split N and S applications showed the potential for higher yields with less fertilizer, offering a promising strategy for sustainable wheat production.
In contrast, the 2025 season highlighted the importance of the split application system for risk management and economic decision-making. In a season shaped by heavy rainfall, temperature, and lodging, there were no meaningful differences in final yield across fertilizer treatments. The most important lesson from this project is the power of in-season diagnostics: by Feekes 5, NDVI and NDRE readings clearly indicated there would be no response to additional fertilizer. This is a significant practical opportunity for growers to save fertilizer and money.
In summary, the combined results support the use of a split N and S fertilizer program, specifically when integrated with precision agriculture tools. These tools, whether drone imagery, NDVI sensors, or handheld devices, offer a quick and reliable way to assess crop status. With a split application system in place, growers gain flexibility to maximize profitability by driving yield in responsive years (2024) and reduce input costs and environmental impact by confidently skipping unnecessary applications in non-responsive years (2025). While protein increases were significant at N rates above 75 lbs/acre, growers must weigh the cost of these increases and extra passes across the field against the benefit when final yield is unaffected. Further testing will help fine-tune N and S recommendations, but this research establishes an encouraging pathway toward more efficient, profitable, and environmentally friendly wheat farming.
References
Franzen, D.W., L.K. Sharma, H. Bu, and A. Denton. 2016. Evidence for the ability of active-optical sensors to detect sulfur deficiency in corn. Agron J 108(5): 2158–2162. doi: 10.2134/agronj2016.05.0287.
This research was partially funded by the Minnesota Wheat Research and Promotion Council.