Energy and Protein Requirements of Finishing Steers Fed Dried Distillers Grains
(Research Report, Carrington REC, December 2025)The study conducted at the CREC aimed to determine the energy and protein requirements of North Dakota yearling steers fed DDGS-based finishing rations differing in crude protein concentration. By comparing animal performance, carcass composition, and energetic utilization between 13% and 15% CP diets, this research provides regionally relevant data to refine DDGS feeding strategies and guide economically and nutritionally sustainable beef production practices.
Dried distiller’s grains plus solubles (DDGS) is a coproduct of the ethanol production process and has become a major component of feedlot cattle rations across the United States. The high nutrient density and relative cost competitiveness to corn have made DDGS a cornerstone of ruminant nutrition strategies. The increasing production of renewable fuels, particularly ethanol and corn oil, has further expanded the availability of these corn coproducts for livestock feeding. However, questions remain regarding the optimal inclusion rates and crude protein (CP) concentrations needed to maximize growth performance, carcass composition, and energetic efficiency of finishing beef cattle.
Previous research has demonstrated that DDGS can effectively replace portions of traditional protein and energy sources in feedlot diets without compromising performance. Yet, the protein requirements of finishing cattle vary considerably with body weight, rate of gain, and energy density of the diet. Excess dietary protein can increase ration cost and alter nitrogen retention, whereas insufficient protein may limit growth and marbling potential. Refining protein inclusion levels is therefore critical to balance production efficiency, carcass quality, and environmental stewardship.
The Northern Great Plains feedlot sector presents a unique context for these evaluations due to its reliance on local grain and ethanol coproduct streams, variable feed costs, and climatic constraints on feedlot management. Understanding how incremental increases in dietary CP, such as from 13% to 15%, affect growth performance and carcass characteristics is especially important for producers optimizing DDGS-based rations under fluctuating market and feed conditions.
This study conducted at the North Dakota State University Carrington Research Extension Center (CREC) aimed to determine the energy and protein requirements of North Dakota yearling steers fed DDGS-based finishing rations differing in crude protein concentration. By comparing animal performance, carcass composition, and energetic utilization between 13% and 15% CP diets, this research provides regionally relevant data to refine DDGS feeding strategies and guide economically and nutritionally sustainable beef production practices.
Materials and Methods
All procedures involving the use of animals in these experiments were approved by the North Dakota State University Institutional Animal Care and Use Committee (approval number IACUC20240031). This experiment was conducted at the CREC between December 2024 and July 2025.
Treatments, animals, initial processing, and study initiation
One hundred forty-five cross-bred steers (802 ± 84 lbs, initial body weight (BW)) were used in this experiment. Steers were consigned and delivered to the CREC from multiple ranches across North Dakota throughout October and November 2024. Steers were backgrounded on a similar ration for approximately 65 days prior to the initiation of the study.
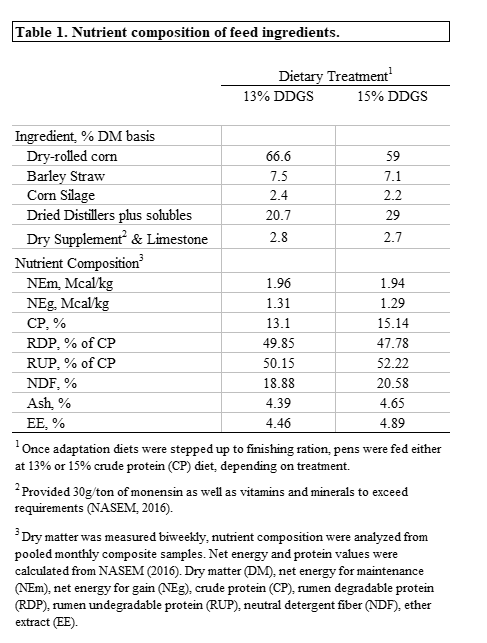
Steers were stratified by source (Block 1-3). On December 16, 2024, steers from Blocks 1 and 2 were weighed for BW collection, which was used for allotment purposes. On December 17, 2024, steers from Blocks 1 and 2 were reweighed, processed, sorted, and placed into randomly assigned one of 12 pens ([Block 1 = 8 pens, Block 2 = 4 pens]. On January 23, 2025, steers from Block 3 were weighed for BW collection used for allotment purposes. On January 24, 2025, steers from Block 3 were reweighed, processed, sorted, and placed into randomly assigned one of 12 pens. All pens were in a randomized complete block design (blocked by source). Pens were randomly assigned to one of two dietary treatments (6 pens/treatment): 13% crude protein with DDGS as the sole protein supplement (13% DDGS); 15% crude protein with DDGS as the sole protein supplement (15% DDGS). The experiment was initiated with a 28-d adaptation period and a 183-, 169- and 171-d finishing period for Block 1,2, and 3, respectively. All live BW measurements were pencil shrunk 4% to account for digestive tract fill, in accordance with equations to determine shrunk body weight from NASEM (2016).
Steers were harvested when visually appraised by trained observers to have 12th rib fat (RF) thickness of 0.5 in. Final BWs were recorded at 0800 on shipping day, approximately 24 hours post final feeding the day prior. After weighing, steers to be harvested were comingled into a holding pen and offered water. Steers were gathered for delivery approximately 1200 h and shipped to the commercial abattoir located 800 km from the CREC. Electronic ID tags were used to determine harvest order. Hot carcass weights and video camera image carcass data were collected from the beef plant.
Growth performance, carcass trait, dietary net energy utilization calculations
Two steers (1 from 13% DDGS, 1 from 15% DDGS) died during the study, due to respiratory disease. Growth performance for both experiments data reported on a deads and removals included basis. Steers that were removed from the study or that died during the study were assumed to have consumed feed equal to the pen mean dry matter intake (DMI) up to the point of removal or death. Overall average daily gain (ADG) was calculated as the difference between initial and final BW. Overall feed conversion efficiency (G:F) was calculated from ADG/DMI.
Observed dietary net energy (NE) was calculated from daily energy gain (EG; Mcal/d) according to the medium frame steer calf equation using the equivalent BW adjustment. Observed-to-expected (O:E) NEm and NEg were calculated from observed dietary NE values for maintenance or gain divided by tabular estimates of NE for maintenance or gain (NASEM, 2016).
Hot carcass weight (HCW) was captured immediately following the harvest procedure. Video image data were obtained from the commercial abattoir for rib eye area (REA), rib fat (RF), and USDA marbling scores. Kidney, pelvic, and heart fat (KPH) percentage was determined via plant-specific algorithm. Dressing percentage (DP) was calculated as: HCW/ (final BW × 0.96). Yield grade (YG) was calculated according to the USDA regression equation (USDA, 2017). Estimated empty body fat (EBF) percentage and adjusted final body weight (AFBW) were calculated from observed carcass traits (Guiroy et al., 2002).
Statistical Analysis
The experiment was analyzed separately using the GLIMMIX Procedure of SAS 9.4 (SAS Institute Inc., Cary, NC) with pen serving as the experimental unit. The model includes the fixed effects of protein amount (13%, 15%), and the random effect of block. For the distribution of categorical variables (distributions of USDA Yield and Quality grade), counts for each category were entered by pen, and a multinomial analysis for ordinal data was conducted following the procedure recommended by Bowley (2015), using pen within treatment as the subject. Significance was declared at P ≤ 0.05, and tendencies were considered when 0.10 > P > 0.05.
Results
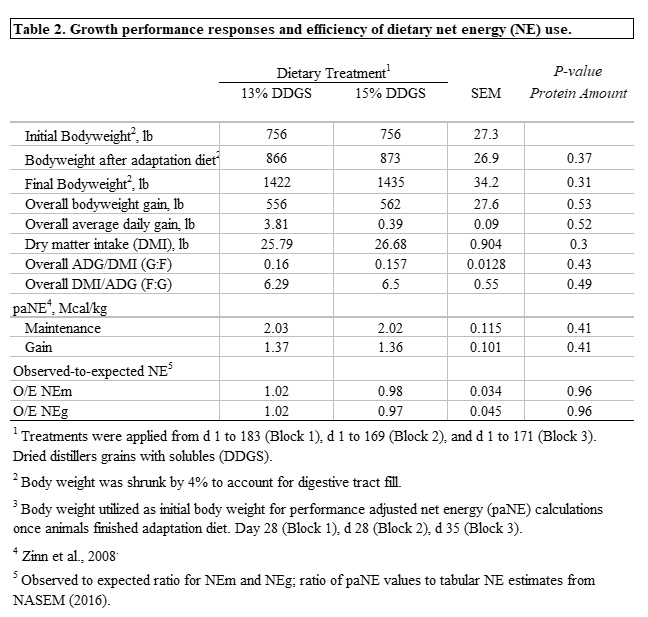
Growth performance data are shown in Table 2. Initial BW or BW after diet adaptation did not differ (P = 0.37) among treatments. No differences in Final BW, BW gain, or ADG were observed (P ≥ 0.31). No differences in DMI, GF, FG, performance adjusted net energy for gain or maintenance, or the observed-to-expected ratio of net energy were observed (P ≥ 0.30).
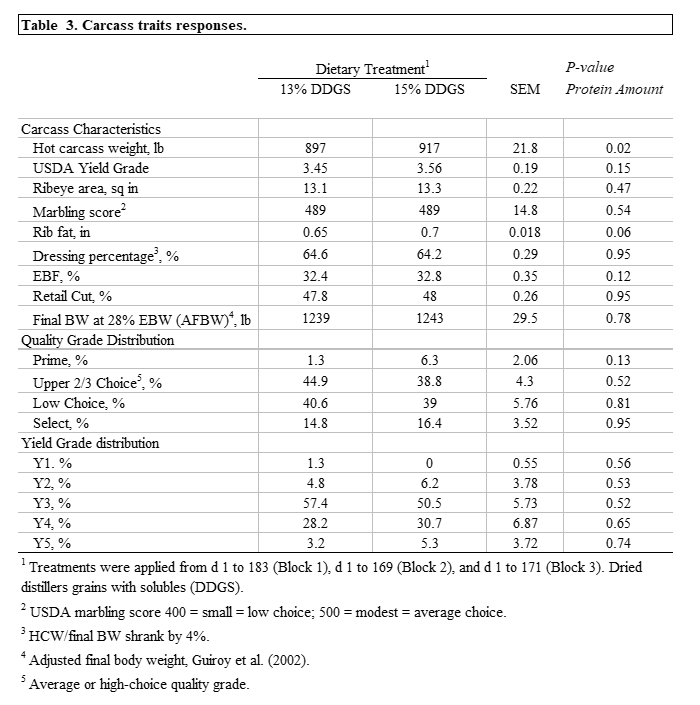
Carcass trait data are shown in Table 3. Hot carcass weight was greater (P = 0.02) for steers fed 15% DDGS compared with steers fed 13% DDGS, by an average of 2.3% No effect of protein amount were observed in USDA YG, REA, marbling score, dressing percentage, EBF, retail cut %, AFBW, or distribution of USDA Yield and Quality grades (P ≥ 0.12). There was a tendency (P = 0.06) for increased rib fat thickness with a numerical increase observed for steers fed 15% CP.
Conclusion
Increasing dietary crude protein from 13% to 15% to cattle during finishing increased hot carcass weight. Cattle fed 15% crude protein tended to have increased rib fat thickness. No differences in intake or net energy performance were observed in this study. During periods of decreased DDGS and input costs, increasing levels of dietary crude protein using DDGS may be an economically feasible option.
This research was partially funded by the North Dakota Corn Utilization Council. This research was supported, in part, by the intramural research program of the U.S. Department of Agriculture, National Institute of Food and Agriculture, Hatch project accession number, 7006839. The findings and conclusions in this preliminary publication have not been formally disseminated by the U. S. Department of Agriculture and Should not be construed to represent any agency determination or policy.
Acknowledgement
The authors would like to thank all of the cattle consigners who supplied animals for this study. The authors would like to thank the crew of the CREC Livestock Unit for daily husbandry of the animals.
Literature Cited
Bowley SR. 2015. A hitchhiker’s guide to statistics in biology: generalized linear mixed model edition. Guelph (ON): Any Old Subject Books.
Guiroy PJ, Tedeschi LO, Fox DG, Hutcheson JP. 2002. The effects of implant strategy on finished body weight of beef cattle. J Anim Sci. 80:1791–1800. doi:10.2527/2002.8071791x.
NASEM. 2016. Nutrient requirements of beef cattle. 8th rev. ed. Washington (DC): National Academies Press. doi:10.17226/19014.
Zinn RA, Barreras A, Owens FN, Plascencia A. 2008. Performance by feedlot steers and heifers: daily gain, mature body weight, dry matter intake, and dietary energetics. J Anim Sci. 86:2680–2689. doi:10.2527/jas.2007-0561.
Calves consigned to Dakota Feeder Calf Show.