
2025 Farm Financial Analysis for South Central North Dakota
The North Dakota Farm Management Program published their 2025 Annual Report for South Central North Dakota in April, including a summary of the farm and ranch financial data for farms and ranches enrolled in the ND Farm Management Programs in the region. The South Central Region consists of 20 counties in south central/eastern North Dakota, excluding the Red River Valley.
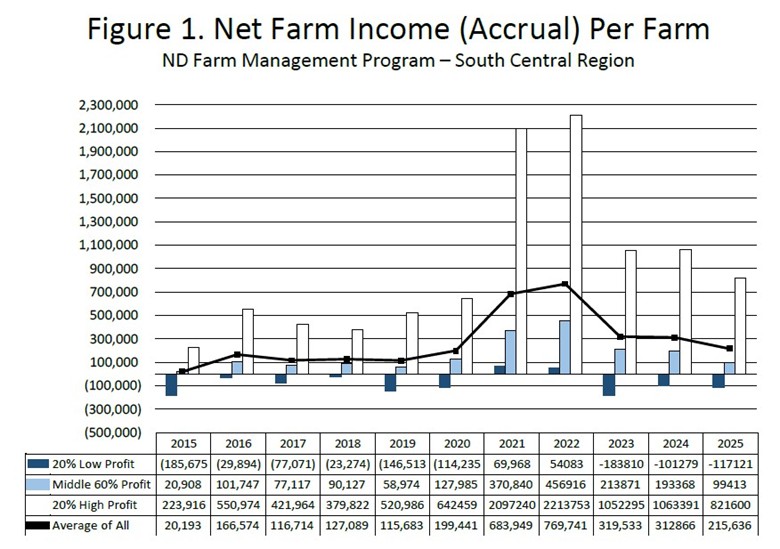
Average net farm income in the region for 2025 was $215,636, compared to $312,866 in 2024. Net farm income ranged from -$117,121 (low 20% farms) to $821,600 (high 20% farms). The $215,636 net farm income compares with a low of $20,193 in 2015 and a high of $769,741 in 2022, when making comparisons over the last 11 years.
Gross cash farm income on the average farm was $1,575,767. Somewhat surprisingly, the low 20% profit farms reported a gross income of $1,333,215 compared to the middle 20% of $667,587, and the high 20% profit farms reported gross cash income of $3,916,956. This indicates that some larger farms were less profitable than the middle 20% profit farms—not unusual in years when margins are thin. Farms in the middle range of size can often weather difficult times better than larger farms with improved efficiency and usually less debt.
The average net worth of the farms and ranches in the region was $3,658,820, a decrease in net worth of $568,641 (13.5%) from 2024. In addition, the rate of return on assets was 3.6% and rate of return on equity was 2.8%. This is the third consecutive year with ROA > ROE, indicating that debt is not paying for itself. The high cost of expenses combined with low commodity prices do not allow farm and ranch operations (on average) the opportunity to produce crops at a high enough level to pay debts and increase net worth.
Few crops returned positive returns in 2025 when excluding government payments. Oil sunflowers were the most profitable at $102.60 per acre. The next most profitable crop was barley at $1.38 per acre. When including government payments, sunflower was still the most profitable crop at $120.93, followed by corn at $41.26 per acre. Pinto beans were the least profitable crop at −$47.38 per acre.
| Net Returns per Crop Acre of Cash Rented Land for Selected Crops | ||
|---|---|---|
Net Return without Govt. Payments | Net Return with Govt. Payments | |
| Barley | 1.38 | 21.52 |
| Corn | -2.19 | 41.26 |
| Soybeans | -2.75 | 27.00 |
| Spring Wheat | -3.66 | 34.58 |
| Durum | -4.79 | 31.22 |
| Pinto Beans | -47.38 | -47.38 |
| Sunflowers | 102.60 | 120.93 |
Beef cow-calf whole herd operations with backgrounding earned an average of $1,879.54 of gross revenue per cow and $961.16 in total direct and indirect expenses, for a net return of $918.38 per cow. The average weaning weight of calves was 530 pounds and the average feed cost per cow was $572.60.
| Key Financial Ratios | |
|---|---|
| Current Ratio | 2.20 |
| Working Capital to Gross Revenue | 66.2% |
| Working Capital to Operating Expenses | 91.4% |
| Debt to Asset Ratio | 31.0% |
| Return on Assets | 3.6% |
| Return on Equity | 2.8% |
| Operating Expense Ratio | 72.5% |
| Depreciation Expense Ratio | 9.3% |
| Interest Expense Ratio | 6.2% |
| Net Farm Income Ratio | 12.0% |
For additional information or to read the entire report, go to: www.ndfarmmanagement.com/resources/.
Jason Fewell, Ph. D.
Jason.Fewell@lrsc.edu
Farm Management Education Instructor