Farinograph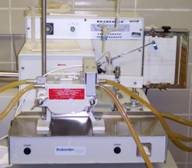
We have two farinographs in our facilities.
The farinograph is a recording dough mixer that measures and records the torque developed by the action of the mixer blades on the dough during mixing. It is used to estimate the water absorption of flours, the relative mixing time, the stability to overmixing, and rheological properties of the dough during mixing. These curves typically consist of an increase in resistance-to-extension (increase in curve height) to an identifiable peak followed by a decline that reflects a decrease in resistance-to-extension. As can be expected, the curves for strong and weak flours exhibit pronounced differences.
The mixing bowl can be designed for either a 50-g or a 300-g flour sample. Mixing is performed by two sigma-shaped blades that rotate at a differential speed of 3:2. Temperature is maintained at 86˚F (30˚C) during mixing by a thermostatically controlled circulating water bath that pumps water through a cavity in the mixing bowl. A dynamometer drives the mixing blades and the torque developed is transmitted by a lever system to a scale and a recording mechanism (paper chart and/or computer).
Arrival Time is the time to the nearest half-minute from the first addition of the water until for the top of the curve to first intersect the 500 B.U. consistency line. This is also referred to as hydration time.
Peak Time is the time to the nearest half-minute from the first addition of the water to the development of the dough’s maximum consistency (minimum mobility), immediately before the first indication of weakening. The peak time is the time needed for the curve to reach maximum dough consistency and is usually the highest point on the curve when the curve is centered on the 500 B.U. line. In some flours the hydration peak will actually be higher than the dough development peak. If the peak occurs at a short time (1 to 3 minutes) the curve should be examined carefully for a second peak that relates more accurately to the dough development peak. The second peak may be difficult to find. Often looking at the underneath of the curve or hanging the curve on a wall and backing a few steps away to examine the curve may be helpful.
It is important to locate the dough development peak as many of the properties of the curve are based on the peak time. Unfortunately the computer procedure only picks the highest peak and, thus, may give false information. Also picking the wrong peak will cause the curve to be centered at the wrong absorption and also affect other interpretations from the curve. The comparison of peak times of several flours provides an indication of their relative strength with stronger flours normally requiring longer development times.
Departure Time is the time to the nearest half-minute from the first addition of the water until the point where the top of the curve leaves the 500 B.U. line. In general, a longer departure time indicates strong flour.
Mixing Tolerance Index (MTI) is the difference in Brabender Units from the top of the curve at the peak to the top of the curve measured five minutes after the peak is reached. The MTI is an indication of the mixing tolerance of flour; an MTI value of 30 B.U. or less is rated very good to excellent for hard wheat flours. A flour with a MTI greater than 50 B.U. indicates less tolerance and often indicates more difficulties during mechanical handling and makeup of the dough.
Stability is the difference in time, to the nearest half-minute, between the point where the top of the curve first intercepts the 500 B.U. line (arrival time), and the point where the top of the curve leaves the 500 B.U. line (departure time). Stability time is correlated with flour strength. Flours with long stability times are generally more suited for hearth or variety bread production and often require longer mixing times.
Time to Breakdown is the time to the nearest half-minute form the start of the mixing until there has been a decrease of 30 Brabender Units from the peak point.
Besides the farinogram measurements described above, one additional important piece of information obtained with this instrument is the farinograph water absorption. This value represents the amount of water required to develop a standard dough consistency of 500 B.U. at the peak of the curve. With too much water, the center of the curve will fail to reach the 500 B.U. line, while with too little water, it will exceed that line. It should be noted that in addition to water, the flour’s protein content also affects the curve height. Baking absorption probably will not be the same as the farinograph absorption; however, in many cases there is a good correlation between the two. This is particularly true if the flour protein contents are similar.